Transcription
Lecture Notes onLangmuir Probe DiagnosticsFrancis F. ChenElectrical Engineering DepartmentUniversity of California, Los AngelesMini-Course on Plasma Diagnostics, IEEE-ICOPS meeting, Jeju, Korea, June 5, 2003
1TABLE OF CONTENTSINTRODUCTION. 1I. The Probe Characteristic. 2A. Parts of the I – V curve. 2B. The Transition Region. 2C. Electron saturation. 3D. Floating potential . 5E. Space potential. 6F. Ion saturation current. 6II. Design of Probes and Circuits for RF Environments. 8A. Probe construction . 8B. Probe circuits.10C. RF compensation.12III. Theories of Ion Collection .15A. Planar sheaths.15B. Orbital Motion Limit (OML) theory .17C. Allen-Boyd-Reynolds (ABR) theory .19D. Bernstein-Rabinowitz-Laframboise theory.21E. Parametrized ion curves .22F. Tests of collisionless theories .251. Fully ionized plasmas .252. High density rf plasmas .263. Low density dc plasmas .274. Moderate density plasmas.285. Low density rf plasmas .30IV. Sample Analyses of Experimental Results .31A. A typical rf plasma.31B. Example of a problematic probe curve .32V. Special Techniques.36A. Distribution functions .36B. Double probes and hot probes.37C. Capacitively coupled probes .38References.40
1INTRODUCTIONOf all the ways to measure a plasma, the Langmuir probe is probablythe simplest, since it consists of sticking a wire into the plasma and measuringthe current to it at various applied voltages. However, it is an intrusive, notremote, technique; and the “wire” must be carefully designed so as not to interfere with the plasma nor be destroyed by it. Worse than that, the interpretation of the current-voltage (I – V) curves is difficult and has spawned a largeliterature of theoretical papers. In a short lecture, little of this can be discussed in detail. Specialized topics and related electrostatic diagnostics, suchas emissive probes, double probes, capacitive probes, oscillation probes,probes in flowing or high pressure plasmas, and probes in a magnetic field canbe mentioned only summarily.On the other hand, the most widespread use of Langmuir probes atpresent is in the semiconductor industry, where radiofrequency (rf) sourcesare used to produce plasmas for etching and deposition. These partially ionized plasmas require special techniques in probe construction and theory.Emphasis will be given to this new forefront of diagnostics research.GENERAL REFERENCESF.F. Chen, Electric Probes, in "Plasma Diagnostic Techniques", ed. by R.H.Huddlestone and S.L. Leonard (Academic Press, New York), Chap. 4, pp.113-200 (1965).L. Schott, Electrical Probes, in “Plasma Diagnostics”, ed. by W. LochteHoltgreven (John Wiley, New York, 1968), Chap. 11.J.D. Swift and M.J.R. Schwar, “Electrical Probes for Plasma Diagnostics” (Elsevier, New York, 1969).P.M. Chung, L. Talbot, and K.J. Touryan, “Electric Probes in Stationary andFlowing plasmas” (Springer-Verlag, New York, 1975).I.M. Hutchinson, “Principles of Plasma Diagnostics” (Cambridge Univ. Press,Cambridge, 1987), Chap. 3.N. Hershkowitz, How Langmuir Probes Work, in “Plasma Diagnostics”, Vol.1, ed. by O. Auciello and D.L. Flamm (Academic Press, Boston, 1989),Chap. 3.
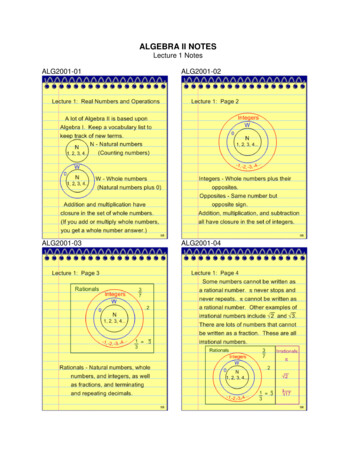
2I. THE PROBE CHARACTERISTICA. Parts of the I – V curveLet the plasma potential (space potential) be Vs, and the potential applied to the probebe Vp. If the chamber walls are metal and grounded, Vs is normally of the order of 5KTe.When Vp Vs, an electron current Ie is collected; the probe current is negative. When Vp Vs, an ion current Ii is collected. It is customary to plot I – V curves with Ie positive and Iinegative. Such a plot is shown in Fig. 1. There are five main parts.200.6Electron saturation"knee"I (mA)15100.50.3X1050.2VfVs00.0Ion saturation-5-100-0.2-80-60-40Volts-20020Fig. 1. An idealized I – V curve. The left curve is expanded 10X to show the ion current.The space potential Vs is near the “knee” of the curve. At the far left, where all theelectrons have been repelled, we have the Ion Saturation current, Isat. The Floating PotentialVf, is where the ion and electron currents are equal, and the net current is zero. In the Transition Region, the ion current is negligible, and the electrons are partially repelled by the negative potential Vp Vs. In a Maxwellian plasma, this part of the curve is exponential. When Vp(or just V) reaches Vs, all of the random thermal flux of electrons is collected. In the ElectronSaturation region, Ie grows only slowly because of the expansion of the sheath. From the I –V curve, the plasma density n, electron temperature KTe, and plasma potential Vs can be determined, but not the ion temperature.B. The Transition RegionThe exponential part of the I-V curve, when plotted semi-logarithmically vs. the probevoltage Vp, should be a straight line if the electrons are Maxwellian:I e I es exp[e(V p Vs ) / KTe )] ,(1)where1/ 2 KTe I es eAne v / 4 ene A 2π m ,(2)A being the exposed area of the probe tip. Here Ies is the saturation electron current, or random thermal current to a surface at Vs. Eq. (1) shows that the slope of the (ln I) Vp curve isexactly 1/TeV and is a good measure of the electron temperature. (It is convenient to write
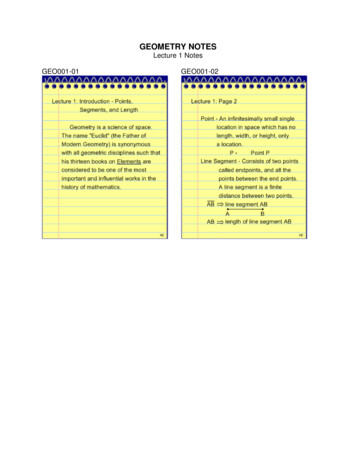
3KTe/e as TeV , the electron temperature in eV). This is a very robust relationship, and Te is theeasiest quantity to obtain from a probe. As long as the electrons are Maxwellian and are repelled by the probe, the EEDF at a potential V 0 is proportional to22f (v) e (½mv eV ) / KTe e e V / KTe e ( mv / 2 KTe ) .(3)We see that f(v) is still Maxwellian at the same Te; only the density is decreased byexp( e V /KTe). Thus, the slope of the semilog curve is independent of probe area or shapeand independent of collisions, since these merely preserve the Maxwellian distribution.However, before Ie can be obtained from I, one has to subtract the ion current Ii. This can bedone approximately by drawing a straight line through Isat and extrapolating it to the electronregion.100IeIe(fit)Ie(raw)I (mA)10Slope 0.335KTe 2.99 eV10.1-505V101520Fig. 1. A semilog plot of electron current from an I – V curve in an rf plasma. The lower curve is the raw databefore the ion current is subtracted from the total current.1One can estimate the ion contribution more accurately by using one of the theories of ioncollection discussed below, but refinements to this small correction are usually not necessary,and they affect only the high-energy tail of the electron distribution. One easy iteration is tochange the magnitude of the Isat correction until the ln I plot is linear over as large a voltagerange as possible. Fig. 1 shows a measured electron characteristic and a straight-line fit to it.The ion current was calculated from a theoretical fit to Isat and added back to I to get Ie. Theuncorrected points are also shown; they have a smaller region of linearity. If the EEDF(Electron Energy Distribution Function) is not Maxwellian, f(v) can sometimes be determined from the shape of this curve. This will be discussed later.C. Electron saturationThe exponential growth of Ie with Vp should continue until Vp Vs, when none of theelectrons is repelled by a negative potential. The electron current “saturates”. Since the electron velocities are (m/M)1/2 times larger than ion velocities, one would expect Ies to be 200times as large as Isat (in argon). In low-pressure, unmagnetized, dc discharges, this is indeed
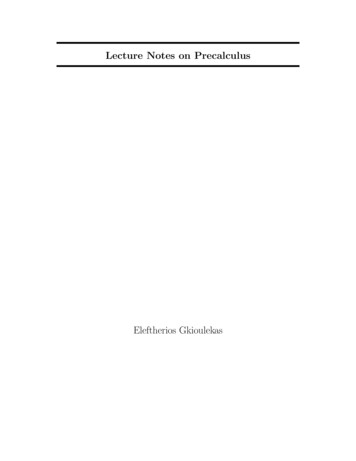
4true ; the knee of the curve is sharp and is a good measure of Vs. For Vp Vs, Ie increasesslowly as the collection area grows due to an increase in sheath thickness, the shape of thecurve depending on the shape of the probe tip. One might think that measurement of Ieswould give information on the electron density, but this is possible only at low densities andpressures, where the mean free path is very long. Otherwise, the current collected by theprobe is so large that it drains the plasma and changes its equilibrium properties. It is betterto measure n by collecting ions, which would give the same information, since plasmas arequasineutral. More importantly, one should avoid collecting saturation electron current formore than a few milliseconds at a time, because the probe can be damaged.2However, this ideal situation is rarely found in practical devices. Effects such as collisions and magnetic fields will lower the magnitude of Ies and round off the knee so that Vs ishard to determine. In particular, magnetic fields strong enough to make the electron Larmorradius smaller than the probe radius will limit Ies to only 10-20 times Isat because the probedepletes the field lines that it intercepts, and further electrons can be collected only if theydiffuse across the B-field. The knee, now indistinct, indicates a space potential, but only thatin the depleted tube of force, not Vs in the main plasma. In this case, the I – V curve is exponential only over a range of a few KTe above the floating potential and therefore samplesonly the electrons in the tail of the Maxwellian. Figure 2 shows an I – V curve in a magnetized plasma, where the knee is just a small bend occurring where Ie is only 10-30 times theion current.4E-03Electron current3E-032E-031E-030E 00-1E-03-1001020Probe voltage30405060Fig. 2. Example of an I – V curve in a magnetized, rf plasma.Collisions can also limit Ies. In the high-pressure limit, electrons must diffuse throughthe neutral gas to reach the sheath edge, so the current there is limited by the diffusion rate.In rf plasmas, Vs Vp can fluctuate at the rf frequency, and electron collection depends on thephase and velocity of the electron when it enters the sheath. An example of an I – V curve inan unmagnetized rf plasma is shown in Fig. 3.a Here electron saturation begins at Ie not muchlarger than the maximum ion current. The curve is linear only over a relatively small currentrange. This range is reduced even further by the presence of a fast electron population.Figure 4. shows such a case. The electron tail can distort the apparent electron temperatureof the bulk. This will be discussed in a later section. In Fig. 3b, electron saturation currentincreases linearly from the knee to the value Ies should have. The reason for this is not yetknown.
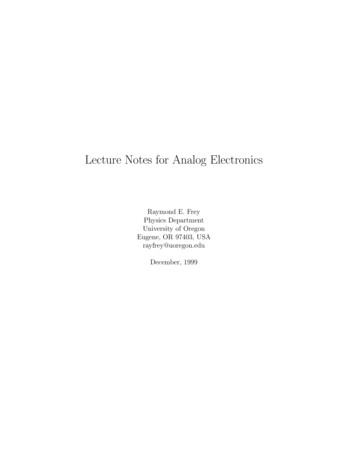
50.11IeIe(fit)0.1I (mA)I -101030V5070-2090-10010V2030405060Fig.3. Example of an I – V curve in an unmagnetized rf plasma (a) with and (b) without fast electrons1.D. Floating potentialThe potential Vf is defined by Ii Ie, where Ie is given by Eqs. (1) and (2) if the electrons are Maxwellian. Ii can be calculated from one of the theories presented in a later section but for this purpose can be estimated from the Bohm current3I B α neAcs , cs ( KTe / M )½ , α 0.5 ,(4)where M is the ion mass. This current is caused by the electric field in the presheath whichaccelerates ions to a velocity of cs, the minimum required to form a sheath. Setting Eqs. (1)and (4) equal yieldsKT 2M V f Vs e ln (5) .2e π m The value of Vf Vs is about –3.5TeV for hydrogen and 5.4TeV for argon. Vf is more negative than this if there are fast “primary” electrons or if there are uncompensated rf fields.Strictly speaking, Eq. (4) applies only to plane probes. For cylindrical probes there is a640530320η , α /αfα40210100.0100.11ξp10100100010000Fig. 4. Decrease of Vf for cylinders from its asymptotic value as ξp is decreased. The effective Bohmcoefficient α is also shown, as well as its value normalized to α0 0.61.geometrical correction4 which lowers the value of 5.4TeV to between –4 and –5TeV, depending on the ratio of probe radius to Debye length. The function Vf(ξp) is shown in Fig. 4,where ηf eVf/KTe. An analytic fit to this curve is given by
61(η f )6 1( A ln ξ p B )6 1(6)(C ln ξ p D)6where A 0.583, B 3.732, C 0.027, and D 5.431.E. Space potentialThe time-honored way to obtain the space potential (or plasma potential) is to drawstraight lines through the I – V curve in the transition and electron saturation regions and callthe crossing point Vs, Ies. This does not work well if Ies is curved, as in Fig. 3a. In that case,there are two methods one can use. The first is to measure Vf and calculate Vs from Eq. (5).The second is to take the point where Ie starts to deviate from exponential growth; that is,where I e′ (V ) is maximum or I e′′ (V ) is zero. If I e′ (V ) has a distinct maximum, a reasonablevalue for Vs is obtained, as illustrated in Fig. 5.It would be dangerous to equate the current there to Ies in order to compute ne, fortwo reasons. First, the knee can occur before Vs is reached, as in Fig. 3. Second, accordingto Eq.(1), Ies depends exponentially on the assumed value of Vs, so that a small error in Vswould induce a large error in the inferred value of n. The only sure way to measure Vs is touse a hot, or emitting, probe5, for which Vf Vs.In magnetized plasmas, which frequently have low-frequency oscillations, fluctuations in Vf. can be measured with a floating probe. If KTe does not vary, the Vs spectrumshould be the same as the Vf spectrum. Methods have been devised to separate20-2dI / dV-4-6-8-10-12-140510V152025Fig. 5. Derivative of an I – V curve that has a distinct minimum at Vs.V!s from T!e by using baffled probes which block most of the electron current to a floatingprobe6. Using a floating hot probe would be better, but it would be difficult to neutralize thelarge capacitance of the heating circuit. Floating probes must be terminated in a high impedance, and the RC time constant of this resistor and the stray capacitance can limit the frequency response.F. Ion saturation currentWe have seen that measuring n with electron saturation current can be quite inaccurate and could draw dangerously large probe currents in a dense plasma. Saturation ion currents are much smaller and easier to handle because of the low output impedance that theyprovide. Unfortunately, interpretation of the Isat curve requires major computation, and the
7results can also be quite inaccurate. Only on a good day can one measure n to within 10%using Isat. Here we present the simplest approximation, appropriate for plane probes orprobes with large ξp, where ξp is the ratio between probe radius and Debye length:ξ p R p / λD ,λD2 ε 0 KTe / ne2 .(7)Cylindrical probe theory will be discussed in a separate section. Spherical probes are theeasiest to treat theoretically, but they are impractical to make.At densities above about 1011 cm-3, the sheath around a negatively biased probe is sothin that the area of the sheath edge is essentially the same as the area of the probe tip itself.The ion current is then just that necessary to satisfy the Bohm sheath criterion of Eq. (4),where the factor α represents ns/n, the density at the sheath edge relative to the density in themain plasma. The coefficient α, is only approximately 0.5; when probes are calibratedagainst other diagnostics, such as microwave interferometry, α 0.6-0.7 has been found tobe more accurate. The theoretical value is α exp( 1/2) 0.61. Note that Eq. (4)predicts aconstant Isat, which can happen only for flat probes in which the sheath area cannot expand asthe probe is made more and more negative. In practice, Isat usually has a slope to it. This isbecause the ion current has to come from a disturbed volume of plasma (the presheath) wherethe ion distribution changes from isotropic to unidirectional. If the probe is a disk of radiusR, say, the disturbed volume may have a size comparable to R, and would increase as the Vp increases. In that case, one can extrapolate Ii back to Vf to get a better measure of Isat beforethe expansion of the presheath. This is illustrated in Fig. 6. Saturation is quite good0.03BRL theoryξ p 20Linear fitTe 3 eV, n 4 x 10Bohm current12-3cmI (mA)VfVs0.00α 0.74-0.03-160-140-120-100-80 V-60-40-20020Fig. 6. Extrapolation of Isat to V Vf for a probe with ξp – 20. If the current there is equated to the Bohmcurrent, the Bohm coefficient would have to be 0.74.in this example, since Isat changes little over 80V in Vp. The curve, however, is based oncollisionless theory, and may not agree with experiment. As ξp is varied, the value of α thatone must use in applying the Bohm formula to a cylindrical probe would change as shown inFig. 7. Better saturation with a plane probe can be obtained by using a guard ring, a flatwasher-shaped disk surrounding the probe but not touching it. It is biased at the same potential as the probe to keep the fields planar as Vp is varied. The current to the guard ring is disregarded. A section of the chamber wall can be isolated to be used as a plane probe with alarge guard ring.
82.0E valuated at V f - 25K TeExtrapolated to Vfα1.51.00.50.001020ξ304050Fig. 7. The required values of α to use in the Bohm formula in order to fit Isat at Vf to the theoretical value for acylindrical probe.II. DESIGN OF PROBES AND CIRCUITS FOR RF ENVIRONMENTSA. Probe constructionSince the probe is immersed in a harsh environment, special techniques are used toprotect it from the plasma and vice versa, and to ensure that the circuitry gives the correct I –V values. The probe tip is made of a high-temperature material, usually a tungsten rod orwire 0.1 1 mm in diameter. The rod is threaded into a thin ceramic tube, usually alumina, toinsulate it from the plasma except for a short length of exposed tip, about 2 10 mm long.These materials can be exposed to low-temperature laboratory plasmas without melting orexcessive sputtering. To avoid disturbing the plasma, the ceramic tube should be as thin aspossible, preferably 1 mm in diameter but usually several times this. The probe tip shouldbe centered in the tube and extend out of its end without touching it, so that it would not be inelectrical contact with any conducting coating that may deposit onto the insulator. The assembly is encased in a vacuum jacket, which could be a stainless steel or glass tube 1/4″ inoutside diameter (od). It is preferable to make the vacuum seal at the outside end of theprobe assembly rather than at the end immersed in the plasma, which can cause a leak. Ideally, only the ceramic part of the housing should be allowed to enter the plasma. Somecommercial Langmuir probes use a rather thick metal tube to support the probe tip assembly,and this can modify the plasma characteristics unless the density is very low. In dense plasmas the probe cannot withstand the heat unless the plasma is pulsed or the probe is mechanically moved in and out of the plasma in less than a second. When collecting ion current, theprobe can be eroded by sputtering, thus changing its collection area. This can be minimizedby using carbon as the tip material. Ordinary pencil lead, 0.3mm in diameter works well andcan be supported by a hypodermic needle inside the ceramic shield. One implementation ofa probe tip assembly is shown in Fig. 8. An example of a right-angled
9Fig. 8. A carbon probe tip assembly with rf compensation circuitry [Ref. 7].probe with rf compensation circuitry is shown in Fig. 9. Commercial probes are availablefrom Hiden Analytical and Scientific Systems, among others. The probe tip assembly of theFig. 9. A right-angled probe with rf compensation for 27MHz [Ref. 7].Fig. 10. Probe tip assembly in the Hiden Analytical ESPion system.Hiden system is shown in Fig. 10. This has replaceable probe tips, well centered, and an extremely large auxiliary electrode (described later).
10A flat probe would seem to the simpler, since it would just draw the Bohm currentand the sheath area would not change with probe bias. However, the current has to comefrom somewhere. In order for the probe not to disturb the plasma, the surface from which thecurrent comes must be much larger than the probe surface. In that case, the probe acts like aspherical probe, and the current will not saturate. The disturbance is minimized if the flatprobe is part of a wall, but changing the probe bias would still affect the collection area. Theplanarity of the collecting surface can be improved by adding a guard ring, co-planar with theprobe and biased to the same Vp. The current to the guard ring is affected by edge effects,but it is not measured. Only the current to the central probe area with a planar sheath ismeasured. An example of a plane probe is shown in Fig. 10. Figure 11 shows such a probeand guard-ring system mounted as part of a wall.Ø 0.500Ø 0.276Ø 0.2500.1875Fig. 10 A flat probe with guard ring.Fig. 11. A flat probe with guard ring mounted on the grounded electrode of a capacitive discharge [Ref. 8].B. Probe circuitsThere are two basic ways to apply a voltage V to the probe and measure the current Ithat it draws from the plasma, and each has its disadvantages. In Fig. 12a, the probe lead,taken through a vacuum fitting, is connected to a battery or a variable voltage source (biassupply) and then to a termination resistor R to ground. To measure the probe current, the
11voltage across R is recorded or displayed on an oscilloscope. This arrangement has the advantage that the measuring resistor is grounded and therefore not subject to spurious pickup.Since the resistor is usually 10-1000Ω, typically 50Ω, this is not a serious problem anyway.The disadvantage is that the bias supply is floating. If this is a small battery, it cannot easilybe varied. If it is a large electronic supply, the capacitance to ground will be so large that acsignals will be short-circuited to ground, and the probe cannot be expected to have good frequency response. The bias supply can also act as an antenna to pick up spurious signals. Toavoid this, one can ground the bias supply and put the measuring resistor on the hot side, asshown in Fig. 12b. This is usually done if the bias supply generates a sweep voltage. However, the voltage across R now has to be measured with a differential amplifier or some otherfloating device; or, it can be optoelectronically transmitted to a grounded circuit. Commercial hardware can use a floating analog-to-digital converter to record the voltage across R.The probe voltage Vp should be measured on the ground side of R so as not to load the probewith another stray capacitance.RvPRO BEPROBEvR(a)(b)Fig. 12. Two basic configurations for the probe circuit.To measure plasma potential with a Langmuir probe, one can terminate the probe in ahigh impedance, such as the 1 MΩ input resistance of the oscilloscope. This is called afloating probe. A lower R, like 100K, can be used to suppress pickup. The minimum valueof R has to be high enough that the IR drop through it does change the measured voltage. Arough rule of thumb is that IsatR should be much greater than TeV, or R TeV/Isat, where Isat isthe ion saturation current defined above. The voltage measured is not the plasma potentialbut the floating potential. The large value of R means that good frequency response is difficult to achieve because of the RC time constant of stray capacitances. One can improve thefrequency response with capacitance neutralization techniques, but even then it is hard tomake a floating probe respond to rf frequencies. The rule of thumb quoted above comesfrom the circuit diagram of Fig. 13, where the load line of the terminating resistor is showntogether with the probe characteristic. The line on the left is for a small resistor used tomeasure current; its slope is nearly vertical, so that the marked intersection with the I – Vcurve gives the current near the set point Vp. Note that Ie I is plotted vertically, so that theload lines have negative slopes. The line at the right represents a large resistor used tomeasure floating potential. Its intersection with the I – V curve is near Vf. Since the I – Vcurve varies about Isat over a voltage range of about TeV , its effective impedance there isabout TeV /Isat. Very approximately, then, R should be much larger than this value to measureVf.
12-IVpVFig. 13. The operating points of a biased probe and a floating probe.C. RF compensationElectron currentLangmuir probes used in rf plasma sources are subject to rf pickup which can greatlydistort the I – V characteristic and give erroneous results. ECR sources which operate in themicrowave regime do not have this trouble because the frequency is so high that it is completely decoupled from the circuitry, and the measured currents are the same as in a DC discharge. However, in rf plasmas, the space potential can fluctuate is such a way that the circuitry responds incorrectly. The problem is that the I – V characteristic is nonlinear. The“V” is actually the potential difference Vp - Vs , where Vp is a DC potential applied to theprobe, and Vs is a potential that can fluctuate at the rf frequency and its harmonics. If onedisplaces the I – V curve horizontally back and forth around a center value V0, the averagecurrent I measured will not be I(V0), since I varies exponentially in the transition region andalso changes slope rapidly as it enters the ion and electron saturation regions. The effect ofthis is to make the I – V curve wider, leading to a falsely high value of Te and shifting thefloating potential Vf to a more negative value. This is illustrated in Figs. 14 and 15.-20-100Vp - Vs102030Fig. 14. The center curve is the correct I – V curve. The dashed ones are displaced by 5V, representingchanges in Vs. At the vertical lines, the average Ie between the displaced curves is shown by the dot. The linethrough the dots is the time-averaged I – V curve that would be observed, differing greatly from the correctcurve.
130.5Te 3 eVHelium0.4Electron CurrentVrf V)0510150.30.20.10.0-0.1-20-15-10-5eV/KTe0510Fig. 15. Computed I – V curves for sinusoidal Vs oscillations of various amplitudes.Without proper rf compensation, Langmuir probe data in rf discharges can give spurious data on Te, Vf, and f(v). However, if one needs to find only the plasma density, theprobe can be biased so that V never leaves the ion saturation region, which is linear enoughthat the average Isat will be the correct value.Several methods for reducing rf effects have been tried. One is to tap off a sinusoidalrf signal from the power supply and mix this with the probe signal with variable phase andamplitude. When the resultant I – V curve gives the lowest value of Te, one has probablysimulated the Vs oscillations. This method has the disadvantage that the Vs oscillations cancontain more than one harmonic. A second method is to measure the Vs oscillations with another probe or section of the wall which is floating, and add that signal to the probe currentsignal with variable phase and amplitude. The problem with this method is that the Vs fluctuations are generally not the same everywhere. A third method is to isolate the probe tipfrom the rest of the circuit with an rf choke (inductor), so that the probe tip is floating at rffrequencies but is fixed at the DC probe bias at low frequencies. The probe then follows theVs fluctuations, maintaining the same dc bias between Vp and Vs. The problem is that theprobe tip does not draw enough current to fill the stray capacitances that connect it to groundat rf frequencies. One way is to place a large slug of metal inside the insulator between theprobe tip and the chokes. This metal slug has a large area and therefore picks up enoughcharge from the Vs oscillations to drive the probe tip to follow them. However, we havefound7 that the best way is to use an external floating electrode, which could be a few turnsof wire around the probe insulator, and connect it through a capacitor to a point between theprobe tip and the chokes (Fig. 9). The charge colle
2 I. THE PROBE CHARACTERISTIC A. Parts of the I ΠV curve Let the plasma potential (space potential) be Vs, and the potential applied to the probe be Vp.If the chamber walls are metal and grounded, Vs is normally of the order of 5KTe. When Vp Vs, an electron current Ie is collected; the probe current is negative. When Vp Vs, an ion current Ii is collected.