Transcription
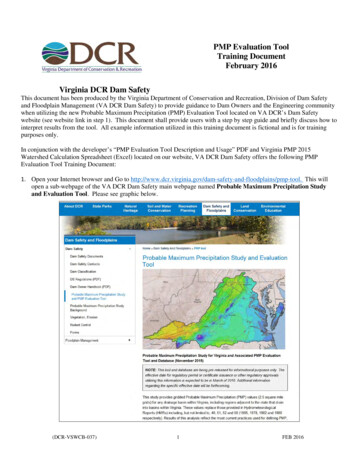
PMP Evaluation ToolTraining DocumentFebruary 2016Virginia DCR Dam SafetyThis document has been produced by the Virginia Department of Conservation and Recreation, Division of Dam Safetyand Floodplain Management (VA DCR Dam Safety) to provide guidance to Dam Owners and the Engineering communitywhen utilizing the new Probable Maximum Precipitation (PMP) Evaluation Tool located on VA DCR’s Dam Safetywebsite (see website link in step 1). This document shall provide users with a step by step guide and briefly discuss how tointerpret results from the tool. All example information utilized in this training document is fictional and is for trainingpurposes only.In conjunction with the developer’s “PMP Evaluation Tool Description and Usage” PDF and Virginia PMP 2015Watershed Calculation Spreadsheet (Excel) located on our website, VA DCR Dam Safety offers the following PMPEvaluation Tool Training Document:1. Open your Internet browser and Go to ains/pmp-tool. This willopen a sub-webpage of the VA DCR Dam Safety main webpage named Probable Maximum Precipitation Studyand Evaluation Tool. Please see graphic below.(DCR-VSWCB-037)1FEB 2016
2. Scroll half way down the webpage and look for PMP Evaluation GIS tool under the section named Deliverablesfrom the PMP study are available for download below.3. Click on the PMP Evaluation Tool (67 Mb) link. Please see graphic belowCLICK4. A file save pop-up box will open once the user has clicked on the link (see graphics below). Save the pmp-evaltool.zip file to your computer and move the zip file to the desktop or a location of your choosing. For the purposes ofthis training document, the zip file was saved to the desktop.5. Please note that the saving of this file could take up to 10 minutes (or longer) based on the user’s internet connection.6. Once the file has finished downloading, return to the Probable Maximum Precipitation Study and Evaluation Toolwebsite (see Step 1) and click on the PMP Evaluation Tool Description and Usage (PDF) link under PMPEvaluation GIS tool section of the webpage. Please see graphic below:(DCR-VSWCB-037)2FEB 2016
CLICK7. Save the Document to your computer for additional reference when using the PMP Tool.8. Once the PDF file has been saved to your computer, return to the Probable Maximum Precipitation Study andEvaluation Tool website (see Step 1) and click on the Virginia PMP 2015 Watershed Calculation Spreadsheet(Excel) link under PMP Evaluation GIS tool section of the webpage. Please see graphic below:CLICK9. Save the Excel Document to your computer for additional reference when calculating the appropriate 6-hour, 12-hourand 24-hour rainfall values for the watershed in question. For the purposes of this training document, the VirginiaPMP 2015 Watershed Calculation Spreadsheet (Excel) was saved to the desktop and will be referenced / utilizedlater in this document.10. Locate the pmp-eval-tool.zip on your desktop (or saved location of your choice). Right click on the zip file andchoose the extract all option. Extract file onto the desktop with the name PMP Evaluation Tool. See GraphicBelow.(DCR-VSWCB-037)3FEB 2016
CLICK11. A new folder should now be on your computer’s desktop (or location of your choice) called PMP Evaluation Tool.12. Double click on the PMP Evaluation Tool folder to expose three additional folders called Input, Output, andScript. See graphic below.13. The Input folder contains all of the meteorological / PMP data for the State of Virginia required for the PMPEvaluation Tool to function properly. For additional information on the State of Virginia meteorological / PMP datautilized in this tool, please reference the Applied Weather Associates’ November 2015 Probable MaximumPrecipitation Study for Virginia (Final Report (PDF) link) on the ins/pmp-tool sub-webpage under the PMP Final Report & Appendices section.14. The Output folder contains the geodatabases where the PMP output information will be housed once the tool has beenrun by the user.15. The Script folder contains a copy of the python script utilized to create the PMP Evaluation Tool and an ArcGIStoolbox containing the actual Basin PMP Evaluation Tool.16. Close / minimize the folder window which opened when you previously double-clicked on the folder calledPMP Evaluation Tool located on your desktop.17. Open your Esri ArcMap program (Esri ArcMap 10.0 or better)(DCR-VSWCB-037)4FEB 2016
18. Save the ArcGIS work map (work map) to your Desktop (or a location of your choosing) with a filename of yourchoosing. For the purposes of this training document, we will be working in ArcMap 10.1 Service Pack 1 with anArcGIS work map named training.19. Moving forward, it is recommended that the work map be saved often as the user works through this trainingdocument.20. The default coordinate system for the PMP Evaluation Tool is GCS WGS 1984. To check your current workmap’s coordinate system, navigate to the View pull down and select Data Frame Properties. Please see graphicbelow.CLICKCLICK21. Choose the Coordinate System tab and determine the coordinate system for your current work map. Once finished,click Ok which will close the Data Frame Properties window. See graphic below. For the purposes of this trainingdocument, the coordinate system for the training work map will be in GCS WGS 1984. If you decide to utilize adifferent coordinate system in your work map other than the PMP tool’s default system, coordinate systemtransformations may be required to ensure accurate location of the PMP tool’s output grids. You will receive awarning message from ArcMap if you attempt to add data from a coordinate system different than the one selected inthe Data Frame Properties. If you should need help with GIS coordinate system transformations, VA DCR Dam Safetysuggests referencing ArcGIS help through ArcMap or talking with your internal ArcGIS helpdesk support.CLICKMAP COORDINATE SYSTEM(DCR-VSWCB-037)5FEB 2016
22. Navigate to the add data symbol in your work map (yellow diamond symbol with a plus sign, see graphic below),browse to your drainage area, and add the drainage area for the Dam in question into your work map. Please note thedrainage area must be either a Shapefile or geo-database (GDB) feature class and must be CLOSED. The user mustsupply the drainage area in order for the PMP Evaluation Tool to work properly. For the purposes of this trainingdocument, a closed drainage area from a file geo-database (GDB) for a dam located in the piedmont region of Virginia(Transposition Zone 6 – see page 53 of the Applied Weather Associates’ November 2015 Probable MaximumPrecipitation Study for Virginia) will be utilized.CLICKDRAINAGE AREA23. Open ArcCatalog (symbol looks like a yellow filing cabinet, see graphic below) in your work map. Pin ArcCatalogto the right in your work map and turn off the auto hide option (looks like a thumbtack in top right of ArcCatalogwindow). See graphic below.CLICK(DCR-VSWCB-037)6FEB 2016
CLICK24. Utilizing ArcCatalog, click on the Connect to Folder symbol (see graphic below) to connect to yourPMP Evaluation Tool folder to your work map. Navigate to the PMP Evaluation Tool folder on your desktop (orother location where folder is saved) and click Ok to connect to said folder. The home folder in ArcCatalog shouldnow be linked to the PMP Evaluation Tool folder (see graphic below).CLICKHOME FOLDER25. Expand the PMP Evaluation Tool folder (if not already expanded) and locate the Script folder. Expand the Scriptfolder and then expand the PMP Tools.tbx ArcGIS toolbox. Double click on the Basin PMP Evaluation Tool scriptto open the PMP Evaluation Tool in your work map. See graphic below.DOUBLE CLICK(DCR-VSWCB-037)7FEB 2016
26. The PMP Evaluation Tool will open in your ArcGIS work map and require inputs by the user in six differentcategories. The script name of the actual toolbox is Basin PMP Evaluation Tool. On the bottom of the tool window,ensure the show help / hide help button has been clicked to show help on right side of tool. When the user clicks oneach category / section, a help box with a description of what information / data is required for said category / sectionwill be shown the right of tool (if available). The designated General, Local, and Tropical fields within the toolrepresent three distinct storm types utilized to develop the new PMP values within the State of Virginia. Each stormtype includes multiple storm duration options to aid the user in modeling the Dam in question. For more informationon the General, Local, and Tropical storm event types, please reference Applied Weather Associates’ November2015 Probable Maximum Precipitation Study for Virginia (Final Report (PDF) link) on dplains/pmp-tool sub-webpage under the PMP Final Report &Appendices section. See graphic below.TOOL SCRIPT NAMEBASIN TOOLHELP BUTTONHELP BOX AREA27. Input basin outline Shapefile or feature class Input Field – Click the drop down arrow on the right side of the inputfield and choose the drainage area feature class / shapefile previously added to the work map in previous steps (Step19). If the drainage area feature class / Shapefile has not already been added to the work map, click on the open foldersymbol to the right of input field to navigate to their required drainage area file. See graphic below.INPUT FIELD(DCR-VSWCB-037)CLICK8OPEN FOLDERFEB 2016
28. Location of PMP Evaluation Tool Folder Input Field – Click on the Open Folder symbol to the right of the inputfield. Browse to the PMP Evaluation Tool folder and hit ok. For the purposes of this training document, thePMP Evaluation Tool folder is located on the desktop. This field may default to the PMP Evaluation Tool folderwhen the tool is opened if said folder has been marked as the home folder in ArcCatalog for your work map. Seegraphic below.INPUT FIELDCLICK29. Output Folder Input Field – Click on the Open Folder symbol to the right of the input field and browse to a locationon your computer where you would like the tool’s output data to be located. Choose Ok. The default location for theoutput data is in the Output folder of the PMP Evaluation Tool folder. Please note that if the output location for thisinput field always remains the same when using the tool, the output data will automatically overwrite itself each timethe tool is utilized. For the purposes of this training document, the default Output folder will be utilized for the outputdata. See graphic below.INPUT FIELDCLICK30. General Storm Durations (optional) Input Field – Select (checkbox) a storm duration from the list of storm durationsin the General Storm input field. Per current DCR Dam Safety Regulations; it is required that at a minimum the 6hour, 12-hour, and 24-hour storm events be selected from the General Storm input field for the Dam in question. Allprovided storm durations may be selected for the General Storm input field if desired, but may impact toolcomputation times. For the purposes of this training document; the 6-hour, 12-hour, and 24-hour storm durations havebeen selected and will be analyzed. See graphic below.CLICKCLICKCLICK31. Local Storm Durations (optional) Input Field – Select (checkbox) a storm duration from the list of storm durations inthe Local Storm input field. Per current DCR Dam Safety Regulations; it is required that at a minimum the 6-hour,12-hour, and 24-hour storm events be selected from the Local Storm input field for the Dam in question. All providedstorm durations may be selected for the Local Storm input field if desired, but may impact tool computation times.For the purposes of this training document; the 6-hour, 12-hour, and 24-hour storm durations have been selected andwill be analyzed. See graphic below.(DCR-VSWCB-037)9FEB 2016
CLICK32. Tropical storm durations (optional) Input Field – Select (checkbox) a storm duration from the list of storm durationsin the Tropical Storm input field. Per current DCR Dam Safety Regulations; it is required that at a minimum the 6hour, 12-hour, and 24-hour storm events be selected from the Tropical Storm input field for the Dam in question. Allprovided storm durations may be selected for the Tropical Storm input field if desired, but may impact toolcomputation times. For the purposes of this training document; the 6-hour, 12-hour, and 24-hour storm durations havebeen selected and will be analyzed. See graphic below.CLICKCLICK33. Use Basin Area Check Box – Ensure the Use Basin Area option box located below the Tropical storm durations(optional) Input Field is selected. By selecting this box, the Basin PMP Evaluation tool will utilize the basin areafrom the drainage area chosen in the Input basin outline Shapefile or feature class Input Field (Step 24). If the UseBasin Area box is unchecked, the user then has the ability to input a PMP Area (sqmi): (optional) in the input fieldbelow the checkbox. This new PMP area number would override the basin area from the drainage area selected in theInput basin outline Shapefile or feature class Input Field (Step 24). For the purposes of this training document, theUse Basin Area checkbox will be selected. See graphic below.CLICK34. Review the tool’s inputs and change any Environments settings deemed necessary for your project. For the purposesof this training document, no adjustments to any of the Environments settings were made. Once reviewed, click theOK button to run the Basin PMP Evaluation tool. Depending on the size of the inputted drainage area, the(DCR-VSWCB-037)10FEB 2016
computation time for the Basin PMP Evaluation Tool will average from 5 minutes to multiple hours to complete. Seegraphic below.CLICK35. Ensure before moving forward the tool has completed. The tool should state completed once finished and the usershould have the ability to close out of the tool. See graphic below.COMPLETED36. Once the Basin PMP Evaluation Tool has completed, navigate to the Output folder in ArcCatalog under thePMP Evaluation Tool main folder. Expand the Output folder. The Output folder should have three sub-foldersunder it named General, Local, and Tropical. Upon further expanding each of the subfolders, each sub-foldershould have a geodatabase with tables and a Point file. See graphic below.(DCR-VSWCB-037)11FEB 2016
GENERALLOCALPOINT FILETROPICALNote: The file namingconvention utilized in theBasin PMP EvaluationTool’s Output files(geodatabase, table files,point files, etc.) will bebased on the storm eventsselected and storm eventtype (general, local, &tropical). The numberportion of the file name isbased on the size of yourInput Basin. For thepurposes of this trainingdocument, the input basinutilized was approximately2.27 mi2. As a result, thereis a 2 at the end of eachOutput file’s name torepresent the 2.27 mi2 basin.37. Select the General PMP Points 2 point file feature class under the Output General PMP 2.gdb inArcCatalog and move (drag and drop) the General PMP Points 2 point file feature class into the work map (thisaction will add the point file feature class to the work map). The user may also add the General PMP Points 2 pointfile feature to the work map utilizing the Add Data option as discussed in Step 21 of this training document. At thistime a point feature class named General PMP Points 2 should be in the work map. See graphic below.MOVE38. Return to the Output folder and complete the same process as dictated in Step 36 for the Local and Tropical point filefeature classes. Once completed, there should be three point feature classes in the work map. See graphic below.(DCR-VSWCB-037)12FEB 2016
GRID POINTPOINT FILESGRID POINT39. Select the General PMP Points 2 point file feature class in the work map’s table of contents section and right click.Navigate to Open Attribute Table and click to open the file’s table. See graphic below.CLICKCLICK40. The Attribute Table for the General PMP Points 2 point file feature class should now be open in the work map. Inthis particular example, four distinct grid points are located within the drainage area in question (see graphic in Step38). Each grid point represents a data point full of storm based data information (Input portion of PMP EvaluationTool) for multiple storm durations which is utilized by the Basin PMP Evaluation Tool to analyze the watershed inquestion. An explanation of each of the Attribute Table’s columns as well as a graphic can be found below.a. Object ID – This column represents each point located within the points feature classb. Shape – This column defines the type of shape for the grid point in question(DCR-VSWCB-037)13FEB 2016
c. Id – default columnd. Point X – X coordinate for grid point in questione. Point Y – Y coordinate for grid point in questionf.Zone – Transposition Zone for grid point in questiong. PMP 06 – Controlling 6 Hr PMP value for grid point in questionh. PMP 12 – Controlling 12 Hr PMP value for grid point in questioni.PMP 24 – Controlling 24 Hr PMP value for grid point in questionj.Storm 06 - Controlling storm event for the 6 Hr PMP event for grid point in questionk. Storm 12 - Controlling storm event for the 12 Hr PMP event for grid point in questionl.Storm 24 - Controlling storm event for the 24 Hr PMP event for grid point in question41. We will now export the data out of the Attribute Table into Excel file format for use with the previously savedVirginia PMP 2015 Watershed Calculation Spreadsheet (Excel) (see Step 8). In the open Attribute Table, Clickon the Attribute Table Icon (pull down icon on left of table directly below the Table label) and navigate to the Exportoption (second from the bottom of the pull down menu). Click on the Export option. See graphic below.(DCR-VSWCB-037)14FEB 2016
CLICKCLICK42. Once selected, an Export Data pop-up box will open allowing the user to save the exported data from the AttributeTable to a chosen location. Click on the open folder icon in the Export Data pop-up box. An additional pop-up boxshould open named Saving Data which will allow the user to navigate to a location to save said data. The data can besaved in multiple file formats in the Save as type field. Click the pull down arrow on the field and choose Text Fileas the file type. See graphic below.CLICK 2NAVIGATECLICK 1CLICK 343. After selecting the Text File as the file type for the exported data, rename the export file to a name of your choicewith an extension of .csv (excel file format). Note that the dot at the beginning of the .csv is very important. For thepurposes of this training document, we will be naming the file Train General Pts.csv and saving the file within thePMP Evaluation Tool folder on the desktop. See graphic below.(DCR-VSWCB-037)15FEB 2016
FILE NAME WITH .CSV44. Once you navigated to the save location of your choice and have renamed your file with the .csv file extension, clicksave. Ensure the file address in the Export Data pop-up box is correct with the .csv extension. Once checked, clickOk. An ArcMap caution box will open after selecting Ok asking the user if they want to add the new table to thecurrent work map. Click No. Navigate to the saved location for the exported data and open the excel file. The excelfile should look like the graphic below.45. Now we will repeat the same excel table export processes for the Local and Tropical file point feature classes addedinto the work map in Step 38. Repeat Steps 39 through 44 for the Local file point feature class and for the Tropicalfile point feature class. For the purposes of this training document, the Local export table will be renamed toTrain Local Pts.csv and the Tropical export table will be renamed to Train Tropical Pts.csv with both files beingsaved under the PMP Evaluation Tool folder located on the desktop. At this time you should have exported data inexcel file format for the General, Local, and Tropical storm event types (three files).46. Now we will analyze the exported work map Attribute Table data (General, Local, & Tropical) utilizing Excel todetermine the controlling 6-hour, 12-hour, and 24-hour rainfall values for the durations chosen for the drainage area inquestion. Locate and Open the previously saved Virginia PMP 2015 Watershed Calculation Spreadsheet (Excel)as discussed in Step 8. The excel file should look like the graphic below.(DCR-VSWCB-037)16FEB 2016
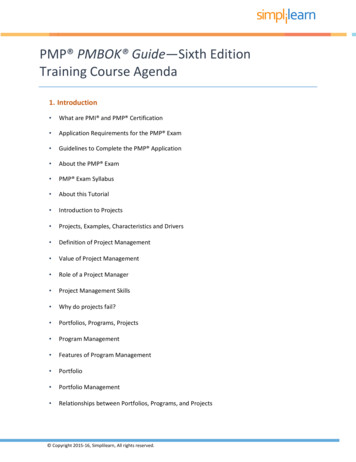
DRAINAGE AREA UTILIZEDGENERAL STORM EVENTLOCAL STORM EVENTTROPICAL STORM EVENTCONTROLLING PMP VALUES47. Utilizing the three excel files from Step 45, copy and paste the appropriate data into the appropriate locations in theVirginia PMP 2015 Watershed Calculation Spreadsheet (Excel) (VA PMP Worksheet). As stated in the VA PMPworksheet, the cells shaded with light blue define areas where the user must populate the fields. The VA PMPWorksheet is provided with default data already in the required user defined cells by default. The user will need toadjust said values and the number of rows / columns to adhere to the number of points in the drainage area in question(rows) and the number of storm durations chosen from the Basin PMP Evaluation Tool (columns). For the purposeof this training document, the drainage area in question utilized four data points (four rows under each storm eventtype) and three storm durations (6-hour, 12-hour, and 24-hour rainfall / controlling storm data (six columns under eachstorm event type). In addition for the purposes of this training document, the default information presented in VAPMP Worksheet matches the information from the three excel files generated in Step 45. See graphic below.3 STORM DUR 6 COLUMNS4 DATA PTS 4 ROWS(DCR-VSWCB-037)17FEB 2016
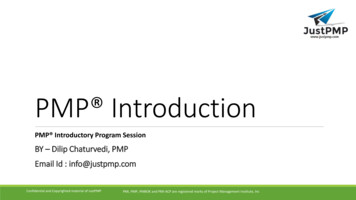
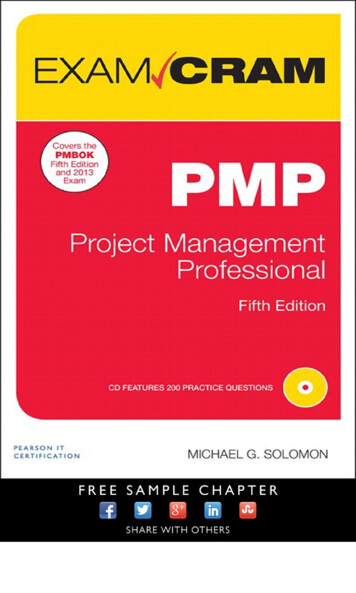
48. Utilizing the VA PMP Worksheet we will determine the controlling 6-hour, 12-hour, and 24-hour rainfall values forthe watershed in question. After adding the appropriate data into the appropriate locations as discussed in Step 47, theVA PMP Worksheet has been set up to aide in the calculation of the controlling rainfall values. The VA PMPWorksheet follows the following calculation procedures:a. Average PMP Values – Utilizing the General Storm Events section of the completed VA PMP Worksheet as anexample, we have four data points in the analyzed drainage area resulting in four rows of storm data (largerdrainage area would result in more data points which would ultimately result in more rows). Each data pointprovides a storm rainfall for the durations chosen as well as the controlling storm event from which the data wasextracted. In order to determine the overall average PMP rainfall value across the drainage area for each stormduration for the General Storm Type, an average rainfall for each storm duration is obtained. For examplelooking at the 6 Hr. PMP column in the General Storm Type section, there are four rainfall values with theaverage of those four rainfall values being 15.9 inches. The same average calculation is completed for the 12 Hr.(average 18.3 inches) and 24 Hr. (average 20.0 inches) PMP Values within the General Storm Events section. Thesame process is then completed for the Local Storm Events and Tropical Storm Events sections. See graphicbelow.AVG. CALC. FROMTHESE 4 VALUESAVG. PMP VALUESAVG. PMP VALUESAVG. PMP VALUESb. Controlling Storm Events – As shown in the graphic above, the defined controlling storm event is provided by theBasin PMP Evaluation Tool for each data point (row) in each storm event type (General, Local, and Tropical).Additional information for these storms (name, storm type, location, rainfall specifics, etc.) can be found in theAppendices of the Applied Weather Associates’ November 2015 Probable Maximum Precipitation Study forVirginia (Final Report (PDF) link) on the ains/pmp-tool subwebpage under the PMP Final Report & Appendices section.c. Controlling PMP Values from Storm Events – After determining the average rainfall values per duration for eachof the three storm types (General, Local, and Tropical), the user should have three 6-hour rainfall values (one forGeneral, one for Local, and one for Tropical). Analyzing these three values for the 6-hour rainfall, the controlling6-hour rainfall PMP value would be the maximum of these three values. Utilizing information from trainingdocument’s example, the three 6-hour average rainfall values calculated in the VA PMP Worksheet are 15.9 inches(General), 27.6 inches (Local), and 19.3 inches (Tropical). After evaluating these three values, the maximum 6hour average rainfall value is 27.6 inches which in turn becomes your controlling 6-hour rainfall value. This sameprocess is applied to the three 12-hour and 24-hour values (General, Local, and Tropical). The controlling 12-hourrainfall value should be 31.4 inches and the controlling 24-hour rainfall value should be 31.4 inches. See graphicbelow.(DCR-VSWCB-037)18FEB 2016
AVG. PMP VALUESAVG. PMP VALUESAVG. PMP VALUESCONTROLLING PMP VALUES (MAXIMUM)d. Why are the rainfall values for 12-Hr. PMP & 24-Hr. PMP the same? - The Virginia Applied Weather Associates’November 2015 Probable Maximum Precipitation Study for Virginia (Final Report (PDF) link) was developedutilizing real world data from actual storm events. For this particular case where the 12-hour and 24-hour rainfallvalues are the same, the controlling PMP storm (producing the largest PMP values which in this case is theSPAS 1534 1 storm (see Local Storm Type Section above)) is no longer accumulating rainfall beyond the giventimeframe and no other analyzed storm events produced a greater depth of rainfall. Looking at our example above,the 12-hour event provided a maximum rainfall value of 31.4 inches (Local storm type section) within a 12-hourperiod. When the program evaluated the 24-hour event utilizing Local storm type within the limits of the analyzeddrainage area, there were no other storm events which produced more than 31.4 inches of rainfall over a 24-hourperiod. In some cases another storm may eventually produce more rainfall as the duration continues to increase,but not within the chosen durations in the example above (24-hour storm was the longest chosen storm duration).There are two options moving forward when a user has a situation where two of the controlling PMP values are thesame:i. Use the data as it is provided. This is the most accurate option based on how the data was developed by AppliedWeather Associates.ii. Add a very minor incremental accumulation if the model requires it. For example, add 0.01 inches persubsequent duration. If you have 30 inches at 12 hours, it would be 30.01 inches at 24 hours, 30.02 inches at 48hours, and 30.03 inches at 72 hours, etc. As stated earlier this should only be used when the hydrologic modelrequires it.e. Values to utilize in the hydrologic modeling moving forward – Moving forward, the user would use the followingvalues from our example to in their hydrologic modeling for the dam failure analysis in question:i. Controlling 6-Hr. PMP Rainfall Value – 27.6 inchesii. Controlling 12-Hr. PMP Rainfall Value – 31.4 inchesiii. Controlling 24-Hr. PMP Rainfall Value – 31.4 inches.49. This concludes our training document. If you have any questions or concerns, please contact:(DCR-VSWCB-037)19FEB 2016
Regional Dam Safety nd-floodplains/dsfpmcontx)Division of Dam Safety & Floodplain ManagementVirginia Department of Conservation & Recreation600 East Main StreetRichmond, VA 23219The Division of Dam Safety and Floodplain Management (VA Dam Safety) has provided this training document as areference tool when utilizing the Virginia Basin PMP Evaluation Tool and should be treated as such. It is theresponsibility of the Professional Engineer to understand and utilize the VA Basin PMP Evaluation Tool correctly whencompleting required calculations. VA Dam Safety takes no legal responsibility or liability for any of the informationprovided above or additional guidance documents / spreadsheets provided (see Disclaimer at ains/pmp-tool).(DCR-VSWCB-037)20FEB 2016
(DCR-VSWCB-037) 3 FEB 2016 7. Save the Document to your computer for additional reference when using the PMP Tool. 8. Once the PDF file has been saved to your computer, return to the Probable Maximum Precipitation Study and Evaluation Tool website (see Step 1) and click on the Virginia PMP 2015 Watershed Calculation Spreadsheet