Transcription
INTRODUCTION TO META-ANALYSIS 3dealing with heterogeneityAnna ChaimaniResearch Center of Epidemiology & Statistics, Sorbonne Paris Cité(CRESS-UMR1153), Paris Descartes University, FranceMark SimmondsCentre for Reviews and Dissemination, University of York, UK25th Cochrane Colloquium, Edinburgh, UK18 September 2018Acknowledgements: Julian Higgins, Georgia Salanti
We have no actual or potential conflict of interest inrelation to this presentation
General principles of meta-analysis Participants of one study are not compared directly with theparticipants in another study each study is analyzed separately in each study we estimate the intervention effect preserving therandomization (e.g. RR, OR) In each study we assign a weight depending on the information itprovides in a way that large studies have greater influence in the summary effect The study-specific intervention effects are synthesized to obtainthe summary effect of the meta-analysis
Why performing a meta-analysis? To increase the power of the analysis and get more precise results obtaining narrower confidence intervals detecting statistically significant effects
Why performing a meta-analysis? To increase the power of the analysis and get more precise results obtaining narrower confidence intervals detecting statistically significant effects To investigate the intervention effect under different conditions exploration of heterogeneity
What is heterogeneity? The differences observed between the studies of a systematicreview. Types of heterogeneity – diversity:1. Clinical2. Methodological3. Statistical
Clinical heterogeneity Participants Age Severity of condition Geographical variation Interventions Intensity / dose / durationSub-type of drugMode of administration,Nature of the control (placebo/none/standard care)
Methodological heterogeneity Design Randomised vs non-randomised Cross-over vs parallel group vs cluster randomised Follow-up duration Conduct Allocation concealment Blinding Analysis method Outcomes Definition of an event Choice of measurement scale
Statistical heterogeneity Effect estimates will vary across studies Some variation is chance variation: Studies are small All results come with uncertainty Effect estimates will vary by chance Some variation is genuine differences in the effect across studies Clinical / methodological heterogeneity Statistical heterogeneity is the observed variation in effectestimates that cannot be explained by chance alone
Outcome data required from each study Extract from each study an effect size and its uncertainty (standarderror) Usually we present the effect sizes from all studies in a forest plot
How to synthesize these studies? By obtaining an average effect Differences in level of uncertainty across the studies are ignored By pooling the different intervention arms across all studies this approach breaks the randomization of the studies – comparisonbetween treatment and control valid within studies but potentially invalidacross studies By obtaining a weighted average Randomization is preserved and larger (more precise) studies have largerweight in the analysis
Meta-analysis modelsFixed effect modelMeta-analysisRandom effects model
What are these models?
The fixed effect assumption
The random effects assumption
The fixed effect assumptionObserved instudiesTrueEffect estimate scale
The random effects assumptionObserved instudiesTrue in studiesTrueEffect estimate scale
How to assign weights to the studies? Inverse variance method any type of data, both fixed and random effects in fact this is the maximum likelihood estimator! Mantel-Haenszel method only binary data, only fixed effect (but there are ways to account for theheterogeneity) Peto method only binary data, only odds ratio, only fixed effect
Fixed effect model Inverse variance method Weight is 1 variance𝑤𝑖 1𝑣𝑎𝑟 𝑦ො 𝑖𝜃 𝐹𝐸 for each study 𝑖σ 𝑤𝑖 𝑦ො𝑖σ 𝑤𝑖𝑣𝑎𝑟 𝜃 𝐹𝐸 1σ 𝑤𝑖
Random effects model Inverse variance method Uncertainty in each trial is now BOTH the random variation ANDthe heterogeneity Weight is 1 (variance heterogeneity)𝑤𝑖 1𝑣𝑎𝑟 𝑦ො 𝑖 𝜏2𝜃 𝐹𝐸for each study 𝑖σ 𝑤𝑖 𝑦ො𝑖 σ 𝑤𝑖 The weights are smaller than before𝑣𝑎𝑟 𝜃 𝐹𝐸 1σ 𝑤𝑖
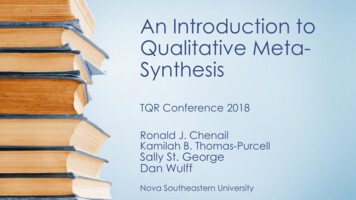
Example: Organized inpatient rehabilitationORln (OR)varweight FE𝒚𝒊𝒗𝒊𝒘𝒊𝒘𝒊𝒚𝒊𝒘 𝒊𝒘 𝒊 𝒚𝒊-0.020.1010.0-0.27.6-0.2StudyCameron 1993 0.98weight REFordham 19861.360.310.263.81.23.41.1Galvard 19951.280.250.0616.64.210.92.7Gilchrist 19880.75-0.290.147.1-2.15.8-1.7Kennie tal Random effects meta-analysis pooled odds ratio exp{– 0.045} 0.96 95% confidence interval from 0.68 to 1.35 Fixed effect analysis pooled odds ratio exp{– 0.02} 0.98 95% confidence interval from 0.72 to 1.32Random effectsmodel gives widerconfidence intervals!
Example: BehaviourDeteriorated/Disturbed/Unco-operativeRE givesmoreconservativeresults
Fixed effect meta-analysiscommon(fixed) effectTrial1random error23456789101112-101Effect estimateTreatment betterControl better
Random effects meta-analysisstudy-specific effectTrial1random error23456789101112distribution of effects-1𝜃 𝜏01Effect estimateTreatment betterControl better
Random effects meta-analysis Heterogeneity suggests that the studies have importantunderlying differences. We can allow the true effects underlying the studies to differ. We assume the true effects underlying the studies follow adistribution. conventionally a normal distribution We use a simple adaptation of the inverse-variance weightedaverage.DerSimonian and Laird (1986)
Identifying heterogeneity1. Visual inspection of the forest plots2. Q test for the presence of heterogeneity3. I2 statistic that quantifies heterogeneity as a proportion
Visual inspection of the forest plot A graphical inspection of the results is usually the first step A lack of overlap in confidence intervals indicates heterogeneity0.010.1Favours treatment1Risk ratio10100Favours placebo0.010.1Favours treatment1Risk ratio10100Favours control
Q-test chi-squared (𝜒 2 ) test𝑄 𝑤𝑖 𝑦ො𝑖 𝜃 2 has 𝜒 2 distribution with k – 1 d.f. under null hypothesis of anidentical effect in every study k is the number of studies in the meta-analysis rejection of 𝐻0 suggests heterogeneity
Q-test drawbacks Has low power since there are usually very few studies i.e. test is not very good at detecting heterogeneity as statisticallysignificant when it exists But, has excessive power to detect clinically unimportantheterogeneity when there are many studies
I-square statisticHiggins and Thompson (2002) Q-test is not asking a useful question if heterogeneity isinevitable Quantify heterogeneity based on the 𝜒 2 statistic Q and its degrees of freedom𝐼2 𝐼2 ��𝑒𝑡𝑒𝑟𝑜𝑔𝑒𝑛𝑒𝑖𝑡𝑦 𝐴𝑣𝑒𝑟𝑎𝑔𝑒 𝑠𝑡𝑢𝑑𝑦 𝑣𝑎𝑟𝑖𝑎𝑛𝑐𝑒𝑄 𝑘 1 𝑄100%describes the proportion of total variability that is dueto heterogeneity
Estimation of tau-square Estimate the heterogeneity variance 𝜏 2 from the Q-test (method ofmoments/DL estimator) :𝜏2𝑄 𝑘 1 σ 𝑤𝑖2σ 𝑤𝑖 σ 𝑤𝑖 We set 𝜏 2 0 if 𝑄 (𝑘 – 1) Many other ways to estimate the heterogeneity variance exist (e.g.restricted maximum likelihood) under certain conditions perform better than the DL estimator
Example: Bleeding
What can we do with heterogeneity? Check the data Incorrect data extraction;unit of analysis errors (e.g. withcrossover trials, cluster randomizedtrials, counts) Try to bypass it Change effect measure Encompass it Random effects meta-analysis Explore it Subgroup analysisMeta-regression Resign to it Do no meta-analysis Ignore it Don’t do that!
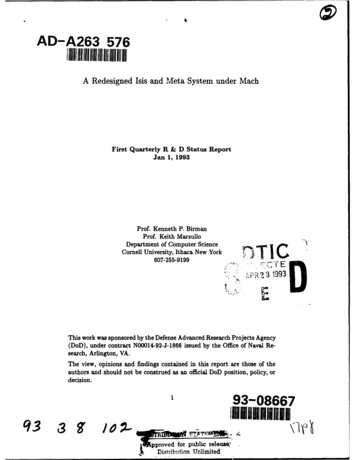
Heterogeneity of effect measuresEmpirical evidence0.1 0.5 0.01 0.001 00.51increasingdecreasingHeterogeneity of RR (p-value of Q-statistic)heterogeneity Ratio measures (RR and OR) considerably less heterogeneous thandifference measures (RD)10.50.1 0.50.01 0.0010increasingdecreasingHeterogeneity of RD (p-value of Q-statistic)heterogeneityDeeks et al. 2002
What can we do with heterogeneity? Check the data Incorrect data extraction;unit of analysis errors (e.g. withcrossover trials, cluster randomizedtrials, counts) Try to bypass it Change effect measure Encompass it Random effects meta-analysis Explore it Subgroup analysisMeta-regression Resign to it Do no meta-analysis Ignore it Don’t do that!
What not to do! Fixed or random effects meta-analysis should be specified apriori if possible and not on the basis of the Q testWhat to do:Think about the question you asked, the included studies etc: doyou expect them to be very diverse?You can apply and present both fixed and random effects
Fixed vs. random effects Fixed effect model is often unrealistic Random effects model difficult to interpret Fixed and random effects inverse-variance meta-analyses may be identical (when 𝜏 2 0) give similar point estimate, different confidence intervals(the 95% CI from FE should fall within the 95% CI from the RE)Random effects analysis may give spurious results when effect sizedepends on precisiongives relatively more weight to smaller studiesimportant becausesmaller studies may be of lower quality (hence biased)publication bias may result in missing smaller studies
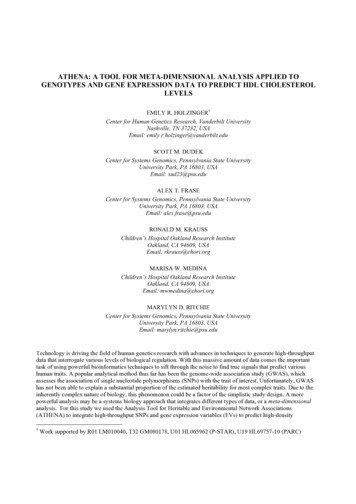
Example: Opioids for breathlessnessWoodcock 1981Woodcock 1982JohnsonEiser (A)Eiser (B)BrueraLightChuaPooleDavisLeungNosedaFixed effectRandom effects–0.32 ( –0.43 , –0.20 )–0.31 ( –0.50 , –0.13 )-2-101Standardised mean differenceOpioid betterPlacebo better2
Fixed vs. random effects Fixed effect model is often unrealistic Random effects model difficult to interpret Fixed and random effects inverse-variance meta-analyses may be identical (when 𝜏 2 0) give similar point estimate, different confidence intervals(the 95% CI from FE should fall within the 95% CI from the RE) Random effects analysis may give spurious results when effect sizedepends on precision gives relatively more weight to smaller studies important becauseo smaller studies may be of lower quality (hence biased)o publication bias may result in missing smaller studies
Interpreting random effects meta-analysis Random-effects meta-analysis suitable for unexplainedheterogeneity Random effects may not explain all the heterogeneity of the data ifcovariates are responsible Conventionally, inference is focused on the mean of the distribution (𝜃) i.e. we report mean and 95% from a meta-analysis This may be misleading.
Example0.010.1Treatment better1Risk ratio10Treatment worseFixed effect meta-analysis:1.64 ( 1.04 , 2.58 ) P 0.031000.010.1Treatment better1Risk ratio10Treatment worseRandom effects meta-analysis:1.64 ( 1.04 , 2.58 ) P 0.03100
Interpreting random effects meta-analysis Random-effects meta-analysis suitable for unexplainedheterogeneity Random effects may not explain all the heterogeneity of thedata if covariates are responsible Conventionally, inference is focused on the mean of the distribution (𝜃) i.e. we report mean and 95% from a meta-analysis This may be misleading. Look also at the prediction interval𝜃 1.96 𝑠𝑒 𝜃 2 𝜏 2𝜃 𝑡0.025,𝑛 1 𝑠𝑒 𝜃 2 𝜏 2
ExampleThe interval within which we expect thatthe effect of a future study will lie
Interpreting the diamond Conventional Interpretations1.2.3.Statistical significance and directionMagnitude of the pooled estimateWidth of the confidence interval Heterogeneity Too much heterogeneity challenges the meaning of the diamond Quality of the included studies
What can we do with heterogeneity? Check the data Incorrect data extraction;unit of analysis errors (e.g. withcrossover trials, cluster randomizedtrials, counts) Try to bypass it Change effect measure Encompass it Random effects meta-analysis Explore it Subgroup analysisMeta-regression Resign to it Do no meta-analysis Ignore it Don’t do that!
Exploring heterogeneity Characteristics of studies may be associated with the size oftreatment effect For example, adequacy of allocation concealmentaverage age of patientssetting of studydose of drug For discrete characteristics, we can use subgroup analyses For discrete or continuous characteristics, we can usemeta-regression
Subgroup analysis (example: bleeding)
Test for differences between subgroups 𝐻0 : No differences across the K subgroups 𝐻1 : There are differences across the K subgroups2𝑄 𝑄𝑡𝑜𝑡 𝑄1 𝑄2 𝑄𝐾 𝜒𝐾 1
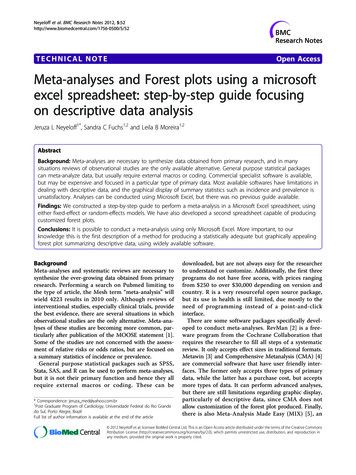
Meta-regressionDoes effectiveness of toothpaste depend on baseline populationlevels of caries?Marinho et al (2003)Prevented fraction of new caries100%50%0%–50%05101520Baseline caries (DMFS)2530
Selecting variables for subgroup analysisand meta-regression Specify characteristics in advance Select a small number of characteristics Ensure there is scientific rationale for investigating thecharacteristics beware ‘prognostic factors’ Make sure the effect of a characteristic can be identified does it differentiate studies? Think about whether the characteristic is closely related toanother characteristic
Probability of false positive 01520253035Number of subgroups404550
Problems using published results Limited to what is reported Subgroups are rarely reported in all trials Limited to “trial-level” characteristics Things that vary between studies; constant within studies Drug dose Treatment duration Hard to analyze “participant-level” characteristics Varying between patients in a trial Age Disease severity Rarely reported Using averages (average age, proportion of men) is biased
Using Individual Participant Data Obtain all the “raw” data for all participants of all trials Gives full data on all characteristics of interest for everyparticipant Age Sex Drug / dose received Exact nature of condition Permits analysis of all characteristics of interest Usually analyzed using regression modelling Linear / logistic regression NOT subgroup analysis or meta-regression
Small-study effects and random effectsMagnesium foracute myocardialinfractionOutcome:MortalityRE gives less‘contrasted’weightsbetween bigand smallstudies
Small-study effects as a source ofheterogeneity When the results of your review are related to the size of thestudy For example smaller studies may give larger treatment effects
Selective outcome reporting as source ofheterogeneityBown et al. (2002)Suggests presence of bias004281 / SE41 / SE1216620824Suggests absence of bias0.050.10.20.5125Odds (log scale)Overall mortality followingemergency aneurysm repair(n 171)10200.010.050.20.5125Odds (log scale)Mortality in operating theatrefollowing emergencyaneurysm repair (n 77)20
Baseline risk as source of heterogeneity0standard error(OR)123The drug does not work forpatients in industrializedcountries – big trials in Europe4The drug doeswork for patients indeveloping countries –small trials from Africa-4-20log(OR)24
What can we do with heterogeneity? Check the data Incorrect data extraction;unit of analysis errors (e.g. withcrossover trials, cluster randomizedtrials, counts) Try to bypass it Change effect measure Encompass it Random effects meta-analysis Explore it Subgroup analysisMeta-regression Resign to it Do no meta-analysis Ignore it Don’t do that!
Methods available in RevMan Estimate of overall effect with CI (fixed effect model)Estimate of mean effect with CI (random effects model)Test for heterogeneity, with P valueI2 measure of heterogeneityτ2 heterogeneity varianceTest for subgroup differences
Methods not available in RevMan Meta-regression Random-effects methods that account for the fact that tau-squareis estimated Prediction intervals Individual participant data methods
ReferencesDerSimonian R, Laird N. Meta-analysis in clinical trials. Controlled Clin Trials 1986; 7:177-188Higgins JPT, Thompson SG. Quantifying heterogeneity in a meta-analysis. Stat Med2002; 21: 1539-1558Higgins JPT, Thompson SG. Controlling the risk of spurious results from metaregression. Stat Med 2004 ; 23(11),1663-1682.Higgins, JPT., Thompson, SG, Spiegelhalter,DJ (2009). A re-evaluation of random effectmeta-analysis. JRSC series A 2009; 172(1),137-159.Riley RD, Higgins JPT, Deeks JJ. Interpretation of random effects meta-analyses. BMJ2011Thompson SG. Why sources of heterogeneity in meta-analysis should be investigated.Br Med J 1994; 309: 1351-1355Thompson SG, Higgins JPT. How should meta-regression analyses be undertaken andinterpreted? Stat Med 2002; 21: 1559-1574
Nature of the control (placebo/none/standard care) Methodological heterogeneity Design Randomised vs non-randomised Cross-over vs parallel group vs cluster randomised Follow-up duration Conduct Allocation concealment Blinding Analysis method Outcomes