Transcription
(2021) 9:101Shakya et al. acta neuropathol en AccessRESEARCHAltered lipid metabolism marks glioblastomastem and non‑stem cells in separate tumornichesSajina Shakya1, Anthony D. Gromovsky2, James S. Hale2,3, Arnon M. Knudsen4,5, Briana Prager6,7,Lisa C. Wallace1, Luiz O. F. Penalva8, H. Alex Brown9, Bjarne W. Kristensen4,5, Jeremy N. Rich10, Justin D. Lathia2,3,6,J. Mark Brown2,3,6 and Christopher G. Hubert1,3,6*AbstractGlioblastoma (GBM) displays marked cellular and metabolic heterogeneity that varies among cellular microenvironments within a tumor. Metabolic targeting has long been advocated as a therapy against many tumors includingGBM, but how lipid metabolism is altered to suit different microenvironmental conditions and whether cancer stemcells (CSCs) have altered lipid metabolism are outstanding questions in the field. We interrogated gene expression inseparate microenvironments of GBM organoid models that mimic the transition between nutrient-rich and nutrientpoor pseudopalisading/perinecrotic tumor zones using spatial-capture RNA-sequencing. We revealed a strikingdifference in lipid processing gene expression and total lipid content between diverse cell populations from the samepatient, with lipid enrichment in hypoxic organoid cores and also in perinecrotic and pseudopalisading regions of primary patient tumors. This was accompanied by regionally restricted upregulation of hypoxia-inducible lipid dropletassociated (HILPDA) gene expression in organoid cores and pseudopalisading regions of clinical GBM specimens,but not lower-grade brain tumors. CSCs have low lipid droplet accumulation compared to non-CSCs in organoidmodels and xenograft tumors, and prospectively sorted lipid-low GBM cells are functionally enriched for stem cellactivity. Targeted lipidomic analysis of multiple patient-derived models revealed a significant shift in lipid metabolismbetween GBM CSCs and non-CSCs, suggesting that lipid levels may not be simply a product of the microenvironmentbut also may be a reflection of cellular state. CSCs had decreased levels of major classes of neutral lipids comparedto non-CSCs, but had significantly increased polyunsaturated fatty acid production due to high fatty acid desaturase(FADS1/2) expression which was essential to maintain CSC viability and self-renewal. Our data demonstrate spatiallyand hierarchically distinct lipid metabolism phenotypes occur clinically in the majority of patients, can be recapitulated in laboratory models, and may represent therapeutic targets for GBM.Keywords: Glioblastoma, Organoid, Tumor heterogeneity, Lipid droplets, Cancer stem cell*Correspondence: hubertc@ccf.org1Department of Biomedical Engineering, Cleveland Clinic LernerResearch Institute, 9500 Euclid Avenue, Cleveland, OH ND2‑4044195, USAFull list of author information is available at the end of the articleIntroductionGlioblastoma (GBM) is the most common primary malignant brain tumor in adults. Despite aggressive standardtreatment strategies including surgical resection followedby radiation and chemotherapy, the median survival forpatients with GBM is approximately 15 months from thetime of diagnosis [1]. A key challenge to GBM treatmentis the intratumoral heterogeneity at both the cellular and The Author(s) 2021. Open Access This article is licensed under a Creative Commons Attribution 4.0 International License, whichpermits use, sharing, adaptation, distribution and reproduction in any medium or format, as long as you give appropriate credit to theoriginal author(s) and the source, provide a link to the Creative Commons licence, and indicate if changes were made. The images orother third party material in this article are included in the article’s Creative Commons licence, unless indicated otherwise in a credit lineto the material. If material is not included in the article’s Creative Commons licence and your intended use is not permitted by statutoryregulation or exceeds the permitted use, you will need to obtain permission directly from the copyright holder. To view a copy of thislicence, visit http:// creat iveco mmons. org/ licen ses/ by/4. 0/. The Creative Commons Public Domain Dedication waiver (http:// creat iveco mmons. org/ publi cdoma in/ zero/1. 0/) applies to the data made available in this article, unless otherwise stated in a credit line to the data.
Shakya et al. acta neuropathol commun(2021) 9:101microenvironmental levels [2, 3]. Maintenance of heterogeneity may be driven by a population of cells withinthe tumor termed cancer stem cells (CSCs), which arehighly plastic and responsive to their environment andhold self-renewal and tumor initiation capacity [4, 5]. Atthe single cell level, GBM is highly heterogeneous with aspectrum of stem cell and metabolic phenotypes [6, 7],and contains both fast-cycling and slow-cycling cells thathave distinct metabolisms and cancerous phenotypes [8].Critically for treatment, this diversity within the cell population means that while cells from one microenvironment or cellular state may respond to a therapy, othersmay not, resulting in therapeutic resistance of the overalltumor.Lipid metabolism is abnormally regulated in gliomascompared to normal cells, with changes in the expression of lipid-related genes such as SREBP1 and FAS,which results in altered lipid composition and lipogenesisto keep up with energy demands [9–11]. GBM tumorsalso accumulate more fatty acids than surrounding normal brain tissue [9]. These lipid stores can be used as anenergy reservoir [12], can fuel GBM cell proliferation[13], and must be maintained to avoid oxidative damage and lipotoxicity [14]. Recently, lipid metabolism hasemerged as a potential therapeutic target to treat gliomas, including GBM [9, 14, 15], and brain metastases[16].Lipid droplets are cytosolic organelles that, amongother functions, serve as a storage medium for the fattyacids, protecting the cell from oxidative damage andproviding an energy source to maintain proliferation inunfavorable microenvironments. Lipid droplet formationparticularly occurs under stressful conditions such ashypoxia and nutrient deprivation [17]. Accumulation oflipid droplets has been observed in a variety of cancers,including hepatic cancer, lung cancer, breast cancer, andgliomas, and is an important regulator of critical facets ofcancer including angiogenesis, inflammatory responses,apoptosis and cell death, and hypoxia-mediated alterations of lipid metabolism [18]. Although lipid dropletaccumulation has been observed in hypoxic cells withinseveral tumor types [19, 20], differential lipid metabolismbetween heterogeneous GBM cell types and microenvironments has remained unexplored. In this study, weanalyzed spatial alterations in gene expression and lipidcontent to determine the metabolic alterations present inGBM CSCs.MethodsHuman cell and organoid cultureGlioblastoma samples were obtained either directly frompatients undergoing resection following written informedconsent in accordance with protocol #2559 approved byPage 2 of 18the Cleveland Clinic Institutional Review Board or fromcollaborators as previously established patient-derivedtumorsphere cultures. Patient tissue samples were eitherfinely minced prior to organoid formation or were dissociated into single-cell suspensions, red blood cells werethen removed by brief hypotonic lysis, and cells werecounted for number and viability using trypan blue. Cellswere cultured as tumorspheres in Neurobasal mediumsupplemented with 10 ng/mL EGF (R&D Systems, Minneapolis MN), 10 ng/mL bFGF (R&D Systems), B27(Invitrogen, Carlsbad CA), glutamine (CCF media core),sodium pyruvate (Invitrogen), and antibiotics (Antibiotic–Antimycotic, Invitrogen) (“NBM complete”). Allcells used in this work were patient-derived primarycultures, and all specimens were verified by comparisonof short tandem repeat (STR) analysis performed periodically during the course of experimentation. Tumorspheres were used to form xenografts and harvested foranalysis as previously described [21]. All animal experiments were approved by the Cleveland Clinic Institutional Animal Care and Use Committee. Organoidswere formed as previously described [22] by suspendingtumor cells in 80% Matrigel (BD Biosciences, San Jose,CA) and forming 20 µL pearls on parafilm molds priorto culture. Organoids were cultured in 6-well or 10-cmplates with shaking in NBM complete media. For prospective stem cell sorting, subcutaneous xenografts wereminced and digested with papain (Worthington) as previously described [23], and dissociated cells were allowedto recover overnight prior to use. Following overnightrecovery from papain digestion, dissociated xenograftGBM cells were magnetically sorted based on CD133expression using magnetic beads (CD133/2 beads, Miltenyi). This approach has previously been validated to showdifferences in tumorigenic potential between CD133positive and CD133-negative fractions [21, 23–26].Regional isolation of GBM organoidsRegional labeling and subsequent cell isolation fromorganoid layers was achieved using a 20 µM final concentration of CellTracker Blue CMAC Dye (Invitrogen,#C2110) in media. Mature organoids were incubatedwith dye for 2 h at 37 C with shaking to allow outer layerlabeling. Desired labeling depth was verified using a confocal microscope and a compatible imaging dish (MatTek #P35GC-1.0-14-C). After labeling, organoids werefinely chopped and dissociated using Accutase (FisherSci, #ICN1000449) at 4 C for 15 min and then heatedto 37 C for another 10 min. Cells were then single-cellfiltered, and live cells were isolated by fluorescence-activated cell sorting (FACS) using 1 µM Calcein-AM (Invitrogen, #C3099MP) and 1:2000 TO-PRO3 (Invitrogen,#T3605) according to the manufacturer’s protocols. Cell
Shakya et al. acta neuropathol commun(2021) 9:101sorting and analysis were performed using a BD FACSARIA II flow cytometer.RNA‑sequencing analysisTotal RNA was extracted using TRIzol reagent (LifeTechnologies) and purified with phenol–chloroform extraction including the use of PhaseLock tubes(5PRIME). Samples were prepared for RNA-seq according to the manufacturer’s instructions (Illumina) andsequenced using 101-bp paired-end chemistry on aHiSeq-2000 machine in the UTHSCSA Genomic Facility. FASTQ files were trimmed with TrimGalore, whichimplements Cutadapt [27] and FastQC [28], to removelow quality reads and trim adapters. Reads were alignedto Gencode v29 using Salmon [29] with correction forGC bias, positional bias and sequence-specific bias.The R/Bioconductor package tximport [30] was used togenerate TPM values. Low-expressed genes without atleast 1 count in 4 samples were excluded from analysis.Comparisons were performed using DESeq2 [31] on rawcounts. PCA plots were generated using the ‘prcomp’function from the R/Bioconductor package ‘stats’ withdefault arguments. GSEA analysis was performed usingmSigDB (Broad Institute).Gene expression measurement by RT‑qPCRSorted cells (above) were expanded in permissive media(NBM complete for CSCs or DMEM with 10% FBS (CCFmedia core) and antibiotics (Antibiotic–Antimycotic,Invitrogen) for non-CSCs). Cell pellets were collected bycentrifugation, flash frozen and stored at 80 C for laterRNA isolation. Total RNA was extracted using TRIzolreagent (Life Technologies) and Phase Lock Gel Heavytubes (5PRIME). RNA was quantified using Nanodrop2000 spectrophotometer (Thermo Scientific), and single strand complementary DNA (cDNA) was preparedusing SuperScript III Reverse Transcriptase (Invitrogen#18080093) using 1 µg of RNA each. RT-qPCR was performed using TaqMan gene expression assays (Invitrogen #4331182) for FADS1 (Assay ID #Hs00203685 m1)and FADS2 (Assay ID #Hs00927433 m1) in an AppliedBiosystems 7500 real-time PCR system, with 18S as thehousekeeping gene. Analysis was performed using theΔΔCt method.FACS sorting and analysisCells were acutely sorted from subcutaneous xenograftsas described above and incubated with BODIPY 505/515(Invitrogen, D3921) or Nile Red (Invitrogen, N1142) for15 min in the dark. Cells were washed multiple timeswith sterile PBS and resuspended in Neurobasal mediumPage 3 of 18with 0.5% BSA prior to FACS sorting and analysis using aBD FACSAria II cytometer in the Cleveland Clinic FlowCytometry core.Knockdown of FADS1 and FADS2 gene expressionTo knockdown gene expression, independent humanFADS1 and FADS2 specific shRNA clone sequences werepurchased, along with non-targeting control shRNA(Sigma). Recombinant lentiviruses were producedby transfection of 293 T cells plated in 10 cm dishes(4.5 106 cells/dish) cultured in DMEM (with 10% FBSand Antibiotic–Antimycotic) medium. The FADS1/2 lentiviral vector (20 µg), psPAX2 (10 µg), and pMD2.G (5 µg)were co-transfected into 293 T cells using calcium phosphate mediated transient transfection. The next morning, cells were fed with fresh NBM complete medium andvirus containing media (VCM) were collected twice over48 h, filtered using 0.22 micron filter and freeze storedat – 80 C for later use. For infection of GBM CSCs,cells were plated in Geltrex matrix coated 10 cm dishes(1 106 cells/dish) overnight in NBM complete mediumwhich was replaced by VCM the next day. After a day ofinfection, cells were allowed to recover before undergoing antibiotic selection using 2 µg/mL of puromycin inNBM medium. Cells surviving antibiotic selection werethen dissociated and collected. Knockdown efficiency ofall FADS1 and FADS2 shRNAs were determined by performing RT-qPCR as described above, and 2 shRNAs foreach gene with the highest knockdown efficiency werechosen for downstream experiments.CellTiter‑Glo luminescent cell viability assayCells collected after FADS1/2 knockdown were resuspended in NBM complete medium, counted and platedin Geltrex matrix coated 96-well plates (2000 cells/well).Cells were then grown in a 37 C tissue culture incubatorin culture media for 5 days. Cell viability was determinedusing CellTiter-Glo luminescent cell viability assay (Promega, G7570) as per manufacturer’s instructions.Limiting dilution assayTo determine tumorsphere-propagating potential, livecells were FACS sorted into wells of 96-well plates at concentrations ranging from 1 to 32 cells per well. For cellsfrom FADS1/2 knockdown, cells were counted and platedinto 96-well plates at concentrations ranging from 1 to128 cells per well. Cells were then grown in a 37 C tissueculture incubator in culture media for 14 days. The presence or absence of spheres in each well was then assessedand analyzed using the ELDA analysis tool (http:// bioinf. wehi. edu. au/ softw are/ elda/) to calculate stem cell frequencies [32].
Shakya et al. acta neuropathol commun(2021) 9:101Oil Red O histochemistryFor organoid Oil Red O staining, whole organoids werefixed in 4% paraformaldehyde, cryoprotected in 30%sucrose, and snap frozen in OCT using an isopentanebath chilled with dry ice. Tissue sections with a thicknessof 10 µm were cut on a cryomicrotome and mounted onglass slides. Oil Red O staining was performed by theCleveland Clinic Lerner Research Institute imaging corefollowing standard core protocols using commercialcontrol slides. Slides were digitized with a Leica Aperiodigital slide scanner (Leica). For primary patient GBMsamples, freshly resected GBM tissue specimens fromthe Department of Neurosurgery, Odense UniversityHospital, Odense, Denmark, were frozen at – 40 C usingthe MCC cryoembedding compound and PrestoCHILLdevice (Milestone). Tissue sections with a thickness of8 µm were cut on a cryomicrotome and mounted onglass slides. The slides were left to dry for 15 min at roomtemperature and fixed for one hour. Following fixation,slides were washed three times with deionized waterand incubated with Oil Red O staining solution (Fluka,CI26125, dissolved in 60% triethyl phosphate) for 30 min.After staining, slides were washed with deionized waterthree times and counterstained with Mayer’s hematoxylin (Merck). Slides were then rinsed with deionized waterfor 5 min and mounted with a coverslip using Aquatexmounting medium. Finally, slides were digitalized withthe NanoZoomer 2.0HT digital image scanner (Hamamatsu, Japan). The use of tissue specimens was approvedby the Danish Data Inspection Authority (approval number 16/11065) and the Regional Scientific Ethical Committee of the Region of Southern Denmark (approvalnumber S-20150148).Targeted lipidomic profilingQuantification of neutral lipids and glycerophospholipidswas conducted as previously described [33, 34]. Briefly,approximately 10 mg of frozen mouse liver was homogenized in 800 mL ice-cold 0.1 N HCl:CH3OH (1:1) usinga tight-fit glass homogenizer (Kimble/Kontes Glass,Vineland, NJ) for 1 min on ice. The suspension wasthen transferred to cold 1.5 mL microfuge tubes (Laboratory Product Sales, Rochester, NY) and vortexed with400 mL cold C HCl3 for 1 min. The extraction proceededwith centrifugation (5 min, 4 C, 18,000 g) to separate thetwo phases. The lower organic layer was collected, andthe solvent was evaporated. The resulting lipid film wasdissolved in 100 mL isopropanol:hexane:100 mmol/L NH4CO2H(aq) (58:40:2) (mobile phase A). Quantificationof glycerophospholipids was achieved by the use of a liquid chromatography–mass spectrometry technique usingsynthetic (non-naturally occurring) diacyl and lysophospholipid standards. Typically, 200 ng of each odd-carbonPage 4 of 18standard was added per 10–20 mg tissue. Glycerophospholipids were analyzed on an Applied Biosystems/MDS SCIEX 4000 Q TRAP hybrid triple quadrupole/linear ion trap mass spectrometer (Applied Biosystems,Foster City, CA) and a Shimadzu high-pressure liquidchromatography system with a Phenomenex Luna Silicacolumn (2, 3, 250 mm, 5 mm particle size) using a gradient elution. The identification of the individual species, achieved by liquid chromatography-tandem massspectrometry, was based on their chromatographic andmass spectral characteristics. This analysis allows identification of the two fatty acid moieties but does not determine their position on the glycerol backbone (sn-1 vs.sn-2). Triacylglycerol (TAG), diacylglycerol (DAG), andmonoacylglycerol (MAG) from frozen mouse liver tissue(10–15 mg) were extracted by homogenizing tissue in thepresence of internal standards (500 ng each of 14:0 MAG,24:0 DAG, and 42:0 TAG) in 2 mL PBS and extractingwith 2 mL ethyl acetate: trimethylpentane (25:75). Afterdrying the extracts, the lipid film was dissolved in 1 mLhexane:isopropanol (4:1) and passed through a bed of 60Å Silica gel to remove the remaining polar phospholipids.Solvent from the collected fractions was evaporated, andlipid film was redissolved in 100 mL CH3OH:CHCl3 (9:1)containing 10 mL of 100 mmol/L CH3COONa for massspectrometry analysis as described previously [33, 34].Measurement of de novo lipogenesis fluxBulk GBM tumors were sorted to enrich populationsin cancer stem cells (CD133 ) or non-stem (CD133-)populations which were seeded in 35-mm plates. Measurement of de novo lipogenesis rates was accomplishedby tracing [14C]-acetate or [3H]-oleate into triacylglycerol and total phospholipids as described previously [33,35]. Sorted cell populations were simultaneously incubated with 0.5 µCi [14C]-acetate (substrate for de novofatty acid synthesis) or 1 µCi [3H]-oleate (substrate fordirect esterification into complex lipids), and then cellswere harvested at various time points (30 min, 60 min,120 min and 240 min) post substrate addition. From eachtime point cells were rinsed with PBS (twice), lipids wereextracted using a Folch extraction [36], and separated bythin layer chromatography (TLC) using hexane:diethylether:acetic acid (70:30:1) as a solvent system. Total phospholipids and Triacylglycerol spots were scraped off ofthe plate, and the incorporation of [14C]-acetate and[3H]-oleate into each lipid class was determined by liquidscintillation counting. Radiation count was normalized toamount of protein, as quantified by BCA assay (Pierce).
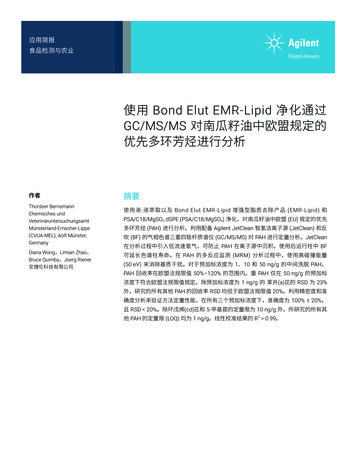
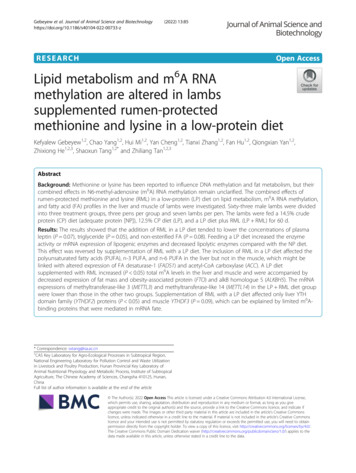
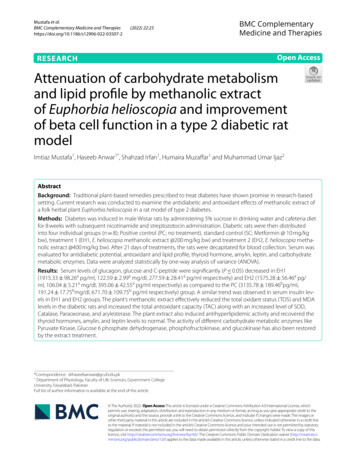
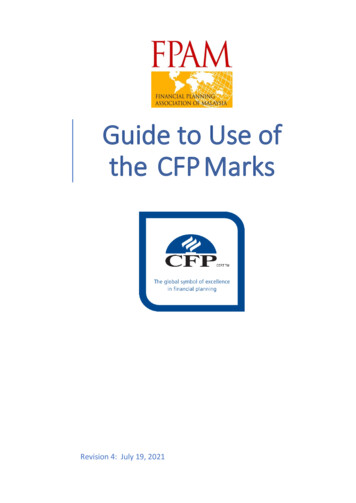
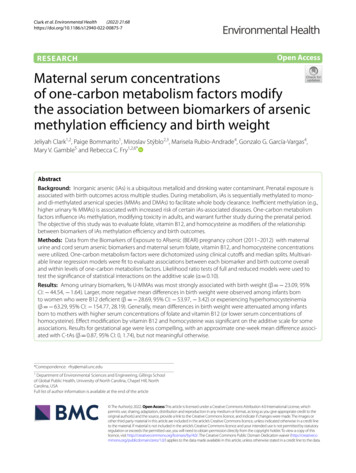
Shakya et al. acta neuropathol commun(2021) 9:101Page 5 of 18(See figure on next page.)Fig. 1 GBM organoids mimic the pathologic transition zones and molecular heterogeneity of GBM patient tumors. A H&E staining of GBM 3Dorganoids (right panel) reveals histological zones comparable to GBM primary patient tumors (left panel). The perivascular region and hypoxiccore in primary patient tumors (left panel) are mimicked by the organoid proliferative rim and hypoxic core regions (right panel), respectively. B Tocompare the molecular signature of these histological regions, the organoids were stained whole to label the entire outer rim region, and singlecells were isolated. C Limiting-dilution assays showed that the organoid proliferative rim is functionally enriched for stem cells compared to thehypoxic core. Calculated stem cell frequencies and 95% confidence intervals are shown. D Upon RNA-seq analysis of single cells, distinct cell-typesignatures were found to be enriched within spatially separate niches in the organoids. E Mapping expression in organoids to the regional Ivy GAPdatabase showed region-specific enrichment. Scale bar 100 µmResultsGBM organoids mimic the pathologic transition zonesand molecular heterogeneity of GBM patient tumorsGBM tumors have a complex microenvironment definedby histologic hallmarks of angiogenesis and pseudopalisading necrosis, and these two anatomic featuresharbor distinct GBM cell populations. CSCs are particularly enriched in the perivascular niche of glioblastomatumors [37]. Current culture models fail to replicate thecomplex microenvironments of CSCs, limiting our abilityto study and therapeutically target GBM. We previouslydeveloped 3D patient-derived GBM organoids that showa heterogeneous mix of cells forming zones comparative to the pathologic transition zones in patient tumors[22]. GBM organoids can be conceptually divided intotwo zones—an outer cell-dense rim consists of dividingcells in a high-oxygen and high-nutrient environmentprovided by the nearby media, mimicking the conditionsof the tumor perivascular niche, and a hypoxic core withnecrotic cells relatively deprived of the nutrient mediacomponents, which phenotypically mimics the hypoxicand perinecrotic regions of GBM tumors (Fig. 1A).To determine whether these ex vivo culture regionsmolecularly mimic the corresponding patient GBMtumor regions, we developed a method to three-dimensionally label and sort live GBM cells from our organoid cultures (Fig. 1B). Whole organoids were incubatedwith a blue lipophilic dye for an optimized period thatwe empirically determined to be sufficient to label onlythe outer proliferative niche as viewed by live confocalz-section imaging. Organoids were then dissociated andsorted via FACS to separate these spatially distinct cellpopulations. Cells in the outer rim display enhanced selfrenewal, a CSC hallmark, compared to cells within thecore, as determined by limiting-dilution assay (Fig. 1C).We performed spatially defined RNA-sequencingof the different regions of GBM organoids to investigate the gene expression in each niche population.Recently, Neftel et al. [7] defined single-cell heterogeneity of patient GBM cell populations as being dominated by clusters of genes that change in relationship toeach other, called meta-modules. We compared thesegene expression signatures to these meta-module genesignatures from single cell RNA sequencing (scRNA-seq)of clinical GBM. We found distinct cell-type signaturesenriched within spatially separate niches in our organoids (Fig. 1D). As anticipated, the cells from the organoid core were enriched for hypoxia hallmark genes asdetermined by gene set enrichment analysis (GSEA; FDRq value 3.22 10 16) and displayed a signature of thehypoxia-dependent mesenchymal-like 2 (MES2) metamodule defined by scRNA-seq of patient tumor cells. Incontrast, cells from the organoid rim were enriched forgenes found in the astrocyte-like (AC) and oligodendrocyte precursor cell (OPC)-like meta-modules (Fig. 1D).Additionally, the cells from the organoid rim highlyexpressed genes related to the G1/S meta-module,indicating high proliferation in this niche. Overall, theexpression profiles within our spatially segregated organoid microenvironments represent 3 out of 4 categoriesof discrete GBM cell types identified in clinical tumors byNeftel et al. [7].While these data provide resolution to connect thediverse cell types present in GBM organoids with individual cell signatures from clinical tumors, the singlecell sequencing data cannot be directly traced to spatialtumor subregions. To correlate the niche-specific geneexpression in organoids and the gene expression of different regions of primary GBM tumors, we reflected oursequencing data upon subregion sequencing data from41 patient samples in the Ivy Glioblastoma Atlas Project(Ivy GAP) database [38] (Fig. 1E). We found that genessignificantly enriched in the organoid core were specifically highly expressed in the pseudopalisading and perinecrotic tumor regions of primary GBM. Conversely,the organoid rim was found to be enriched for genesexpressed in the cellular tumor regions and depleted ofthose expressed in regions of hypoxia. Taken together,these data show that the 3D environments within GBMorganoids recapitulate at least part of the cellular andmicroenvironmental diversity within primary GBMtumors at both a histologic and molecular level.Genes that are differentially overexpressed in tumorcompared to normal brain tissue may suggest a possibletherapeutic window for a candidate therapeutic target inbrain tumors. To determine genes from our analysis that
Shakya et al. acta neuropathol communAGBM Pa ent: CCF3128(2021) 9:101Page 6 of 18GBM Organoid: CCF3128BNiche-specificCharacteriza oid CoreDEHILPDASLC2A3NDRG1VIMPLOD2Suva 1THY1PTPRZ1PCNAMCM2RRM2MCM4CMAC Outer regionCMAC - Inner regionLog Frac on NonrespondingCDose (number of cells)
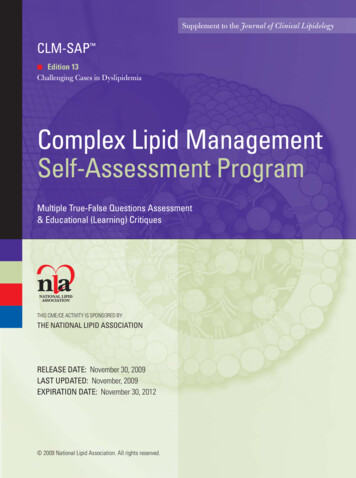
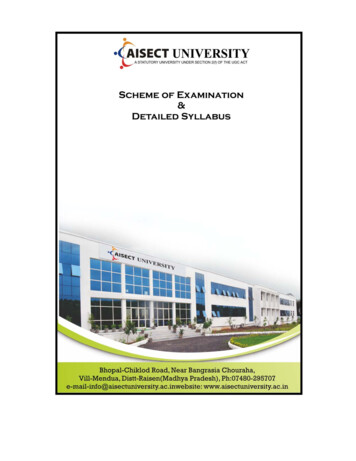
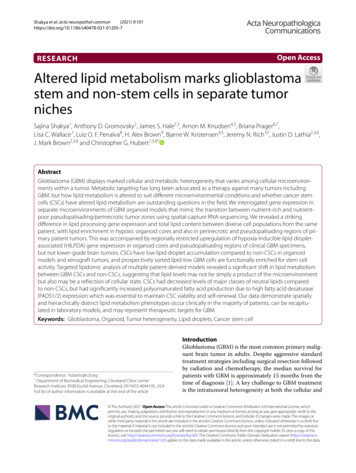
Shakya et al. acta neuropathol commun(2021) 9:101Page 7 of 18(See figure on next page.)Fig. 2 Lipid droplet accumulation in perinecrotic and pseudopalisading tumor regions and corresponding GBM organoid cores. A Publiclyavailable databases show that HILPDA is consistently increased in GBM tumors and specifically enriched in hypoxic pseudopalisading cells, which isrecapitulated by the organoid core. * p 0.01; ** p 0.001; ns, p 0.05. Lipid droplet staining with Oil Red O shows higher staining in the B organoidcore and C pseudopalisading and perinecrotic regions of primary tumors. Scale bar for wide field images 100 µm and 50 µm for other images. D Piecharts representing the findings in 11 patient tumors and 9 organoidsmay be upregulated in tumor compared to normal brain,and upregulated in increasing grades of tumor, we compared the TCGA, Gravendeel, Bao and Ivy GAP datasetsusing the GlioVis portal [39]. First, to validate our findings,we chose to look at differential expression of specific genesthat represent the different regions, particularly highlighting representative genes from the three different metamodules, including a well-established hypoxia marker,Carbonic Anhydrase 9 (CAIX, Additional file 1: Fig. S1).We found that CAIX and vimentin (VIM) (Mes2 metamodule) were highly expressed in GBM brain tumor compared to non-tumor tissue, due in part to their increase inpseudopalisading regions. This was reflected in GBM organoids where expression of the CAIX and VIM genes waslikewise increased in the core region compared to the rim.Although the expression of the OLIG1 (OPC meta-module) and AQP4 (AC meta-module) genes was not significantly increased in GBM compared to non-tumor tissue,these genes are differentially expressed within GBM patienttumor regions and these differences are again recapitulatedin the corresponding organoid regions. Taken together,the above findings demonstrate that we can recapitulatetumor-relevant cellular heterogeneity and maintain microenvironmentally regulated GBM cell behavior ex vivo.Lipid droplets accumulate in the core of GBM organoidsand the corresponding perinecrotic and pseudopalisadingzones of GBM patient tumorsIn addition to the above genes, we identified the genehypoxia-inducible lipid droplet-associated (HILPDA),which encodes a protein necessary for lipid trafficking incytosolic lipid droplets, to be consistently differentiallyexpressed in the different regions of 3D GBM organoidsand GBM clinical datasets (Fig. 2A). HILPDA expressionwas significantly higher in brain tumor tissue comparedto normal brain and higher in GBM compared to lowergrade brain tumors. Moreover, in primary GBM, HILPDAexpression was significantly higher in the pseudopalisadingregion of the tumor. The increase in HILPDA expressionin only GBM and not lower-grade brain tumors, combinedwith the specific increase in pseudopalisading regions, isconsistent with brain tumor pathology as pseudopalisading necrosis is a defining diagnostic feature of GBM. Weobserved similar differences in the corresponding regionsof GBM organoids: HILPDA expression was significantlyhigher in the core region of organoids compared to the rim(Fig. 2A).Although we had not initially sought to investigatelipid metabolism, the increase in HILPDA expression,combined with an increase in hallmark adipogenesisgenes (p 2.45 10 5, FDR q-value 1.36 10 4) andcholesterol homeostasis genes (p 2.16 10 5, FDRq-value 1.36 10 4) in the organoid core compared tothe rim, prompted us to investigate whether there wasany lipid accumulation phenotype that would indicatean overall alteration in lipid metabolism and storage. Wetherefore stained sections from primary GBM samples andlab-grown GBM organoids with a lysochrome diazo dye,Oil Red O, for histological visualization of lipid droplets.We observed notable differences in lipid droplet stainingwithin
(FADS1/2) expression which was essential to maintain CSC viability and self-renewal. Our data demonstrate spatially and hierarchically distinct lipid metabolism phenotypes occur clinically in the majority of patients, can be recapitu-lated in laboratory models, and may represent therapeutic targets for GBM.