Transcription
Center forGlobalizationand StrategyIESE Citiesin Motion Index2016
CONTENTSPreface 05Working Team 07Academic Team 07Sponsors 07Introduction: The Need for a Global Vision 08Our Model: Cities in Motion. Conceptual Framework, Definitions and Indicators 09Limitations of the Indicators 20Geographical Coverage 20Cities in Motion. Ranking22Cities in Motion. Ranking by Dimension 24Cities in Motion. Regional Ranking 33Some Noteworthy Cases 35Evolution of the Cities in Motion Index 38Cities in Motion vs. Other Indexes 41Cities in Motion: A Dynamic AnalysisConclusions4345Appendix 1. Indicators 47Appendix 2. 181 City Profiles 52
PREFACEFor the third consecutive year, we are pleased to present a new edition of the Cities in MotionIndex (CIMI), which aims to evaluate different cities in relation to 10 dimensions that we consider key: the economy, human capital, technology, the environment, international outreach,social cohesion, mobility and transportation, governance, urban planning and public management.In recent years, we have observed an intensification of the urbanization process; it has becomea trend that will mark the way we view our lives. According to the most reliable estimates, in2050, 70% of the world’s population will live in cities (currently, this percentage is 56%). Andalthough they generate 80% of global economic growth and wealth, cities around the world facemajor global challenges, including economic crises (the polarization of income, unemploymentand inflation), demographic trends (the aging of the population, segregation and immigration),social divisions (heterogeneous social demands, the digital divide, inequality and poverty) andenvironmental consequences (energy inefficiency, waste management and pollution). The scope and magnitude of all of this create new challenges for cities’ sustainability.To meet these challenges, the world’s cities must undergo a strategic review process and consider what kinds of cities they want to be, what their priorities are and where they stand now.In this regard, our index aims to become a platform that will enable an initial comprehensiveassessment of cities to be carried out and offer a first point of reference with respect to othermajor cities through comparative analysis.As in the previous editions, we faced the challenge of creating an index of cities that is betterthan those that already exist – an objective and comprehensive index with wide coverage andguided by the criteria of conceptual relevance and statistical rigor. The first two editions achieved great media coverage and were very well received in various forums related to city management, which has encouraged us to continue working to improve it. At our book launches,we received a lot of recommendations and suggestions, and we have tried to incorporate theminto this new edition. Among the most important changes in this year’s index are the following: Wider geographical coverage: We have increased by 23% the number of cities includedin the ranking, with a total of 181 (72 of them capital cities) and more than 80 countriesrepresented. This effort allows us to assert that the index is among those with the widestgeographical coverage existing today. Higher number of indicators: We have increased by 10% the number of indicators measuring the 10 relevant dimensions of a city, with a total of 77 indicators. Greater variability at city level: As a result of the incorporation of new sources of information, some indicators that had been introduced in the first edition by country are appliednow by city, which has enabled a better assessment to be obtained of the various cities. Combination of objective and subjective indicatorss: In calculating our index, wehave applied quantitative variables that capture both objective and subjective data,which allows us to offer a wider view of the city based on the opinions of the public. Better analysis: We have incorporated new analyses of the dynamics of the CIMI, considering its evolution for the years 2013, 2014 and 2015. Improved methodology: We have refined our methodology in accordance with the lateststatistical practices for creating synthetic indexes.5IESE Business School - IESE Cities in Motion Index
We trust that this report will be useful to mayors, city managers and all those interest groupswhose aim is to improve the quality of life of city residents. We also hope that it will be usefulto companies dedicated to urban solutions, since internationalization strategies are definedmore and more at the city level and not at the country level.We regard this project as a dynamic one. We continue to work so that future editions of theCIMI contain better indicators, wider coverage and an increasing predictive value. We aregrateful, therefore, for any feedback that might help us improve, and we are always at yourdisposal via our website (www.iese.edu/cim).We are convinced that we can live in better cities, but this will be possible only if all the socialactors – the public sector, private companies, civic organizations and academic institutions –contribute and collaborate to achieve this common goal. This report is our small contribution.Prof. Pascual BerroneProf. Joan Enric RicartSchneider Electric Sustainabilityand Strategy ChairCarl Schroeder Chair of StrategicManagement6IESE Business School - IESE Cities in Motion Index
ABOUT USIESE Cities in Motion Strategies is a research platformlaunched jointly by the Center for Globalization andStrategy and IESE Business School’s Department ofStrategy.The initiative connects a global network of expertsin cities and specialist private companies with localgovernments from around the world. The aim is topromote changes at the local level and to develop valuable ideas and innovative tools that will lead to moresustainable and smarter cities.The platform’s mission is to promote the Cities in Motion model, with an innovative approach to city governance and a new urban model for the 21st centurybased on four main factors: a sustainable ecosystem,innovative activities, fairness among citizens and connected territory.CONSULTANT TEAMJuan Manuel BarrionuevoChairman of the Advisory Board of the IESE Cities inMotion platformSPONSORSWITH THE SUPPORT OFAND WITH THE COLLABORATION OFWORKING TEAMACADEMIC TEAMProf. Pascual BerroneSchneider Electric Sustainability and Strategy ChairProf. Joan Enric RicartCarl Schroeder Chair of Strategic ManagementCarlos CarrascoResearch assistantAna Isabel Duch T-FiguerasResearch assistantNicolas VolkhausenResearch assistantTECHNICAL TEAMDavid Augusto GiuliodoriEconfocus ConsultingMaría Andrea GiuliodoriProfessor of Statistics, Institute of Stock ExchangeStudies (IEB)7IESE Business School - IESE Cities in Motion Index
INTRODUCTION:THE NEED FOR AGLOBAL VISIONToday more than ever, cities require strategic planning.Only then can they consider pathways to innovationand prioritize what is most important for their future.The strategic planning process should be participatory andflexible, and a central aim should be established: to define a sustainable action plan that will make the metropolisunique and renowned. Just as two companies do not havethe same recipe for success, each city must look for itsown model on the basis of some common considerations.Experience shows that large cities must avoid a shortterm outlook and expand their field of vision. They shouldturn to innovation more frequently to improve the efficiency and sustainability of their services. And, also,they should promote communication and ensure thatresidents and businesses are involved in their projects.The time has come to practice intelligent governance that takes into account all the factors and socialactors – and with a global vision. In fact, over the pastfew decades, various national and international organizations have produced studies focusing on the definition, creation and use of indicators with a variety ofaims, although mainly to contribute to a diagnosis ofthe state of cities. In each of these studies, the definition of the indicators and their creation process are theresult of the study’s characteristics, the statistical andeconometric techniques that best fit the theoretical model and available data, and the analysts’ preferences.Today we have a lot of “urban” indicators, although manyof them are not standardized and are not consistent orcomparable among cities. In fact, numerous attemptshave been made to develop city indicators at the national,regional and international level. However, few have beensustainable in the medium term, as they were created forstudies meant to cover the specific information needs ofcertain bodies, whose lifespan depended on how long thefinancing would last. In other cases, the system of indicators depended on a political desire in specific circum-8stances, so they were abandoned when political prioritiesor the authorities themselves changed. As for the indicators developed by international organizations, it is truethat they strive for the consistency and solidity necessaryto compare cities; however, for the most part, they tendto be biased or focused on a particular area (technology, the economy and the environment, among others).Taking all this into account, the Cities in Motion Index(CIMI) has been designed with the aim of constructinga “breakthrough” indicator in terms of its completeness, characteristics, comparability and the quality andobjectivity of its information. Its goal is to enable measurement of the future sustainability of the world’s maincities as well as the quality of life of their inhabitants.The CIMI aims to help the public and governments to understand the performance of 10 fundamental dimensionsfor a city: governance, urban planning, public management, technology, the environment, international outreach,social cohesion, mobility and transportation, human capital, and the economy. All the indicators are linked with astrategic aim that leads to a different kind of local economicdevelopment: the creation of a global city, the promotion ofthe entrepreneurial spirit, and innovation, among others.Each city is unique and unrepeatable and has its ownneeds and opportunities, so it must design its own plan,set its priorities and be flexible enough to adapt to changes.Smart cities generate numerous business opportunitiesand possibilities for collaboration between the public andprivate sectors. All stakeholders can contribute, so anecosystem network must be developed that will involve allof them: members of the public, organizations, institutions,government, universities, experts, research centers, etc.Networking has its advantages: better identification ofthe needs of the city and its residents, the establishment of common aims and constant communicationamong participants, the expansion of learning opportunities, increased transparency, and the implementationof more flexible public policies. As a report by the Organization for Economic Cooperation and Development(OECD) pointed out back in 2001, the network approachallows local policies to be focused on the public.Private enterprise also has much to gain with this systemof networking: it can collaborate with the administrationIESE Business School - IESE Cities in Motion Index
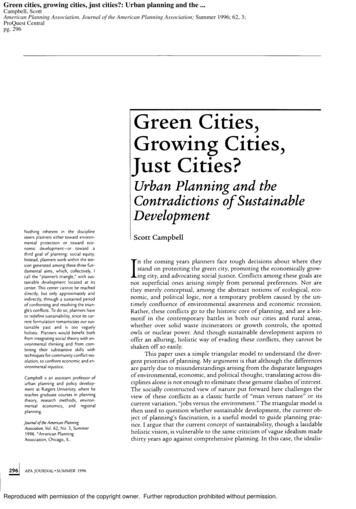
in the long term, access new business opportunities,gain a greater understanding of the needs of the localecosystem, gain international visibility, and attract talent.Thanks to its technical expertise and its experience inproject management, private enterprise, in collaborationwith universities and other institutions, is suited to leadand develop smart city projects. In addition, it can provideefficiency and significant savings to public-private bodies.Finally, it must not be forgotten that the human factoris fundamental in the development of cities. Without aparticipatory and active society, any strategy, however intelligent and comprehensive, will be doomed tofailure. Beyond technological and economic development, it is the public that holds the key for cities to gofrom “smart” to “wise.” That is the goal to which everycity should aspire: that the people who live there andtheir leaders deploy all their talent in favor of progress.To help cities identify effective solutions, we have created an index that captures 10 dimensions in a single indicator and includes 181 cities throughout theworld. Thanks to its broad and integrated vision ofthe city, the Cities in Motion Index enables the strengths and weaknesses of each city to be ficiencyEfficiencyMobilitySOCIAL COHESIONHealth &SafetyCONNECTIVITYCommunitySpiritCONDITIONSFOR ernationalConnectionsTechnologyPrivateSectorOur platform proposes a conceptual model based on thestudy of a large number of success stories and a seriesof in-depth interviews with city leaders, entrepreneurs,academics and experts linked to urban development.Our model proposes a set of steps that include diagnosis of the situation, the development of a strategy, andits subsequent implementation – and the first step togiving a good diagnosis is to analyze the status of keydimensions.We will now, therefore, set out the 10 key dimensions ofour model, as well as the indicators used in calculatingthe CIMI.HUMAN CAPITALPublicSpacesSUSTAINABILITYDiversityOUR MODEL:CITIES IN MOTION.CONCEPTUALFRAMEWORK,DEFINITIONS ANDINDICATORSInternationalConnectionsThe main goal of any city should be to improve its humancapital. A city with smart governance must be capable ofattracting and retaining talent, creating plans to improveeducation, and promoting creativity and research.Table 1 sets out the indicators used in the human capitaldimension, descriptions of them, their units of measurement and the sources of information.While human capital includes factors that make it moreextensive than what can be measured with these indicators, there is international consensus that level of education and access to culture are irreplaceable componentsfor measuring human capital. In fact, one of the pillarsof human development is human capital and, taking intoaccount that the Human Development Index publishedannually by the United Nations Development Programincludes education and culture as dimensions, it is validto regard these indicators as factors explaining the differences in human capital in a city.IESE Business School - IESE Cities in Motion Index
TABLE 1. HUMAN CAPITAL INDICATORSNO.INDICATORDESCRIPTION / UNIT OF MEASURESOURCE1Higher educationProportion of population with secondary and higher educationEuromonitor2Business schoolsNumber of business schools (top 100)Financial Times3Movement of studentsInternational movement of higher-level students. Number of studentsUNESCO4Number of universitiesNumber of universitiesQS Top Universities5MuseumsNumber of museums per city2thinknow6Art galleriesNumber of art galleries per city2thinknow7Expenditure on leisure andrecreationExpenditure on leisure and recreation. Expressed in millions of U.S.dollars at 2014 pricesEuromonitorIn the case of the CIMI, the following are considered witha positive sign: the proportion of the population with secondary education and higher, the number of businessschools, the flow of international students in each city orcountry, and the number of universities.As a measure of access to culture, account is taken ofthe number of museums, the number of art galleries,and expenditure on leisure and recreation, all in directrelation to the indicator. These indicators show the city’scommitment to culture and human capital. Creative anddynamic cities worldwide typically have museums and artgalleries open to the public and offer visits to art collections and events for the preservation of art. The existence of a city’s cultural and recreation provision results ingreater expenditure on these activities by the population.SOCIAL COHESIONSocial cohesion is a sociological dimension of cities defined as the degree of consensus among the members of asocial group or the perception of belonging to a commonsituation or project. It is a measure of the intensity of socialinteraction within the group. Social cohesion in the urbancontext refers to the degree of coexistence among groupsof people with different incomes, cultures, ages and professions who live in a city. Concern about the city’s socialsetting requires an analysis of factors such as immigration,community development, care of the elderly, the effectiveness of the health system and public inclusion and safety.10The presence of various groups in the same space andmixing and interaction between groups are essential in asustainable urban system. In this context, social cohesionis a state in which there is a vision shared by citizens andthe government of a model of society based on social justice, the primacy of the rule of law and solidarity. This allowsus to understand the importance of policies that underpinsocial cohesion based on democratic values.Table 2 sets out the indicators selected for this dimension,descriptions of them, their units of measurement, and theinformation sources. This selection of indicators seeks toincorporate all the sociological subdimensions of social cohesion, based on the different variables available.The ratio of deaths per 100,000 inhabitants and the crimerate are incorporated with a negative sign, while the healthindex is incorporated with a positive sign in the creation ofthis dimension’s indicator.Employment, meanwhile, is a fundamental aspect in societies, to the extent that, according to historical evidence,a lack of employment can break the consensus or the implicit social contract. For this reason, the unemploymentrate is incorporated with a negative sign in the dimensionof social cohesion. However, the ratio of women workersin the public administration is incorporated with a positivesign, since it is an indicator of gender equality in access togovernment jobs.IESE Business School - IESE Cities in Motion Index
TABLE 2. SOCIAL COHESION INDICATORSNO.INDICATORDESCRIPTION / UNIT OF MEASURESOURCE8Ratio of deathsRatio of death per 100,000 inhabitantsEuromonitor9Crime rateCrime rateNumbeo10Health indexHealth indexNumbeo11Unemployment rateUnemployment rate (number of unemployed / labor force)Euromonitor12Gini indexThe Gini index varies from 0 to 100, with 0 being a situation of perfectequality and 100 that of perfect inequalityEuromonitor13Price of propertyPrice of property as percentage of incomeNumbeo14Ratio of women workersRatio of women workers in the public administrationInternational LaborOrganizationThe Gini index is calculated from the Gini coefficient andmeasures social inequality. It assumes a value equal tozero for situations in which there is a perfectly equitableincome distribution (everyone has the same income) and itassumes the value equal to 100 when the income distribution is perfectly inequitable (one person has all the incomeand the others none). This indicator is incorporated intothe dimension with a negative sign, since a higher indexvalue has a negative effect on a city’s social cohesion.Finally, the price of property as a percentage of income isalso related negatively since, when the percentage of income to be used to buy a property increases, the incentivesto belong to a particular city’s society decrease.ECONOMYThis dimension includes all those aspects that promotethe economic development of a territory: local economicdevelopment plans, transition plans, strategic industrialplans, and cluster generation, innovation and entrepreneurial initiatives.The indicators used to represent the performance of cities in the economic dimension are specified in Table 3,along with descriptions of them, their units of measurement and the sources of information.inhabitants’ income. In addition, it is an important measure of the quality of life in cities. In numerous studies,GDP is considered the only or the most important measure of the performance of a city or country. However, in thisreport, it is not considered as exclusive nor as the mostimportant measure: it is considered as one more indicator within one of the 10 dimensions of the CIMI. Thus,its share of the total is similar to that of other indicators.For example, a city with a high or relatively high GDP, ifit does not have a good performance in other indicators,may not be in one of the top positions. In this way, acity that is very productive but has problems with transportation, inequality, weak public finance or a productionprocess that uses polluting technology probably will notbe in the top positions of the ranking.For its part, labor productivity is a measure of the strength, efficiency and technological level of the productionsystem, which, with regard to local and internationalcompetitiveness, will have repercussions, obviously, onreal salaries, on capital income, on business profits – areason why it is very important to consider the measurein the economic dimension, since different productivityrates can explain differences in the quality of life of acity’s workers – and on the sustainability over time of theproduction system.Considering that the CIMI seeks to measure, via multipledimensions, sustainability into the future of the world’smain cities and the quality of life of their inhabitants, realGDP is a measure of the city’s economic power and of its11IESE Business School - IESE Cities in Motion Index
TABLE 3. ECONOMIC INDICATORSNO.INDICATORDESCRIPTION / UNIT OF MEASURESOURCE15ProductivityLabor productivity calculated as GDP/working population (in thousands)Euromonitor16Time required to start abusinessNumber of calendar days needed so a business can operate legallyWorld Bank17Ease of starting a businessEase of starting a business. Top positions in the ranking indicate a morefavorable regulatory environment for creating and operatinga local companyWorld Bank18Number of headquartersNumber of headquarters of publicly traded companiesGlobalization andWorld Cities (GaWC)19Percentage of people at earlybusiness stagePercentage of 18 to 64-year-old population who are new entrepreneursor owners/managers of a new rsCompanies in an initial phase that represent a city’s economic bases.They represent economic dynamism and include a high proportion ofcompanies devoted to technology. Used per capita2thinknow21GDPGross domestic product in millions of U.S. dollars at 2014 pricesEuromonitorThe other indicators selected as representative of thisdimension enable the measurement of some aspects ofthe business landscape of a city, such as the number ofheadquarters of publicly traded companies; the entrepreneurial capacity and possibilities of a city’s inhabitants,represented by the percentage of people at an early business stage; entrepreneurial companies; the time requiredto start a business; and the ease of starting a businessin regulatory terms. These indicators measure a city’ssustainability capacity over time and the potential abilityto improve the quality of life of its inhabitants. The timerequired to start a business and the ease of launchingit are incorporated into the economic dimension with anegative sign, since lower values indicate a greater easeof starting businesses. The number of headquarters ofpublicly traded companies, the capacity, the number ofentrepreneurs and the entrepreneurial possibilities of acity’s inhabitants have a positive relationship, since thehigh values of these indicators reflect the economic dynamism of a city and the ease of allowing the installationand development of new businesses.PUBLIC MANAGEMENTThe public management dimension encompasses all thoseactions aimed at improving the administration’s efficiency,including the design of new organizational and management models. In this area, great opportunities open up forprivate initiative, which can bring greater efficiency.12In this work, public management is understood to behighly correlated with the state of public finances of acity or country. In this regard, public accounts decisivelyaffect people’s quality of life and a city’s sustainability,since they determine the level of present and future taxes that must support the residents and the productionsystem, the expected growth of the general price levels,the possibilities of public investment in basic social infrastructure, and incentives for private investment. Inaddition, if the state has funding needs, because of theweakness of the public finance system, it will competewith the private sector for funds available in the financialsystem, which will affect investment.The indicators that represent the public management dimension in this report are listed in Table 4, along withdescriptions of them, their units of measurement and thesources of information.The indicators related to the tax system, which are incorporated with a negative sign in this dimension’s syntheticindicator, cover aspects of the state of public financessince the greater the relative tax burden, the weaker acity’s public accounts are. The total tax rate measuresthe total amount of taxes and compulsory contributionspaid by businesses after accounting for deductions andexemptions allowed as part of commercial profits. Excluded are taxes withheld (such as income tax for naturalpersons) or taxes collected and remitted to tax authoritiesIESE Business School - IESE Cities in Motion Index
TABLE 4. PUBLIC MANAGEMENT INDICATORSNO.INDICATORDESCRIPTION / UNIT OF MEASURESOURCE22Total tax rateTotal tax rate. This measures the total amount of taxes and compulsorycontributions paid by businesses after accounting for deductions andexemptions allowed as part of commercial profitsWorld Bank23ReservesTotal reserves in millions of current U.S. dollarsWorld Bank24Reserves per capitaReserves per capita in millions of current U.S. dollarsWorld Bank25EmbassiesNumber of embassies per city2thinknow26TwitterTwitter users listed in prominent Twitter directories (e.g., Twellow).It includes users self-defined as leaders (for example, writers, activists,business leaders and journalists). In thousands of people2thinknow27Sales taxSales tax. This has a big impact on the economy. Lower rates of salestax can be used to finance investment in services and intelligentinfrastructure2thinknow(such as value added tax, sales tax or goods and servicestax). Similarly, sales tax has a big impact on the economy.Lower rates of sales tax can be used to finance investment in services and intelligent infrastructure.In turn, the level of reserves is an indicator of the strengthof the public finance system in the short and mediumterm, of their ability to cope with changing economic cycles, and of the strength and sustainability of the economic structure in relation to the state. Likewise, the number of embassies and consulates is an indicator of thecity’s international importance for global standards andis based on the embassies that foreign countries assignto the city.Active Twitter users with public data in the Twellow directory are those who are considered opinion leaders(activists, prominent critics of the government, businessleaders, writers and journalists, among others). Twittermessages tend to be transmitted via opinion leaders, soglobal directories provide a guide to the prominence ofdissenting voices and ideas within cities. In some authoritarian countries, publishing points of view and opinionsas a thought leader is risky, so there will be fewer activeleaders and critics in Twitter directories. This indicator isincorporated with a positive sign.13GOVERNANCEGovernance is the term commonly used to describe theeffectiveness, quality and sound guidance of state intervention. Given that the citizen is the meeting point forsolving all the challenges facing cities, account should betaken of factors such as the level of the public’s participation, the authorities’ ability to involve business leadersand local stakeholders, and the application of e government plans.Table 5 sets out the indicators used in the governancedimension to calculate the CIMI.The strength of rights index measures the degree towhich collateral and bankruptcy laws protect the rights ofborrowers and lenders and thus facilitate access to loans.The values go from 0 (low) to 12 (high) and the highestratings indicate that the laws are better designed to expand access to credit. Creating the conditions and ensuring the effective implementation of the rights of the public and companies situated in their territory is a functionof national or local states that cannot be delegated. Theperception of the observance of legal rights influences allaspects of life of a country or city, such as the businessclimate, investment incentives and legal certainty, amongothers. For this reason, the strength of rights index hasbeen incorporated with a positive sign in the creation ofthis dimension’s indicator.IESE Business School - IESE Cities in Motion Index
TABLE 5. GOVERNANCE INDICATORSNO.INDICATORDESCRIPTION / UNIT OF MEASURESOURCE28Strength of legal rights indexThe strength of legal rights index measures the degree to whichcollateral and bankruptcy laws protect the rights of borrowers andlenders and thus facilitate access to loans. The values go from 0 lowto 12 high, where the highest ratings indicate that the laws are
cators depended on a political desire in specific circum-stances, so they were abandoned when political priorities or the authorities themselves changed. As for the indi-cators developed by international organizations, it is true that they strive for the consistency and solidity necessary to compare cities; however, for the most part, they tend