Transcription
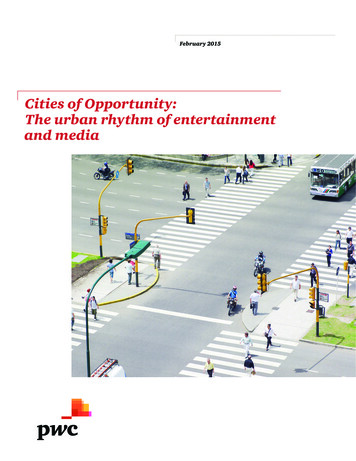
February 2015Cities of Opportunity:The urban rhythm of entertainmentand media
ContentsExecutive summary02Understanding the rhythm of urban consumers and creatorsSpending08A tale of two types of citiesEconomics14A creative industry wields tangible powerCities and E & M people18Creative hubs, consuming centers and combinationsCity snapshots26Looking closer at a few citiesImplicationsWhat it means for E & M companies32
Entertainment, media and urbanization:What cities mean to the industry .What the industry means to citiesDear Colleagues:What is the connection between the entertainment and media industry and today’spowerful global tide of urbanization? It seems intuitive that the two are intertwinedin terms of technology and production, marketing, sales, creativity and the talent theindustry requires. But what exactly does that mean economically for entertainmentand media (E & M) businesses making distribution and expansion decisions?With the spring 2014 release of the sixth edition of PwC’s Cities of Opportunity andour Global Entertainment & Media Outlook 2014-2018, it seemed the right time toinvestigate. Cities of Opportunity offers a balanced, quantitative social and economicbenchmarking of 30 of the world’s leading centers of business, finance and culture—running from London andNew York to Shanghai and Tokyo to Nairobi and Mexico City. Outlook adds the worldwide E & M total spendingperspective. In this study, we blended the findings of the two reports, added complementary research on urbanemployment, output and productivity and projected near-term patterns.The results identify major trends and opportunities. Broadly, entertainment and media employment will grow16% by 2025 with high productivity and strong share of jobs in many cities. And, while emerging cities representthe greatest growth potential, developed cities still dominate total spending.All in all, this study forecasts the levels of potential urban consumer spending in 30 key cities, paints a picture ofE & M’s role in urban economies, portrays the people who make the industry work and pinpoints some of the citiesto watch in the future. I hope you find the report interesting as well as insightful.Best regards,Deborah Bothun
Executive summaryUnderstanding the rhythm ofurban consumers and creatorsUrbanism and the entertainment and media industry share a naturalconnection. The cultural, technological and communications heart of themodern world is driven from cities and by cities. This makes perfect sense in atechnological world where over half of us (53.4%) live in cities today and overtwo-thirds will do so by mid-century (67.2%), according to the United Nations.1The connection crystallizes with analysis of the spending and working patternsin 30 of the world’s leading cities. Entertainment and media is a diverse andmajor economic force in developed and emerging cities. This study presents adetailed view of entertainment and media’s (E & M’s) biggest urban markets,mostly in the developed cities, and highest growth areas, typically amongemerging cities.The urban significance of the industry is underscored by its size: In our 30cities alone, we estimate spending in 2018 at 184 billion and employmentat 6.3 million. In addition, the importance of E & M to the economies ofcities is emphasized by examining the industry’s status as a major employerof young, highly-skilled urbanites and a generator of a significant share ofurban wealth. This is particularly true for cities like London, Tokyo, Berlin,Stockholm and Istanbul with high percentages of urban E & M jobs and/orgross domestic product.1 Population Division of the Department of Economic and Social Affairs of theUnited Nations secretariat, World Population Prospects: The 2011 Revision.2014 interpolated by Oxford Economics.2PwC
Among the key points, we find:E & M momentum is expected toremain in cities. Cities have beenat the vanguard for E & M, andwill continue to be as people andtechnologies concentrate in urbansettings. But that does not makemanaging the urban experience plainvanilla for E & M companies. Citiesshow significant differences, forinstance, between the level of E & Mspending and associated gross domesticproduct and/or employment. Somecities are fast growing spenders froma low base; others are big spenderswithout dynamic growth.But either way, as Erik Brynjolfsson,director of MIT’s center for digitalbusiness and author of “The SecondMachine Age,” recently told Cities ofOpportunity, cities will remain whereit’s at for creative industries likeE & M. “By getting people to be neareach other, you get what economistscall ‘externalities’ from idea-sharingvenues,” he explained. “That’s one ofthe great virtues of a university or acity. Unfortunately, it’s not somethingtechnology can replace—at least notin our generation.” (See video at www.pwc.com/cities).The top cities have the right stuff fora knowledge-based economy. They’re“inspiring” to professional workers.They offer businesses a solid footingin good practices and innovation,The top cities have the right stuff for aknowledge-based economy. They’re “inspiring”to professionals, offer businesses a solid footingin innovation, tech readiness and culture, andbalance creativity with consumption.technology readiness, cultural assetsand growth. They balance the creativityto generate content, and desire toconsume it. London, New York, Berlin,Los Angeles and Stockholm are a fewnotable ones.The outlook for E & M is strongand the largest growth is expectedin emerging cities such as Beijing,Shanghai, Mumbai and Jakarta—all ofwhich present an opportunity to reacha mass market with substantial growthpotential in one concentrated location.Meantime, developed cities will stilldominate spending albeit with lowergrowth rates.Business in emerging cities can stillenjoy significant short- to mediumterm growth in the traditionalmedia markets. Meantime, theyare also adopting the new forms ofentertainment and media quickly. Akey challenge could be finding peoplewith the appropriate skills to drive theindustry ahead locally.New York is on course to overtakeTokyo as the top spending city.By 2015 New York’s strong overalleconomy is forecast to overtake Tokyoas the top spending E & M city overall,followed by London in third place.Tokyo will grow only marginally witha compound annual growth rate(CAGR) of 0.7% from 2013 to 2018.E & M employment will grow 16%by 2025. Especially in the yearsfollowing the global financial crisis,the E & M sector has become animportant provider of high-qualityemployment. E & M accounts for 6% ofjobs on average across the 30 Cities ofOpportunity. By 2025, we project the5.85 million E & M jobs in our 30 citiesin 2013 will have grown to 6.8 million.Cities appear to be definingthemselves as creative centers,content consumers or combinations ofthe two. New York, London, Stockholmand Berlin, for instance, are buildingCities of Opportunity: The urban rhythm of entertainment and media3
vibrant E & M generating economiesthat continue to grow naturally basedon their social and economic strengths.And they are big spenders at the sametime. Chicago, on the other hand, is abig spender but creative content largelyenters the “city of broad shoulders”from beyond its borders—highlightingthe nature of E & M creation today. Theurban experience is increasingly global,and in many cases valuable contentcan be created far away without localcustomization.No city falls into the top quadrantof high spending and growth.But Hong Kong comes closest, adeveloped city that sits in the heartof fast-growing Asia.E & M holds a crucial role in theeconomy of the urban future, which isoften under-appreciated. For instance,the industry is highly productive,accounting for over 10% of grossdomestic product in 2013 for London,New York, Los Angeles, Berlin, Madridand Istanbul, and just shades less forStockholm, Beijing and Shanghai. Buttailored policy approaches such as filmtax credits to protect against runawayproduction costs are only recentlybeing applied as the value of the sectoris becoming recognized. With manyeconomies struggling to create jobsand many developed economies facingsustained austerity pressures, E & M canplay an important urban developmentrole. To place this in context, E & Mis broadly comparable in size to theconstruction and manufacturingindustry in most of our 30 cities, sectorsthat have benefited from specific policyinterventions for many years.E & M also has a very diverse natureof products, services and talent. Thishighlights the industry’s importancein terms of offering urban economicbalance, and therefore increasedresilience. For such an eclectic sector tocontinue to flourish it is important thatpolicy issues are understood aroundbusiness and financial support, skills,planning and taxation.E & M has a crucial roleto play in the economyof the urban future.The industry is highlyproductive, employs asignificant share incities like London andBerlin and adds urbaneconomic resilience.4PwC
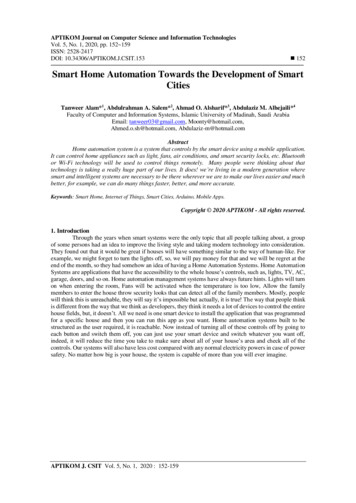
New York overtakes Tokyo as biggest spending cityTotal E M spending: Top 15 cities (2009-2018; in billions)200920142018Tokyo17.6New York19.7New York23.64.5%New 7.1Hong Kong9.1Hong Kong11.25.6%Los Angeles6.9Los Angeles8.3Los Angeles9.94.4%Hong 8Sau .2Toronto4.1Toronto5.05.2%Madrid2.4Sau Paulo3.7Paris4.92.8%Sau Paulo2.2Shanghai3.2Shanghai4.92013–18 CAGR10.2%Source: PwC Global E&M Outlook 2014 — 18, NICEPE & M employment will grow 16% by 2025.Especially in the years following the global financialcrisis, the E & M sector has become an importantprovider of high-quality employment.Cities of Opportunity: The urban rhythm of entertainment and media5
About the study:Approach andmethodologyThis report grows from twoother recent PwC studies—Citiesof Opportunity 6 and the GlobalEntertainment & Media Outlook 20142018. Cities of Opportunity 6 (www.pwc.com/cities) is a quantitativeranking of 30 of the world’s leadingcities. All cities included among the30 are global or regional centers ofbusiness, finance and culture. Cities arebalanced geographically and betweendeveloped and emerging economies.They are compared on nearly 60publically available, consistent andcredible data variables balancedbetween indicators of social andeconomic strength. Outlook (www.pwc.com/outlook) is an annual compendiumof 54 territories that provides totalspending in 13 entertainment andmedia sectors, internet access, as wellas analysis of industry issues in thevarious markets.Data from both studies was combinedfor this report by the Northern IrelandCentre for Economic Policy (NICEP),6PwCwhose economists also enhancedthe urban E & M picture with dataon employment and gross domesticproduct taken from city and nationalstatistics services, apportioning asneeded in the latter case. The resultprovides a close look at the size andsources of E & M urban spending amongthe 30 cities now and into 2025, themulticolored fabric of the urban E & Meconomy and workforce, and the profileof what it means to be an E & M city forthe city as a whole and its workers.Demographic profiles offered in the citysnapshots were developed for Cities ofOpportunity: We the urban people byOxford Economics. Methodology can befound at www.pwc.com/citiespeople.The E & M sector is comprised ofelements across a range of standardindustrial classifications identifiedand typically published at the nationaleconomy level. As such, sizing a sectorsuch as E & M requires the collectionof highly disaggregated statistics andapportionment converting national datato the city level.In instances where data is not available,we used other existing information atthe city level, supplementing it withinformation drawn from other cities thatare at a similar stage of development orin a similar geographic location. (Forinstance, in a situation where thereare two similar urban economies andonly one has advertising employmentstatistics published, employment inthe other city is estimated by assumingthat the advertising sector accounts fora similar proportion of employment inboth sectors.)Labor market information has beendrawn primarily from labor force andpopulation surveys. In some instances,where data is being highly disaggregated,national statistics authorities removeidentifying particulars to ensure recordsremain anonymized. As a consequence,our analysis only includes survey datafrom robust records.Similarly where GDP estimates of thescale of the sector are not published atthe required level, our approach has beento calculate productivity for the sector(that is, GDP per employee) using theavailable data (that is, assuming E & Mproductivity is broadly equivalent tothe city’s productivity in professionalservices) and then applying thoseestimates to the number of employeesin the sector.
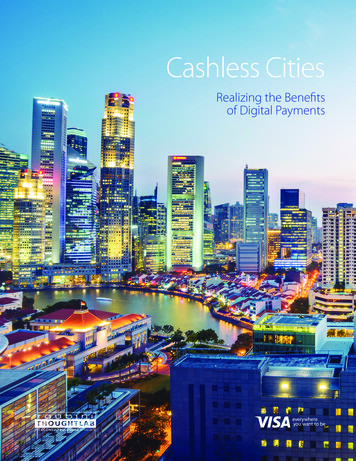
All financial information is quoted in2013 prices.To convert national segmenteddata (such as revenues, GDP andother statistics available only on acountrywide basis) into a city leveldataset, we used a series of economic,social and technology indicators. Forinstance, these apportionment methodswere applied to historical and projectednational revenues from the E&MOutlook to arrive at city figures. Thetable below provides an overview of theapportionment methods used for eachof the E & M segments.Other metrics tested for apportionmentinclude: Population – Population over 65,working age population and totalpopulation Technology – Number of mobilephone subscriptions and numberof telephone mainlines Employment – Total employment,private sector employment andconsumer services employment Gross domestic product (GDP) –Total GDP.How we apportioned national data to citiesIndustry segmentApportionment
director of MIT’s center for digital business and author of “The Second Machine Age,” recently told Cities of Opportunity, . The urban rhythm of entertainment and media 5 New York overtakes Tokyo as biggest spending city Total E M spending: Top 15 cities (2009-2018; in billions) Tokyo 17.6 New York 15.8 London 13.9 Seoul 8.6 Sydney 7.1 Los Angeles 6.9 Hong Kong 5.9 Chicago 4.7 Berlin 4 .