Transcription
The True-Luxury Global Consumer Insight4th EditionMilan, February 16th, 2017
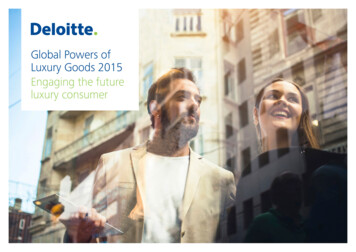
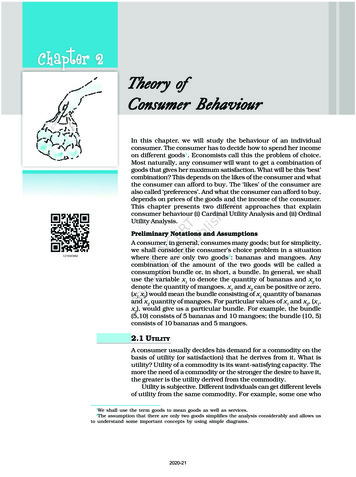
12 000 ConsumersVs.2016 Ed. 36 k Avg. luxury spend 1 000 in China 1 000 in USCopyright 2016 by The Boston Consulting Group, Inc. All rights reserved.The True-Luxury Global Consumer Insight panel10Nationalities 15 k Source: BCG-Altagamma True-Luxury Consumer InsightBCG Altagamma True-Luxury Global Cons Insight 2017 Ed v69 14feb17 Final No BUP.pptxDraft—for discussion only11
We push to be relevant on the highest segments ofthe luxury consumersTrue-Luxury Consumers sample distribution (% respondents)Luxury yearly spend1(k per consumer)3rd edition4th edition 100 k 1%7%25%50 - 100 k 6%18 %20 - 50 k 28 %30 %10 - 20 k 35 %25 %5 - 10 k 30 %20 %Average Spend foroverall sample 21 k 36 k Copyright 2016 by The Boston Consulting Group, Inc. All rights reserved.7%Clusters size evolution 4th vs 3rd Edition1. Expenditure includes personal luxury (e.g. handbags, shoes, sunglasses and other accessories, clothing) and experiential luxury (e.g. hotels, wine andspirits, exclusive vacations). Excluded cars, yachts, smartphones & tabletsSource: BCG-Altagamma True-Luxury Global Consumer InsightBCG Altagamma True-Luxury Global Cons Insight 2017 Ed v69 14feb17 Final No BUP.pptxDraft—for discussion only22
We set higher thresholds by category vs previousedition to identify a "True Luxury Consumer"CategoryHandbagsThreshold PriceExperiential Luxury Goodsvs. '16 1 000 / eachCategoryThreshold Price 200 / personRestaurantsShoes 300 / eachWine & Spirits 100 / bottleSunglasses 180 / eachHotels (leisure) 450 / night 180 /Cruise / resort 4 000 / pers./ weekOtheraccessories1each2Outerwear / Coats 1 400 / eachDesign furniture 3 000 / eachDresses for women 1 200 / eachLighting 1 000 / eachSuits for men 1 600 / eachSweaters / Knitwear 400 / eachShirts / Topwear 200 / eachJeans / Pants / Skirts 250 / eachFragrances & Cosmetics 100 / eachOther Luxury GoodsCategoryThreshold PriceCars 100 000 / each 400 / eachLuxury Boats / Yachts 750 000 / each 1 200 / eachSmartphones / Tablets 1 000 / eachWatches 2 000 / eachSmart watchesJewelryvs. '16vs. '16Minimum spent 5 k in the past yearon personal luxury goods1. "Other accessories " includes scarves, wallets, belts and ties2. 180 /each for Small Leather Goods, 150 /each for Silk GoodsSource: BCG-Altagamma True-Luxury Global Consumer Insight; BCGBCG Altagamma True-Luxury Global Cons Insight 2017 Ed v69 14feb17 Final No BUP.pptxDraft—for discussion only3Copyright 2016 by The Boston Consulting Group, Inc. All rights reserved.Personal Luxury Goods3
The True-Luxury Global Consumer Insight 4th EditionMain OutcomesSteady market, True luxury consumers growingA rising perception of price-value misalignmentMore casual, more customized!Copyright 2016 by The Boston Consulting Group, Inc. All rights reserved.True luxury consumers buying more at homeLuxury goes omnichannelMonobrand at the heart of an omnichannel experience#LuxurygoessocialBehavioral consumer segment evolutionBCG Altagamma True-Luxury Global Cons Insight 2017 Ed v69 14feb17 Final No BUP.pptxDraft—for discussion only44
Copyright 2016 by The Boston Consulting Group, Inc. All rights reserved.Steady market, True-Luxury Consumers growingBCG Altagamma True-Luxury Global Cons Insight 2017 Ed v69 14feb17 Final No BUP.pptxDraft—for discussion only5
The global luxury market worth 860Bn in 2016,experiential growing faster than personal luxuryGlobal luxury goods market (B )@ Retail 01320142015201616-23F2023FExperiential1. Personal goods include accessories, apparel, watches & jewelry, fragrances & cosmeticsSource: BCG Luxury Market modelprimocapitolo.pptxDraft—for discussion only6Copyright 2016 by The Boston Consulting Group, Inc. All rights reserved.4-5%09-131 1876
Out of 400 Mn Luxury Consumers only 17Mnidentified as "True-Luxury Consumers"CLUSTER2016# (M)50 k 20 k 10 k 5 k 2023Bn( )# (M)Beyond money0.40.5Top Absolute1.32.0Absolute4.56Entry Absolute1114Total True-Luxury1722Bn( )2 k Top Aspirational2128Other Aspirational375440Copyright 2016 by The Boston Consulting Group, Inc. All rights reserved. 5 72Total LuxuryConsumers 415 490 75Note: rounded numbersSource: BCG Luxury Market modelprimocapitolo.pptxDraft—for discussion only77
A further polarizing pyramid ahead: True-LuxuryConsumers up from 29% to 32% of global marketCLUSTER50 k 20 k 10 k 5 k 20162023# (M)Bn( )1# (M)Bn( )1Beyond money0.4200.540Top Absolute1.3302.053Absolute4.5936141Entry Absolute1110714147Total True-Luxury17250223812 k Top Aspirational21612892Other Aspirational375549440715Copyright 2016 by The Boston Consulting Group, Inc. All rights reserved. 131 196Total LuxuryConsumers 415 860 490 1185 3251. Including Experiential and Personal luxury, excluding cars and YachtsNote: rounded numbersSource: BCG Luxury Market modelprimocapitolo.pptxDraft—for discussion only88
True-Luxury Consumers maintaining a healthier andsteadier growth for the futureCAGR 2016 - %Aspirational1-2%5-6% 4%2-3%5-6%4-5%50 k 20 k 10 k 2 k Copyright 2016 by The Boston Consulting Group, Inc. All rights reserved.5 k Note: rounded numbersSource: BCG Luxury Market modelprimocapitolo.pptxDraft—for discussion only99
In a slower personal luxury market, there will beclear winners and losers among BrandsTurnover growth for 20 leading personal luxury brands12009 - 20132013 - 20162016 - 2023# brands14CAGR 10%Growth3CAGR 4% to 10%FlatCAGR 0% to 4%561DecreasingCAGR 0%Average MarketGrowthCopyright 2016 by The Boston Consulting Group, Inc. All rights reserved.Strong Growth.1828.3%3.8% 2-3%1. Sample of 20 leading brands in personal luxurySource: Press Search; BCG Analysisprimocapitolo.pptxDraft—for discussion only1010
In a slower personal luxury market, winners andlosers expected also among categoriesTrue Luxury Consumers net appetite by category140%33%21%15%10%0%Copyright 2016 by The Boston Consulting Group, Inc. All rights reserved.(net appetite people increasing spend in the future 20% – people decreasing spend in the future - 20%)-7%-25%ShoesFragrances &CosmeticsWatches& JewelryHandbagsClothing2SunglassesSmall leathergoodsSilkgoods1. Index calculated as percentage of customers who see growth in spend less the percentage who foresee a decrease in spend on the category (Positive – Negative).Multiple options answer (up to 5 categories ) 2. Including jeans / pants; shirts / topwear; dresses / suits; coats / outerwear; knitwearSource: BCG 2016 ad hoc study (12,000 luxury consumers in 10 countries)primocapitolo.pptxDraft—for discussion only1111
Appetite driven by Millennials with shoes and F&Ckey to recruit them - Handbags polarizedNet appetite by category1By 6%10%3%-7%22%18%23%15%13%32%24%21%Baby B. & Silver43%36%33%-25%Gen. X0%Copyright 2016 by The Boston Consulting Group, Inc. All rights reserved.Overall-10%-16%-11%-14%-27%-33%1. Index calculated as percentage of customers who see growth in spend less the percentage who foresee a decrease in spend on the category(Positive – Negative). Multiple options answer (up to 5 categories )Source: BCG 2016 ad hoc study (12,000 respondents in 10 countries)primocapitolo.pptxDraft—for discussion only1212
Chinese and Americans will continue to drive theappetite for luxury consumptionTrue Luxury Consumers net appetite by nationality1(net appetite people increasing spend in the future 20% – people decreasing spend in the future - 20%)24%41%24%20%18%13%11%11%Copyright 2016 by The Boston Consulting Group, Inc. All rights reserved.46%5%-10%Overall1. Index calculated as percentage of customers who see growth in spend less the percentage who foresee a decrease in spend (Positive – Negative)2. Share of nationalities in terms of luxury market valueSource: BCG Luxury Market model; BCG 2016 ad hoc study (12,000 luxury consumers respondents in 10 countries)primocapitolo.pptxDraft—for discussion only1313
True-Luxury Consumers showing a good appetitefor 2017True Luxury Barometer More( 4ppTrue LuxuryBarometer 1Copyright 2016 by The Boston Consulting Group, Inc. All rights reserved."Do you expect to spend more or less on luxury products in the next year?"1. Index calculated as percentage of customers who see growth in spend less the percentage who foresee a decrease in spend (Positive – Negative).The index represents a proxy of the expected growth of spend in Luxury by Top Luxury consumersSource: BCG 2016 ad hoc study (12,000 luxury consumers respondents in 10 countries)primocapitolo.pptxDraft—for discussion only1414
Only 17% of true luxury consumers declare they willspend less in 2017More( 20%)SameLess(-20%)40%43%43%17%Mainly lowspenderMillennials –mostly European57%" What are the key reasons for which youhave spent less?" External Luxurysectorrelated Economic instabilityTravel less frequentlyLower confidence in future incomeFear of terroristic attacksLuxury prices increasePersonal luxury saturationLess special occasions to attendLower interest in luxury brandsPartial shift to premium / fast fashion brandsBrands selling too much non core categoriesNote: multiple options answer (ranking of three reasons)Source: BCG 2016 ad hoc study (12,000 respondents in 10 countries)primocapitolo.pptxDraft—for discussion only15Copyright 2016 by The Boston Consulting Group, Inc. All rights reserved."This year have you spent more orless on luxury products vs last year?"15
Copyright 2016 by The Boston Consulting Group, Inc. All rights reserved.A rising perception of price – value misalignmentBCG Altagamma True-Luxury Global Consumer Insight 2017 Edition Draft PPT v44(Storyline).pptxDraft—for discussion only16
Over the last years the price of luxury iconic itemshas increased by far more than inflationIndex: 2010 100155Luxury iconicbags price13xGlobalinflationCopyright 2016 by The Boston Consulting Group, Inc. All rights reserved.11810020102012201420161. Average luxury products price increase calculated based on 2010-2016 list prices of a panel of iconic luxury handbagsSource: Press search; World Bank; BCG analysisBCG Altagamma True-Luxury Global Consumer Insight 2017 Edition Draft PPT v44(Storyline).pptxDraft—for discussion only1717
50% of Luxury consumers perceive a price/valuemisalignment. Americans & Millennials most disappointed"Do you feel a progressive separation between overall value of Luxury products and their price?"OverallNo48 %Yes52 %By nationality42 %58 %By generation49 %51 %56 %51 %49 %44 %MillennialsGen. XBaby B. &Silver45 %50 %54 %55 %50 %46 %Copyright 2016 by The Boston Consulting Group, Inc. All rights reserved.% ofrespondentsSource: BCG 2016 ad hoc study (12,000 respondents in 10 countries)BCG Altagamma True-Luxury Global Consumer Insight 2017 Edition Draft PPT v44(Storyline).pptxDraft—for discussion only1818
2 / 3 of misalignment perception driven by price, 1 / 3by exclusivity loss and product quality issues"Thinking about your favorite luxury brand, you told that you noticed a discrepancybetween the overall value and the price. What are the main reasons for this?"Emerging Markets% of respondents perceivinga price discrepancyKey reasons1#1 Iconic products' exclusivity loss#2 Lack of innovationCopyright 2016 by The Boston Consulting Group, Inc. All rights reserved.#3 Overall Brand's exclusivity loss63 %100 %Mature Markets37 %Key reasons1#1 Lower material e#2 Lower manufacture quality#3 Iconic products' exclusivity loss1. Multiple options answer (ranking of three reasons)Source: BCG 2016 ad hoc study (12,000 respondents in 10 countries)BCG Altagamma True-Luxury Global Consumer Insight 2017 Edition Draft PPT v44(Storyline).pptxDraft—for discussion only1919
8 out of 10 disappointed consumers plan to react :In 50% of cases likely to translate in lost sales"In case of a progressive separation between the price and the perceived product value,what would you do?% of respondents perceiving a price discrepancy45%17 %100 %25%83 %17%Perceived No reaction Reactionmisalignment15%13%10%10%9%Copyright 2016 by The Boston Consulting Group, Inc. All rights reserved.Lost salesBuy other Look for Look forGo to Renounce Trade Buy lowerluxury discounts discounts brand’sto buydown topricedbrandonlineoffline outlets topremium from same(multibrand) findbrandsbranddiscountsLost salesGoing off-price / lower priced itemsSource: BCG 2016 ad hoc study (12,000 respondents in 10 countries)BCG Altagamma True-Luxury Global Consumer Insight 2017 Edition Draft PPT v44(Storyline).pptxDraft—for discussion only2020
As a result 60 out of 230 Brands surveyed losingtraction, especially total look ones"Is there a brand on which you have the feeling that you have reduced /you will probably reduce your luxury spending?"% of brands recalled by respondents74%CategoryspecialistsCopyright 2016 by The Boston Consulting Group, Inc. All rights reserved.Lifestyle /total look100%26%Total personalluxury brandsResilientAffected byspend decrease36%19%Brands Affected byspend decreaseNote: Out of the total 12,000 respondents, 79% mentioned a luxury brand on which they reduced their spend. Total personal luxury brands include 230 brandsspontaneously recalled by respondents. Brands affected by spending decrease include those mentioned by more than 50 respondents. Possible to mentiononly one brand Source: BCG 2016 ad hoc study (12,000 respondents in 10 countries)BCG Altagamma True-Luxury Global Consumer Insight 2017 Edition Draft PPT v44(Storyline).pptxDraft—for discussion only2121
Trading down is an attitude also for beyond moneyLuxury consumers . Americans the most active"Do you have the feeling that you have partially shifted your spending from luxurybrands to premium and / or fast fashion brands?"% of respondentsBy luxury spendBy nationality7%Yes41%37%43%10%44%Copyright 2016 by The Boston Consulting Group, Inc. All rights reserved.57%81%93%No59%63%57%90%56%43%19%Total5-20 k 20-50 k 50 k Source: BCG 2016 ad hoc study (12,000 respondents in 10 countries)BCG Altagamma True-Luxury Global Consumer Insight 2017 Edition Draft PPT v44(Storyline).pptxDraft—for discussion only2222
Luxury Consumers trading down to premium brandsalmost 2x than to fast fashion ones"Do you have the feeling that you have partially shifted your spending from luxurybrands to premium and / or fast fashion brands?"% of right 2016 by The Boston Consulting Group, Inc. All rights reserved.Yes% of respondents trading down59%TotalTotalNote: Multiple options answer. In calculating the % of respondents trading down to premium and fast fashion brands, respondents trading down to bothpremium and fast fashion brands were counted twiceSource: BCG 2016 ad hoc study (12,000 respondents in 10 countries)BCG Altagamma True-Luxury Global Consumer Insight 2017 Edition Draft PPT v44(Storyline).pptxDraft—for discussion only2323
Copyright 2016 by The Boston Consulting Group, Inc. All rights reserved.More Casual, more Customized!BCG Altagamma True-Luxury Global Cons Insight 2017 Ed v69 14feb17 Final No BUP.pptxDraft—for discussion only24
Casualwear with increasing appeal vs. formalfor 2 / 3rd of True-Luxury Consumers"Has your attitude towards formal wear changed?"% of respondentsCopyright 2016 by The Boston Consulting Group, Inc. All rights reserved.34 %100 %66 %OverallNo changeperceivedin formalDecrease offormal in favorof casualSource: BCG 2016 ad hoc study (12,000 respondents in 10 countries)BCG Altagamma True-Luxury Global Cons Insight 2017 Ed v69 14feb17 Final No BUP.pptxDraft—for discussion only2525
Casualwear fuelled by wardrobe saturation for theeldest, higher appeal and acceptance for the youngest"What are the key reasons driving the lower appeal for formal wear in your mind?"OverallBy generationMillennialsEnough formal wearfor formal occasions55%Casual suitableto more occasionsFollow casualizationat the officeFormal wear nowtoo expensive48%37%29%Baby B. & Silver55%51%More comfortwith casualGen. X52%50%50%48%40%33%54%61%49%40%36%28%Copyright 2016 by The Boston Consulting Group, Inc. All rights reserved.% of respondentswith lower appealfor formal wear28%19%Note: multiple options answer (up to three reasons)Source: BCG 2016 ad hoc study (12,000 respondents in 10 countries)BCG Altagamma True-Luxury Global Cons Insight 2017 Ed v69 14feb17 Final No BUP.pptxDraft—for discussion only2626
The Luxurization of the CasualwearLuxury sneakersSneakersOther shoes9.3 Bn 0.98.42009Market @ Retail value (Bn )16.0 Bn 3.013.02016Down jacketsOther outerwear9.6 Bn 0.59.1200913.0 Bn 2.0Copyright 2016 by The Boston Consulting Group, Inc. All rights reserved.Market @ Retail value (Bn )Luxury down jackets11.02016Source: BCG Luxury market modelBCG Altagamma True-Luxury Global Cons Insight 2017 Ed v69 14feb17 Final No BUP.pptxDraft—for discussion only2727
Growing demand for customization"Is customization relevant for you when purchase luxury?"Avg.% of respondents answering "Yes"22%Avg.16 %17 %18 %20 %14%15 % 15 % 15 %13 %13 %10 %2013201420152016Copyright 2016 by The Boston Consulting Group, Inc. All rights reserved.23 % 23 % 23 %22 %Source: BCG 2016 ad hoc study (12,000 respondents in 10 countries)BCG Altagamma True-Luxury Global Cons Insight 2017 Ed v69 14feb17 Final No BUP.pptxDraft—for discussion only2828
Bespoke is the most desired feature;different customization priorities by product category"Which are the elements of customization that you value the most?"% of respondents considering each customization aspect %#3Service52%#4Made tomeasure#5Initials orwritings50%Copyright 2016 by The Boston Consulting Group, Inc. All rights reserved.#147%1st categoryby relevanceNote: multiple options answer (ranking of three reasons)Source: BCG 2016 ad hoc study (12,000 respondents in 10 countries)BCG Altagamma True-Luxury Global Cons Insight 2017 Ed v69 14feb17 Final No BUP.pptxDraft—for discussion only2929
Made-in Italy still leading, fuelled by Apparel,Bags and Shoes"Which country of manufacturing do you consider the best for luxury products?"Drivers of the increase (2014-2016)Δ 2014-2016 (pp)29%23%12%10%11 13 pp519%42014032%2016 6 pp 20 pp40%20%20142016 1 pp-3 pp-5 pp21%18%15%10%2014201620142016 10 pp 18 20162014.3% 7 pp-2 2 pp 0 pp53%2016 2 1420161. Excluding cars, luxury boats, design and lighteningSource: BCG 2016 ad hoc study (12,000 respondents in 10 countries)BCG Altagamma True-Luxury Global Cons Insight 2017 Ed v69 14feb17 Final No BUP.pptxDraft—for discussion only30Copyright 2016 by The Boston Consulting Group, Inc. All rights reserved.% of respondentsthat check Made-in130
Made-in Italy recognized worldwide, whileMade-in U.S. mainly appreciated by AmericansMade-in preference (Italy vs. US) by consumer nationalityFocus on Personal Luxury1% of respondents40%Made-inCopyright 2016 by The Boston Consulting Group, Inc. All rights reserved.30%20%Made-in10%0%1. Excluding cars, luxury boats, design and lighteningSource: BCG 2016 ad hoc study (12,000 respondents in 10 countries)BCG Altagamma True-Luxury Global Cons Insight 2017 Ed v69 14feb17 Final No BUP.pptxDraft—for discussion only3131
Copyright 2016 by The Boston Consulting Group, Inc. All rights reserved.True Luxury Consumers buying more at homeBCG Altagamma True-Luxury Global Cons Insight 2017 Ed v69 14feb17 Final No BUP.pptxDraft—for discussion only32
True-Luxury Consumers are buying more in theirhome country"Where did you buy your last luxury item?"1% of American respondentsAbroad35%Abroad35%61%Of which16%online65%Local23%Copyright 2016 by The Boston Consulting Group, Inc. All rights reserved.% of Chinese respondents"Where did you buy your last luxury item?"177%LocalOf which20%online65%39%20142016201420161. For Top 4 EU nationalities (French, German, Italian, British) local purchases from 48% in 2014 to 79% in 2016. For Japanese local purchases from 71% in2014 to 82% in 2016 2. Includes both cities where respondents bought in the last 12 months and plan to buy in the next 12 months. Multiple optionsanswer (all cities that apply) Note: Hong Kong, Taiwan and Macau included in "Abroad" Source: BCG 2016 ad hoc study (12,000 respondents in 10 countries)BCG Altagamma True-Luxury Global Cons Insight 2017 Ed v69 14feb17 Final No BUP.pptxDraft—for discussion only3333
Chinese increasingly back home to buy luxury"Where did you buy your last luxury item?"% of Chinese buying locally1Daigou Effect65%Locally(MainlandChina)High Price GapStrong Yuan30%Copyright 2016 by The Boston Consulting Group, Inc. All rights reserved.41%Government Initiatives39%(Duty Rates, Boarder Controls)Global PricingWeak Yuan20132014201520161. Hong Kong, Macau, Taiwan excludedSource: BCG 2016 ad hoc study (12,000 respondents in 10 countries)BCG Altagamma True-Luxury Global Cons Insight 2017 Ed v69 14feb17 Final No BUP.pptxDraft—for discussion only3434
True Luxury Consumers are buying more in theirhome country"Where did you buy your last luxury item?"1"Where did you buy your last luxury item?"1Top destinations for luxury shopping22015% of American TokyoLondon#2LondonTokyo#3New YorkParis#3MilanParis#4MilanNew York#4DubaiDubai#5DubaiMilan#5Hong KongMilanCopyright 2016 by The Boston Consulting Group, Inc. All rights reserved.% of Chinese respondentsTop destinations for luxury shopping21. For Top 4 EU nationalities (French, German, Italian, British) local purchases from 48% in 2014 to 79% in 2016. For Japanese local purchases from 71% in2014 to 82% in 2016 2. Includes both cities where respondents bought in the last 12 months and plan to buy in the next 12 months. Multiple optionsanswer (all cities that apply) Note: Hong Kong, Taiwan and Macau included in "Abroad" Source: BCG 2016 ad hoc study (12,000 respondents in 10 countries)BCG Altagamma True-Luxury Global Cons Insight 2017 Ed v69 14feb17 Final No BUP.pptxDraft—for discussion only3535
Copyright 2016 by The Boston Consulting Group, Inc. All rights reserved.Luxury goes OmnichannelBCG Altagamma True-Luxury Global Cons Insight 2017 Ed v69 14feb17 Final No BUP.pptxDraft—for discussion only36
Store solo sales decreasing but omnichannel thereal trend vs. online solo sales"Where have you bought your last luxury item? Where have you researched it?"% of respondents on last purchase201361%Digitally Influenced8%Digitally Influenced10%7%9%Copyright 2016 by The Boston Consulting Group, Inc. All rights resolo51% OmnichannelROPO1ShowRoomingOnlinesoloTotal21. Researched Online, Purchased Offline 2. Researched Offline, Purchased OnlineSource: BCG 2016 ad hoc study (12,000 respondents in 10 countries)BCG Altagamma True-Luxury Global Cons Insight 2017 Ed v69 14feb17 Final No BUP.pptxDraft—for discussion only3737
Digital influence growth fuelled by Americans"Where have you bought the last item purchased? Where have you researched it?"OverallBy nationalityDigitally influencedpurchases1 2016 (%)61%64%72%54%Copyright 2016 by The Boston Consulting Group, Inc. All rights reserved.( On line solo Showrooming ROPO)22 ppTrend 2013-2016(Δ pp)9 pp8 pp6 pp1. Considering the last luxury purchaseSource: BCG 2016 ad hoc study (12,000 respondents in 10 countries)BCG Altagamma True-Luxury Global Cons Insight 2017 Ed v69 14feb17 Final No BUP.pptxDraft—for discussion only3838
Millennials the most digitally influenced"Where have you bought the last luxury item purchased? Where have you researched it?"1% of respondents onlast purchaseStore soloBy generationMillennials39%32%Gen. XBaby B. & Silver42%Copyright 2016 by The Boston Consulting Group, Inc. All rights ne soloDigitally influencedpurchases (%)9%10%12%61%10%7%10%6%10%68%58%44%1. Mainly personal items ( 90%), among experiential includes wine & spirts, furniture, smartphones,.Source: BCG 2016 ad hoc study (12,000 respondents in 10 countries)BCG Altagamma True-Luxury Global Cons Insight 2017 Ed v69 14feb17 Final No BUP.pptxDraft—for discussion only3939
60% of online purchases are perceived to beadditional to physical retail purchases"Do you have the feeling that your spending online is in addition to orcannibalizing your luxury spending in physical stores?"OverallBy nationality2016online purchases19%21%22%17%In additionto Copyright 2016 by The Boston Consulting Group, Inc. All rights reserved.% of respondents177%23%1. Considering the online channel among the top 3 channels used over the last 12 monthsSource: BCG 2016 ad hoc study (12,000 respondents in 10 countries)BCG Altagamma True-Luxury Global Cons Insight 2017 Ed v69 14feb17 Final No BUP.pptxDraft—for discussion only4040
Full price multibrand eShops key for Millennials :Brands' websites and Marketplaces for the eldest"Which kind of online store did you buy the product from?"OverallBy generationMillennialsBrand owned onlinestoresFull price multi-brandonline stores(e.g. Net à Porter, Dept.Store e-commerce)Online marketplace(e.g. Amazon, TMall, JD.com)Discount specializedonline stores (e.g. Yoox)Gen. XBaby B. & ight 2016 by The Boston Consulting Group, Inc. All rights reserved.% of respondents20%7%Source: BCG 2016 ad hoc study (12,000 respondents in 10 countries)BCG Altagamma True-Luxury Global Cons Insight 2017 Ed v69 14feb17 Final No BUP.pptxDraft—for discussion only4141
Demand for an omnichannel experience is growingfast , driven by Chinese and Americans"How important is it for you that a brand can bereached through different channels?"OverallBy nationality (2016)% of respondentsNot important25%% of respondents considering omnichannel not negotiable/very 4%23%36%38%Not negotiable / 37%very important19%54%Consistent BrandImage49%Integrated Deliveryand Service Level39%Same Rewards38%Customer relationshipManagement38%Copyright 2016 by The Boston Consulting Group, Inc. All rights reserved.2014"What you would expect wheninteracting with your preferred luxurybrand through multiple channels?"151%40%39%1. Multiple options answer (ranking of three reasons)Source: BCG 2016 ad hoc study (12,000 respondents in 10 countries)BCG Altagamma True-Luxury Global Cons Insight 2017 Ed v69 14feb17 Final No BUP.pptxDraft—for discussion only4242
How effectively are Luxury Brands responding to theomnichannel expectations? (I) 100 brands includedin the analysis1Brands' satisfaction distribution (2016)Omnichannel Satisfaction Index (People mentioning as the best brand – people mentioning as the worse brand)100%Copyright 2016 by The Boston Consulting Group, Inc. All rights reserved.50%0%-50%1. Only personal luxury goods, Included only brands with statistical significant observations in total satisfactionSource: BCG 2016 ad hoc study (12,000 respondents in 10 countries)BCG Altagamma True-Luxury Global Cons Insight 2017 Ed v69 14feb17 Final No BUP.pptxDraft—for discussion only4343
How effectively are Luxury Brands responding to theomnichannel expectations? (II) 100 brands includedin the analysis1Omnichannel needsBrands' satisfaction distribution (2016)Consistent brand imageCopyright 2016 by The Boston Consulting Group, Inc. All rights reserved.Integrated deliveryand service levelSame Rewardsacross channelsCustomer relationshipmanagementSatisfaction Index21. Only personal luxury, Included only brands with statistical significant observations 2.# respondents who selected the brand as best brand –# respondents who selected the brand as worst brandSource: BCG 2016 ad hoc study (12,000 respondents in 10 countries)BCG Altagamma True-Luxury Global Cons Insight 2017 Ed v69 14feb17 Final No BUP.pptxDraft—for discussion only4444
Copyright 2016 by The Boston Consulting Group, Inc. All rights reserved.Monobrand at the heart of an omnichannel experienceBCG Altagamma True-Luxury Global Consumer Insight 2017 Edition Draft PPT v44(Storyline).pptxDraft—for discussion only45
Monobrand stores losing traffic and sales;Japan and China more resilient"Have you bought your last luxury item from a monobrand store?"OverallBy nationality (2016)% of respondents36%7%Abroad32%At 12%9%20143%2016Trend '14-'16Copyright 2016 by The Boston Consulting Group, Inc. All rights reserved.35%Source: BCG 2016 ad hoc study (12,000 respondents in 10 countries)BCG Altagamma True-Luxury Global Cons Insight 2017 Ed v69 14feb17 Final No BUP.pptxDraft—for discussion only4646
Too many stores opened in the past vs. market growthGlobal retail footprint1 growth vs. Personal Luxury Market growth (2014-2016)@ Constant Exchange Rate3x5.0%2x1.9%Copyright 2016 by The Boston Consulting Group, Inc. All rights reserved.4.0%1.6%0-1%0.0%.2014Market Growth20152016Retail Footprint Growth (Store #)1. # storesSource: BCG Analysis, "Luxury Goods Store Wars 2016" - BernsteinBCG Altagamma True-Luxury Global Cons Insight 2017 Ed v69 14feb17 Final No BUP.pptxDraft—for discussion only4747
Shopping experience and product assortment themain reasons for monobrand disaffection"Do you have the feeling that you willpurchase more or less frequently inmonobrand stores
BCG Altagamma True-Luxury Global Cons Insight 2017 Ed v69 14feb17 Final No BUP.pptx 1 Draft—for discussion only ed. The True-Luxury Global Consumer Insight