Transcription
When is the PermafrostCarbon Tipping Point?Kevin Schaefer1, Tingjun Zhang1, LoriBruhwiler2, Andrew P. Barrett1, Zhuxiao Li11NationalSnow and Ice Data Center, University of Colorado2NOAA Earth System Research Laboratory
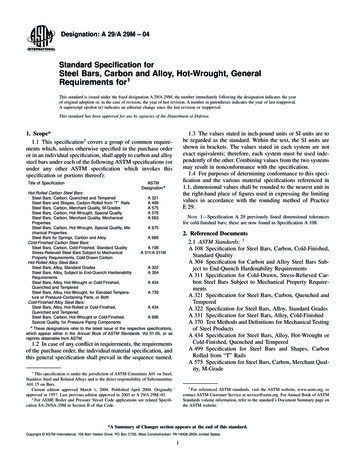
Permafrost PrimerPermafrost: Ground at orbelow 0 C for at least 2consecutive yearsActive Layer: A layer overpermafrost that freezes andthaws annuallyPermafrost Degradation: Adecrease in permafrostextent; an increase in activelayer thickness.Skiklomanov [2007]
VegetationActiveLayerPermafrost
Thermokarst: subsidence or collapse of groundsurface due to melting of ground iceThermokarst, Tibet [Zhang, 2007]Thermokarst, Alaska
Permafrost Distribution
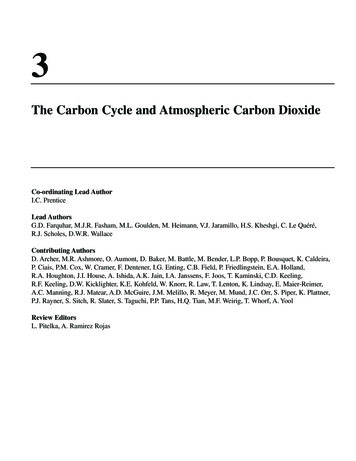
Atmosphere750 Gt 3 Gt yr-1120119Vegetation 600 GtSoils 1400 GtPermafrost 1466 Gt90886Ocean38,000 GtFossil Fuel4000 Gt
Permafrost Carbon Burial 1466 Gt C in permafrost [Tarnocai et al., 2009]Deposition (loess, peat, erosion, orizonPermafrost
Permafrost CarbonAnimalRemainsMammoth, Siberia30,000 year old roots, Siberia[Zimov et al., 2006]Primarily grassroots32,000 year old grass, Alaska
Permafrost Carbon FeedbackAmplification of warming due to release of CO2 andCH4 from thawing ericCO2 IncreasesPermafrostcarbon thawsand decays
Methane Release from Thawing PermafrostMethaneemissionPeatThaw eadplant &animalremainsBurning methane over athermokarst lake inSiberia (K. Walter)K. Walter ftkmw1@uaf.edu
Date (year)Atmospheric CO2 (ppm)
IPCC A1B Arctic TemperaturesAir Temperature ( C)CCSM3 (low warming)HadCM3 (medium warming)MIRC3.2 (high warming)Average air temperature for permafrost regions
Current Permafrost
Projected Permafrost Degradation
Cumulative NEE (Gt C)Permafrost Carbon Tipping PointPCF TippingPoint 2023 4Date (year)Arctic switches from a sink to a source
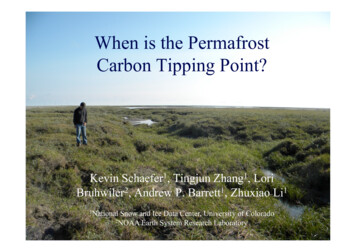
Permafrost Carbon Flux (Gt C)Cumulative Permafrost Carbon Flux104 37 Gt190 64 GtDate (year)65 23% of cumulativelandppmsink ( 160 Gt C)Equivalentglobalto 87 29
PCF and Fossil Fuel Emissions Both inject old carbon into atmosphere Both irreversible A1B scenario: 700 ppm by 2100 1345 Gt C total emissions190 Gt C permafrost carbon flux1155 Gt C fossil fuels Need a 15% allocation for permafrost carbon
Conclusions PCF tipping point in 2020s PCF is strong (190 64 Gt Cby 2200) Include PCF in emissionreduction strategies
Projected Permafrost Loss
Paleo-Permafrost Carbon FeedbackPalaeocene-Eocene Thermal Maximum (PETM)Orbit perturbations trigger Antarctic permafrost thaw[DeConto et al. 2011, in review]
Vostok Ice Core Records80 ppm CO2 lags behind temperature by 600 400 yr
WicklandSchaefer
Frost Heave, YamalStone Circles, SvalbardStone Circles, NW TerritoriesStripes, Glacier NP
Foundation Settlingin CherskyAlaska Road HeavesQinghai-Xizang Highway BridgeThermokarst in Yakutsk [Skiklomanov, 2005]
Coastal Erosion, AlaskaDrying lake, Tibet [Zhang, 2007]Rockfall, Matterhorn [Gruber, 2003]Ice-wedge thaw, Alaska [Davis, 2000]
1st WinterActive LayerFrozen1st SpringFrozenThawedPermafrostSoil contracts& cracksPolygons, Yena100th WinterCrack fills withwater & freezes100th SpringThawedIceWedgePolygons, Prudhoe Bay [Zhang, 2009]
VegetationActiveLayerPermafrostPleistocene Cryoturbation, France
Permafrost Distribution by Country
Permafrost Carbon in SiBCASAActive LayerActive LayerThickness (ALT)Dmin max ALTduring spinupPermafrostCarbon PoolDmax 3 mPermafrostActive LayerThawed CarbonPermafrostCarbon PoolSoilCarbonPoolsPermafrost 313 Gt C in permafrost carbon pool 91 Gt C in active layer 414 Gt C in top 3 m (575 Gt C estimated*)*Tarnocai et al. [2009]
Experiment Setup SiBCASA ERA40 A1B scenarioContinuous/discontinuous permafrost1973-2001: “spin up“2002-2200: random ERA40 linear trend MIROC3.2 (high)HadCM3 (med)CCSM3 (low)
Estimating Uncertainty 18 ensemble members 3 warming rates3 permafrost carbon densities2 sub-grid permafrost extents Best estimate: ensemble mean Uncertainty: ensemble standard deviation
Permafrost Area (%)Permafrost Area Loss169 54 Gt C203 63 Gt CDate (year)213 65 Gt C
Frost Heave, YamalStone Circles, SvalbardStone Circles, NW TerritoriesStripes, Glacier NP
Permafrost Carbon Tipping Point PCF Tipping Point 2023 4 Date (year) Cumulative NEE (Gt C) Arctic switches from a sink to a source . Cumulative Permafrost Carbon Flux Date (year) Permafrost Carbon Flux (Gt C) 104 37 Gt 190 64 Gt 65 23% of cumulative global land sink (Equivalent to 87 29 ppm 160 Gt C)