Transcription
Unity Q420 and Full Year 2020Shareholder Letter4 February 2021At Unity, we believe the world is a better place with more creators in it. This belief drives the fourthousand people who work at Unity to deliver our powerful technologies designed to enable thesuccess of our customers. We are driven by a recognition that when an individual becomes acreator, they become a crucial part of the vibrancy of the 21st century economy. We recognizethat the world of content is in the early stages of transition from linear 2D content to real-time3D RT3D content. Our mission, also the foundation of Unity’s business strategy, is to unlock thepower of RT3D.2020 was a year in which many people suffered loss and increased uncertainty. Our hearts goout to the many that experienced loss in the year. We are proud that we at Unity were able toprovide some of the technologies that enabled a source of distraction and joy in such achallenging year.The pace of change in 2020 accelerated across digital markets, whether that meant gamerslooking for escape, connection and entertainment or companies digitally transforming parts oftheir operations with RT3D. We are at the epicenter of these trends, working to serve ourcustomers even better in times of great change.Q420 and 2020 Results1We are pleased to report very strong results for Q420 and for our full year, which included ourfirst months as a public company. Total revenue for the fourth quarter and full year 2020reached 220 million and 772 million, representing a 39% and 43% year-over-year increase,respectively. Additionally, non-GAAP gross margin was 79% for full year 2020. With increasedscale, and meaningful operating expense savings related to COVID 19, we generated operatingleverage as compared to last year as our non-GAAP operating margin improved 600 basis pointsin the fourth quarter to 9% and 1000 basis points for the full year 2020 to 7% . On a per sharebasis our Q4 and full year 2020 non-GAAP net loss was 0.10 and 0.39, respectively.Refer to the accompanying financial tables for further details and a reconciliation of the non-GAAPmeasures presented to the most directly comparable GAAP measures.11/
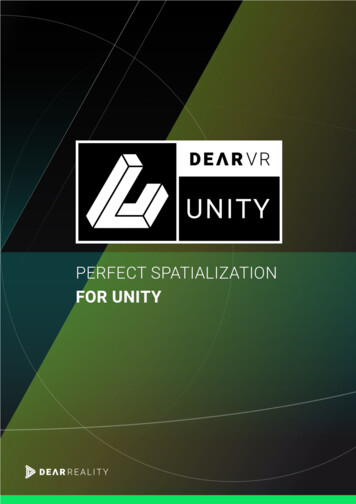
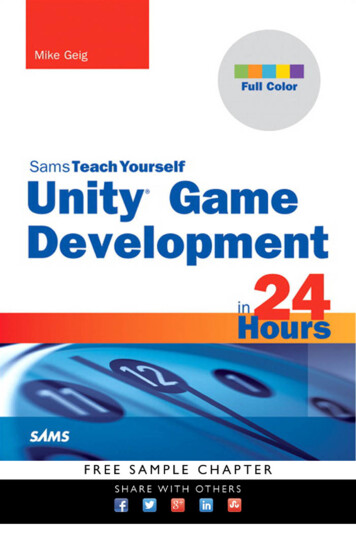
Our Dollar-Based Net Expansion Rate (“NER”) increased from 133% in Q419 to 138% in Q420,with some moderation sequentially due to the comparison to a particularly strong Q419, wherewe saw more typical seasonal growth and also implemented a number of product and algorithmimprovements within Operate Solutions. We expect NER to remain very healthy going forward, butwill vary from quarter to quarter. For 2020, customers generating more than 100,000 in trailing12-month revenue totaled 793. These customers, which increased 32% from 2019, made up 77%of our total revenue. Within this cohort, 121 customers, or 15%, generated more than 1 million intrailing 12-month revenue, an increase of 86% from 2019. Additionally, 105 of these 793customers, or 13%, were in industries beyond gaming.2/
* Dollar-based net expansion rate compares our Create and Operate Solutions revenue from the same set of customersacross comparable periods, calculated on a trailing 12-month basis as of the period end indicated. Note graph not toscale.Key Drivers of Q4 and 2020 Results Metrics that Matter: Engagement and Market Share Climb in 2020 In 2020, we saw improvement in three interrelated and revealing metrics. Games made with Unity accounted for 71% of the top 1,000 mobile games in Q4 of2020 1 . Monthly Active Users who consumed content created or operated with Unity,reached on average 2.7 billion per month in Q4 of 2020, up 63% from a yearearlier 2 . Applications built with Unity were downloaded on average 5 billion times permonth in Q4 of 2020, up 41% from last year. All three metrics set new records for us and all of them speak to the strength ofour ecosystem and the momentum in our business.1Apptopia measures Unity’s market share across the Top Grossing and Top Free games charts inthe iOS App Store and the Google Play store by taking the top 1,000 games by global MAU in thequarter, and identifying the share of games that have Unity SDK installed. As of third quarter 2020,the market share measurement was expanded from 13 countries to 58 countries and weighted bycountry player MAU. Direct comparison to figures made in earlier disclosures is no longer possiblebecause the data we previously used is no longer available. Therefore, a comparison with thefigure we presented in our Registration Statement on Form S 1 File No. 333 248255 (which was3/
2 an average of quarterly data calculated using our prior methodology) is no longer relevant.Calculated using our new methodology, in the fourth quarter of 2019, 65% of the top 1,000 mobilegames were made with Unity.We define monthly active end users as the number of unique devices that have started anapplication made with Unity, or that have requested an advertisement from Unity Ads, during thetrailing 30 days from month end. Devices tracked include smartphones, tablets, PCs, Macs, andaugmented and virtual reality devices, and exclude consoles and WebGL applications. This metricincludes end users of both our non-paying and paying creators.Create Solutions In Q4, Create Solutions revenue increased 39% year-over-year to 66.9 million.Revenue for the full year grew 37% to 231.3 million. While the first half of the year introduced some COVID 19-relatedheadwinds as game developers adapted to work from home environmentsand deal cycles slowed, the recovery we saw in late Q3 continued throughyear end. We saw growth in both gaming and new verticals. Our customers areturning to Unity to help them create and build everything in RT3D, from thenext-generation of office buildings to self-driving cars to the video gamesenjoyed by millions of people around the world.Games Ubiquity is a key driver of the success of a development platform. At Unity, wehave built our platform for the widest possible audience. Experienced coders canwork “close to the metal” while casual creators can build a game with our visualscripting interface. We have a strong and growing presence in mobile games. In Q4, games made withUnity included top selling titles such as Innersloth’s Among Us, VOODOO’s CubeSurfer! And Scribble Rider and Amanotes’ Magic Tiles 3. We expanded our presence on the next generation of consoles. For example, TheFalconeer, a game built with Unity, was a standout launch title hit for the XboxSeries X S console. Published by Wired Productions and developed by Indie solodeveloper Tomas Sala, Falconeer delivered engaging gameplay and a 120 framerate that took advantage of Xbox’s increased processing power. Also in Q4, Unity worked closely with developers to bring their creations to life onNintendo Switch. To date, over half of Switch titles are made with Unity includingtitles such as KINGDOM HEARTS Melody of Memory, Ori and the Will of the Wisps,and soon MiHoYo’s Genshin Impact.Verticals Our efforts beyond gaming gained momentum in 2020. In Q4 alone, we beganrelationships with Newell Brands, Walgreens, and Liberte Productions working forSHOWstudio and Nick Knight. We’re entering 2021 with strong momentum. In December, we highlighted Volkswagen’s innovative use of our verticalapplication, Forma, to build an engaging virtual e-commerce showroom.4/
We continue to improve applications once they are launched. In the architecturevertical, we introduced Unity Reflect in 2019, and in Q4 2020, we extended itsfunctionality to ingest files from Autodesk’s BIM 360 so that constructionengineers can access AR/VR functionality onsite on tablets, laptops andsmartphonesIn December, we launched 2020.2 TECH stream, an upgrade that gives creatorsaccess to more than 400 improvements while continuing Unity’s commitment toworkflow, stability and performance enhancements. Operate Solutions In Q4, Operate Solutions revenue increased 55% to 134.3 million. Revenue for thefull year grew 61% to 471.2 million. These results reflect strong execution, product improvements, and increased enduser engagement with games built by our customers, partially influenced bytailwinds related to COVID 19. Our Operate Solutions are aligned with the success of our customers. When ourcustomers grow their engagement with their end users, when they grow theirrevenues through the use of our monetization tools, when they increase their userengagement using our multiplayer services, they grow their usage of our services,and this drives our revenue growth. In December, Unity announced an extensive partnership with Snap Inc. thatadvanced the awareness of Unity Ads, and benefits developers with socialdiscovery and reach via Snapchat. We combined several Operate Solutions to help propel InnerSloth’s Among Us toone of the top downloaded games in 2020 according to Sensortower’s Top MobileGames Worldwide for December 2020 by Downloads listing. In October, we introduced the Game Growth Program. This is an early stage, butpromising initiative in which we apply our experience, data depth, A.I. and analyticsto help a select group of mobile free-to-play game developers optimize theirlifetime customer value in an advertising and IAP revenue share model. Shark JumpGames, makers of Castle Fusion, and Zenith Games, creators of Cartoon Crush,served as early beta testers and formally joined the program at launch. Operate Solutions also brought technical innovation to our customers in 2020. Forexample, our MatchMaker beta service launched in March 2020, and is used ingames like Fall Guys: Ultimate Knockout, Worms Rumble and Medal of Honor:Above and Beyond. MatchMaker connects game players with applicable cloudresources and is designed to ensure that players are matched appropriately for thebest play experience. Strategic Partnerships and Other Revenue Strategic Partnerships and Other revenue declined 19% to 19.1 million in thequarter and 12% to 70.0 million for the full year 2020. The quarter’s results reflect residual effects of longer deal cycles driven byCOVID 19 as well as the sunsetting of certain products within our partners'5/
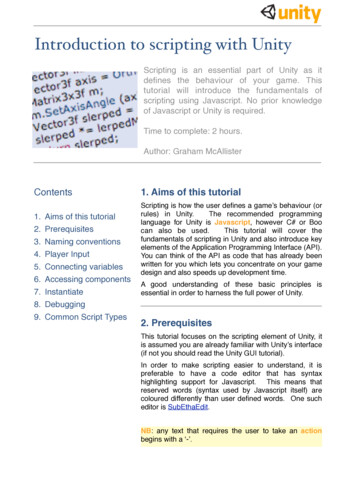
portfolios. This revenue line remains important for us, but it can be lumpyfrom quarter-to-quarter in terms of growth.2020 demonstrated the benefits of our longstanding strategic partnerships anddeep technical integrations with hardware, platform and application vendors. Forexample, on day one, applications built with Unity worked seamlessly on the SonyPlayStation 5, Microsoft’s Xbox Series X S, and across all of Apple’s new silicondevices.Finally, we continue to help our partners extend the boundaries of digitalvisualization. Our Strategic Partnership team worked closely with Microsoft on itsnew mixed reality Hololens 2 Development Edition and Azure and Pixyz forrendering 3D holographic people, places, and things.COVID 19 Impact 2020 was a highly unusual year. As the pandemic evolved from regional to global,sales cycles elongated for our Create Solutions and Strategic Partnerships as ourcustomers had to focus on provisioning their employees for a work-from-homeoperating model. By year-end 2020, our pipeline of customer opportunities within our CreateSolutions business was largely back to normal levels. Gaming and vertical industrycustomers adapted to working from home and resumed their pace of development. Shelter-in-place orders and working from home contributed to increased playerengagement from existing and new gamers, which in turn, provided a tailwind toour Operate Solutions. When we consider these factors, on a net basis, we estimate that our 2020revenue experienced a net benefit to revenue of approximately 25 million for thefull year 2020, or 3% of 2020 revenue. COVID 19 protocols and precautions also materially reduced travel and spendingon events and facilities in 2020, saving approximately 40 million in operatingexpenses, net of some reinvestment. These savings are unlikely to be repeated infuture years.Q121 and 2021 GuidanceFor Q1 and the 12 months of 2021 we are providing the following guidance:6/
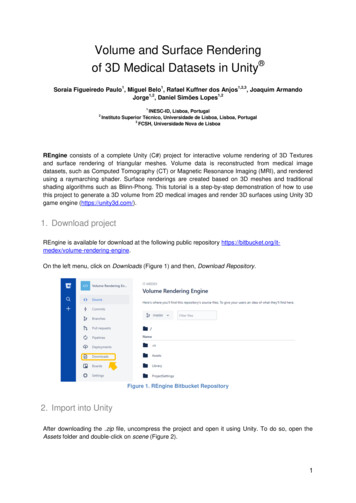
Note: Unity has not reconciled its expectations as to non-GAAP loss from operations and non-GAAP operating margin to their GAAPequivalents because stock-based compensation expense, employer tax related to employee stock transactions, and non-cashcharitable contribution expense cannot be reasonably determined or predicted at this time. Accordingly, a reconciliation is notavailable, although it is important to note that these factors could be material to Unity’s results computed in accordance withGAAP. Our goal is to build a company that delivers revenue growth of approximately 30% overthe long run. Of course, business, like life, is not linear, so it is likely that some quartersand years will be higher or lower than we expect, but even so, we believe theopportunities in front of us make such a goal achievable. We believe COVID 19, shelter in place and work from home will prove to have durableeffects on society, the way people work, and how they enjoy entertainment. For Unity,this means that gaming engagement is likely to remain elevated, and for organizationsoutside of gaming, the imperative to digitally transform, including adoption of real-time3D, will continue at an accelerated pace. When thinking about 2021 guidance, we want to level set on where we are starting theyear revenue-wise on a normalized basis. Our best estimate is that netted across our linesof business, COVID 19 boosted our revenue by approximately 25 million, or 3% ofrevenue, in 2020. We expect the arrival of Apple’s iOS14’s privacy modifications on IDFA will affect the waymobile game developers acquire customers and how they optimize lifetime customervalue. Although it’s difficult to estimate, our guidance assumes IDFA changes begin inthe spring and will reduce our revenue by approximately 30 million, or 3% of revenue,in 2021. We have long anticipated IDFA changes. We have deepened our data, analytics and A.I.capabilities and we have begun testing several new, innovative ways to help ourcustomers optimize the effectiveness of their marketing spend while complying with thechanges from the iOS 14 IDFA changes. To the extent we successfully help existing andnew customers successfully navigate and thrive in this new environment, we believewe could gain market share over time. When we combine these factors we are guiding full year 2021 revenue of 950 - 970million and first quarter revenue of 210 - 220 million. We are forecasting a non-GAAP operating loss of 30 - 40 million for our first quarterand 90 - 105 million for the full year. This would represent a non-GAAP operating lossof 14 19% and 9 11%, respectively, of forecasted revenues. We plan to continue to invest against what we believe are tremendous opportunitiesahead while also remaining on a path to free cash flow break-even by the end of 2023.7/
Financial Results OverviewNote: Numbers are rounded for presentation purposes.Fourth Quarter 2020 Financial Highlights Revenue was 220.3 million, an increase of 39% from the fourth quarter of 2019. Create Solutions, Operate Solutions, and Strategic Partnerships and Other revenue was 66.9 million, 134.3 million, and 19.1 million, respectively, an increase (decrease) of39%, 55%, and 19 %, respectively, from the fourth quarter of 2019. Loss from operations was 80.8 million, or 37% of revenue, compared to loss fromoperations of 48.6 million, or 31% of revenue, in the fourth quarter of 2019. Our fourthquarter 2020 results were impacted by an increase in stock-based compensationexpense. Non-GAAP loss from operations was 20.1 million, or 9% of revenue, compared to anon-GAAP loss from operations of 23.9 million, or 15% of revenue, in the fourth quarterof 2019. Basic and diluted net loss per share was 0.31, compared to basic and diluted net loss pershare of 0.97 in the fourth quarter of 2019. Basic and diluted non-GAAP net loss per share was 0.10, compared to basic and dilutednon-GAAP net loss per share of 0.79 in the fourth quarter of 2019. 793 customers each generated more than 100,000 of revenue in the trailing 12 monthsas of December 31, 2020, compared to 600 as of December 31, 2019. Dollar-based net expansion rate as of December 31, 2020 was 138% compared to 133%as of December 31, 2019. Net cash provided by operating activities was 14.8 million for the fourth quarter of 2020,compared to net cash provided by operating activities of 0.9 million for the same period8/
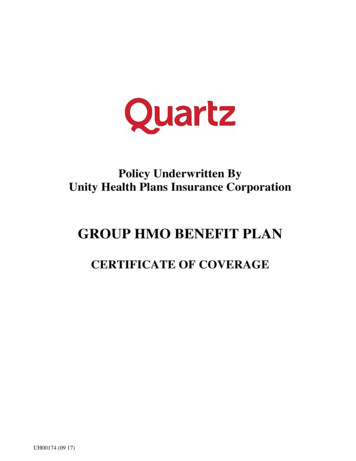
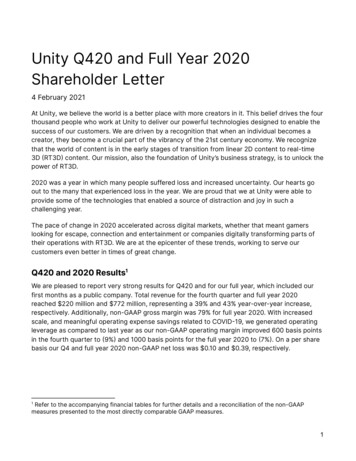
last year. Free cash flow in the fourth quarter of 2020 was 3.6 million, compared to 9.7 million for the same period last year. Cash, cash equivalents, and restricted cashwere 1.3 billion as of December 31, 2020 compared to 0.1 billion as of December 31,2019.Full Year 2020 Financial Highlights Revenue was 772.4 million, an increase of 43% from 2019. Create Solutions, Operate Solutions, and Strategic Partnerships and Other revenue was 231.3 million, 471.2 million, and 70.0 million, respectively, an increase (decrease) of37%, 61%, and 12 %, respectively, from 2019. Loss from operations was 274.8 million, or 36% of revenue, compared to loss fromoperations of 150.7 million, or 28% of revenue, in 2019. Our 2020 full year GAAP resultswere impacted by an increase in stock-based compensation expense, including aone-time charge of 47.8 million associated with the recognition of restricted stock unitexpense in connection with our initial public offering (“IPO”), as well as a charge of 63.6million related to the donation of 750,000 shares of our common stock to a charitablefoundation after the closing of our IPO in our third quarter. Non-GAAP loss from operations was 50.6 million, or 7% of revenue, compared to anon-GAAP loss from operations of 91.8 million, or 17% of revenue, in 2019. Basic and diluted net loss per share was 1.66, compared to basic and diluted net loss pershare of 2.39 in 2019. Basic and diluted non-GAAP net loss per share was 0.39, compared to basic and dilutednon-GAAP net loss per share of 1.95 in 2019. Net cash provided by operating activities was 19.9 million for 2020, compared to netcash used in operating activities of 67.9 million in the prior year. Free cash flow in 2020was 20.2 million, compared to 95.0 million in 2019.GAAP to Non-GAAP Reconciliations9/
10/
UNITY SOFTWARE INC.CONDENSED CONSOLIDATED BALANCE SHEETSIn thousands, except par value)Unaudited)As ofDecember 31,2020December 31,2019AssetsCurrent assets:Cash and cash equivalents 1,272,578 129,959Marketable securities479,406—Accounts receivable, net of allowances of 2,714 and 9,052 as ofDecember 31, 2020 and 2019, respectively274,255204,898Prepaid expenses32,02523,142Other current ting lease right‑of‑use assets103,609—Goodwill286,251218,305Intangible assets, net57,45962,034Restricted cash21,36917,137Other assets26,33318,991Total current assetsProperty and equipment, netTotal assets 2,671,225 762,860 11,303 10,706Liabilities and stockholders’ equityCurrent liabilities:Accounts payableAccrued expenses and other current liabilities106,30666,463Publisher rating lease liabilities25,375—Total current liabilities503,222336,528Long-term deferred revenue20,52310,596Long-term operating lease me and other taxes payableDeferred revenueOther long-term liabilitiesTotal liabilitiesCommitments and contingenciesStockholders’ equity:11/
Convertible preferred stock, 0.000005 par value; no shares authorized,issued, and outstanding as of December 31, 2020; 102,674 sharesauthorized, and 95,899 shares issued and outstanding as of December31, 2019—686,559Preferred stock, 0.000005 par value; 100,000 shares authorized, andno shares issued and outstanding as of December 31, 2020; no sharesauthorized, issued, and outstanding as of December 31, 902,037,143393,911Common stock, 0.000005 par value; 1,000,000 and 300,000 sharesauthorized as of December 31, 2020 and 2019, respectively; 273,537and 123,261 shares issued and outstanding as of December 31, 2020and 2019, respectivelyAdditional paid-in capitalAccumulated other comprehensive lossAccumulated deficitTotal stockholders’ equityTotal liabilities and stockholders’ equity 2,671,225 762,86012/
UNITY SOFTWARE INC.CONDENSED CONSOLIDATED STATEMENTS OF OPERATIONS AND COMPREHENSIVE LOSSIn thousands, except per share amounts)Unaudited)Three Months EndedYear EndedDecember 31,December 31,2020Revenue201920202019 220,336 158,071 772,445 ,098423,182120,00873,096403,515255,928Sales and marketing68,67748,813216,416174,135General and e in foreign currency translationadjustment29136161155Change in unrealized gains (losses) oninvestments53—53— 282,094 163,345 Cost of revenueGross profitOperating expensesResearch and developmentTotal operating expensesLoss from operationsInterest expenseInterest income and other expense, netLoss before provision for income taxesProvision for income taxesNet lossOther comprehensive income (loss), net of taxes:Comprehensive loss 83,420 50,443 0.31 0.97Basic and diluted net loss per share:Net loss per share attributable to our commonstockholders, basic and dilutedWeighted-average shares used in per sharecalculation attributable to our commonstockholders, basic and diluted272,134122,3631.66169,9732.39114,44213/
UNITY SOFTWARE INC.CONDENSED CONSOLIDATED STATEMENTS OF CASH FLOWSIn thousands)Unaudited)Three Months Ended December 31,2020Year Ended December 31,201920202019Operating activitiesNet loss 83,502 50,579 282,308 163,190Adjustments to reconcile net loss tonet cash provided by (used in)operating activities:Depreciation and Stock-based compensation expense51,1027,082134,55430,959Stock-based compensation expensein connection with modified awardsfor certain 9863,29449,420Prepaid expenses5,9583669,1319,269Other current assets2,9022,08412,9854,457Operating lease right-of-useassets5,665—23,923—Deferred tax, net1,9222,9962134,466Other assets1,7242,5241,8677,657Accounts payable1,6324142,526473Accrued expenses and othercurrent liabilities21,9359,69541,61812,432Publisher payables31,12633,14344,60520,174Income and other taxes payable21,7632,75219,52513,166Operating lease liabilities2,724—20,204—Other long-term liabilities4,4491,8398988,587Deferred 36482,453—482,453—1,644—1,644—Common stock charitable donationexpenseOtherChanges in assets and liabilities, netof effects of acquisitions:Accounts receivable, netNet cash provided by (used in)operating activitiesInvesting activitiesPurchases of marketable securitiesProceeds from principal repaymentson marketable securities14/
Purchase of 06510,51649,068575,190219,541Proceeds from revolving credit facility——125,000—Payment of principal related torevolving credit facility——125,000—Payment of debt issuance costs—3702473702,563—1,417,582—Proceeds from issuance ofconvertible preferred stock, net ofissuance costs——149,970124,918Proceeds from issuance of commonstock—104,318100,000460,200Repurchase and extinguishment ofconvertible preferred stock—100,000—148,714Purchase and retirement of treasurystock—4,208110286,375Proceeds from exercise of stockoptions9,94593125,40411,813Proceeds from exercise of stockoptions in connection withnonrecourse promissory note——8,856—7,3826711,701,455161,472Effect of foreign exchange ratechanges on cash, cash equivalents,and restricted cash492155673172Increase (decrease) in cash,cash equivalents, and 24194,446147,096273,273Purchase of property and equipmentAcquisition of intangible assetsBusiness acquisitions, net of cashacquiredNet cash used in investingactivitiesFinancing activitiesProceeds from initial public offering,net of underwriting discounts,commissions, and offering costsNet cash provided by financingactivitiesCash and restricted cash, beginningof periodCash, cash equivalents, andrestricted cash, end of period 1,293,947 147,096 1,293,947 147,09615/
UNITY SOFTWARE INC.RECONCILIATION BETWEEN GAAP AND NON GAAP FINANCIAL MEASURESIn thousands, except percentages and per share data)Unaudited)Three Months EndedYear EndedDecember 31,December 31,2020201920202019Gross profit reconciliationGAAP gross profit 167,829 128,076 600,098 423,182Add:Stock-based compensationexpenseEmployer tax related toemployee stock transactionsNon-GAAP gross profit 4,30764510,6263,19847721,117193172,613 128,723 611,841 426,573GAAP gross margin76 %81 %78 %78Non-GAAP gross margin78 %81 %79 %79Operating expensesreconciliationResearch and developmentGAAP research and developmentexpense 120,008 73,096 403,515 255,928Add:Stock-based compensationexpense23,9254,17166,03813,521Employer tax related toemployee stock transactions2,9363215,1341,643Amortization of intangibleassets expense3,1062,75612,1428,495Non-GAAP research anddevelopment expense 90,041 65,848 320,201 232,269GAAP research and developmentexpense as a percentage ofrevenue54 %46 %52 %47Non-GAAP research anddevelopment expense as apercentage of revenue41 %42 %41 %43Sales and marketingGAAP sales and marketingexpense 68,677 48,813 216,416 174,135Add:Stock-based compensationexpense8,9231,85823,7696,12416/
Employer tax related toemployee stock transactionsAmortization of intangibleassets expenseNon-GAAP sales and marketingexpense 55588884901,6041,0245,6133,07557,595 45,923 186,146 164,446GAAP sales and marketingexpense as a percentage ofrevenue31 %31 %28 %32Non-GAAP sales and marketingexpense as a percentage ofrevenue26 %29 %24 %30General and administrativeGAAP general and administrativeexpense 59,991 54,747 254,979 143,788Add:Stock-based compensationexpenseEmployer tax related toemployee stock transactionsCharitable contribution todonor-advised fundNon-GAAP general andadministrative expense14,01413,92934,19621,63790851,037482— 45,069— 40,81363,615 156,131— 121,669GAAP general and administrativeexpense as a percentage ofrevenue27 %35 %33 %27Non-GAAP general andadministrative expense as apercentage of revenue20 %26 %20 %22Loss from operationsreconciliationGAAP loss from operations 80,847 48,580 274,812 150,669Add:Stock-based er tax related toemployee stock transactions4,8763368,1762,808Amortization of intangible Charitable contribution todonor-advised fundNon-GAAP loss from operationsGAAP operating marginNon-GAAP operating margin 20,092 23,861 50,637 91,81137 %31 %36 %289 %15 %7 %17Net loss and net loss per sharereconciliation17/
GAAP net loss 83,502 50,579 282,308 163,190Add:Stock-based er tax related toemployee stock transactions4,8763368,1762,808Amortization of intangible 7,4378,671Charitable contribution todonor-advised fundIncome tax effect of non-GAAPadjustments4,4742,803Non-GAAP net loss 27,221 28,663 65,570 113,003GAAP net loss per shareattributable to our commonstockholders, basic and diluted 0.31 0.97 1.66 2.39Total impact on net loss pershare, basic and diluted, fromnon-GAAP adjustmentsNon-GAAP net loss per shareattributable to our commonstockholders, basic and diluted0.21 0.100.18 0.791.27 0.390.44 1.95Weighted-average commonshares used in GAAP net loss pershare computation, basic rage commonshares used in non-GAAP net lossper share computation, basic anddiluted272,134122,363169,973114,442Free cash flow reconciliationNet cash provided by (used in)operating activities 14,765 892 19,913 67,936Less:Purchase of property andequipment11,20010,59340,15627,035Free cash flow 3,565 9,701 20,243 94,971Net cash used in investingactivities 510,516 49,068 575,190 219,541Net cash provided by financingactivities 7,382 671 1,701,455 161,47218/
SAFE HARBOR STATEMENTFORWARD LOOKING STATEMENTSThis letter contains “forward-looking statements,” as that term is defined under federal securities laws,including, but not limited to, statements regarding Unity’s first quarter and full year 2021 outlook andfuture financial performance, including Unity’s dedication to a path to free cash flow break-even;strategies, business plans, priorities and objectives, potential market and growth opportunities, includingUnity’s goal to be a company that delivers revenue growth of approximately 30% over the long run and theachievability of that goal; product features, functionality, and expected benefits to the business and ourcustomers; competitive position; product strategies and future product and platform features;technological or market trends; and industry environment. The words “believe,” “may,” “will,” “estimate,”“continue,” “anticipate,” “intend,” “expect,” “seek,” “plan,” “project,” “looking ahead,” “look to,” “move into,”and similar expressions are intended to identify forward-looking statements. These forward-lookingstatements are subject to risks, uncertainties, and assumptions. If the risks materialize or assumptionsprove incorrect, actual results could differ materially from the results implied by these forward-lookingstatements. Risks include, but are not limited to: (i) the impact of the ongoing COVID 19 pandemic on ourbusiness, as well as our customers, prospects, partners, and service providers; (ii) our ability to achieveprofitability and the timing for any such achievement; (iii) our ability to retain existing c
Shareholder Letter 4 February 2021 At Unity, we believe the world is a better place with more creators in it. . Ultimate Knockout, Worms Rumble and Medal of Honor: Above and Beyond. MatchMaker connects game players with applicable cloud . sales cycles elongated for our Create Solutions and Strategic Partnerships as our