Transcription
Extreme Value Theory: APractical IntroductionGreg Herman
What were the odds?
What is Extreme Value Theory (EVT)? Statistical Theory concerning extreme values- values occurring at thetails of a probability distribution Society, ecosystems, etc. tend to adapt to routine, near-normalconditions: these conditions tend to produce fairly minimal impacts In contrast, unusual and extreme conditions tend to have much moresubstantial net impacts despite, by definition, occurring a muchsmaller proportion of the time. From perspective of impacts, important to be able to understand andquantify rare and extreme behavior, despite the challenges in doingso
Why do we care about EVT? Many applications throughout all realms of the atmospheric sciences Weather Quantifying extreme precipitation, streamflow, etc.Quantifying windstorm and/or tropical cyclone intensityQuantifying heat waves or cold snapsQuantifying drought Climate Quantifying any of the above in a changing/changed climate Quantifying poleward/equatorward extremes in jet positioning Chemistry Quantifying daily maximum concentrations of a harmful chemical species Lots more
Fisher-Tippett Theorem “The Central Limit Theorem of EVT” Mathematical Formulation:Consider the set of IID random variables:𝑋1 , 𝑋2 , , 𝑋𝑛Each Xi is sampled from some unknownunderlying distribution function FLet 𝑀𝑛 𝑀𝐴𝑋 𝑋1 , 𝑋2 , , 𝑋𝑛Given that certain limiting conditions𝑀aremet, namely that there exists a set of real𝑛 𝑏𝑛numbers 𝑎𝑛 , 𝑏𝑛 , 𝑎𝑛 0 such thathas a non-degenerate limiting𝑎𝑛distribution in the limit of large n (analogous to CLT requirement of underlyingdistribution having finite variance)Then: 𝑀𝑛 𝐺𝐸𝑉(𝜇, 𝜎, 𝜉)
Fisher-Tippett Theorem What does this mean? Provided your underlying probability distribution D of a randomvariable X is not highly unusual (same as with CLT, though differentconditions), regardless of what D is, and provided that n is sufficientlylarge, maxima M of samples of size n drawn from D will be distributedas the Generalized Extreme Value Distribution (GEV) (Central Limit Theorem is very similar just replace ‘maxima’ with‘mean’ and ‘Normal’ for ‘Generalized Extreme Value’)
Generalized Extreme Value Distribution (GEV) Three parameter distribution:1.2.3.Location parameter µ Shifts distribution left/rightScale parameter σ Determines ‘spread’ of distributionShape parameter ξ Determines shape of distribution, and distributionwhich it belongs𝑅𝑒𝑣. 𝑊𝑒𝑖𝑏𝑢𝑙𝑙 ξ 0ξ 0 �ξ 01𝑃𝐷𝐹: 𝑓 𝑥; 𝜇, 𝜎, 𝜉 𝑡(𝑥)𝜉 1 𝑒 𝑡(𝑥)𝜎 1𝑥 𝜇𝜉1 𝜉𝜉 0𝜎Where: 𝑡 𝑥 𝑥 𝜇 𝑒 𝜎𝜉 0family to
A note on assumptions Assumes IIDRVs Independent Each sample is independent from all other samples (big assumption!) Identically Distributed Each sample is taken from the same underlying distribution Assumes no seasonality in the time series (big assumption!) Can correct for seasonality; not always a major concern Assumes stationarity in the time series (big assumption!) Can correct for known trends Random Value sampled from a probability distribution, varies due to chance Measurements are unbiased estimators of the desired quantity
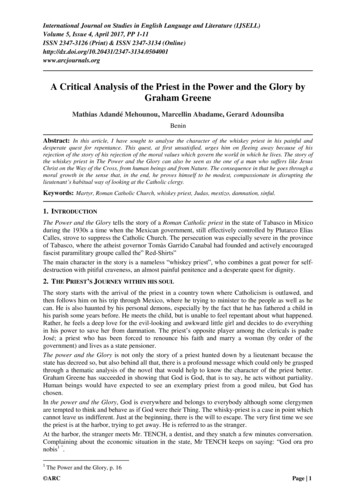
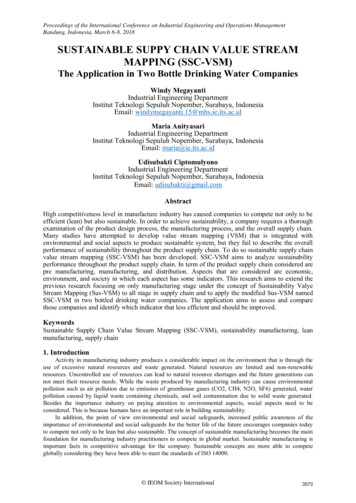
Example: Urbanization Correction
Data Issues: Ensuring data independence One approach: determine the e-folding time τ of the time seriesphenomenon being examinedAMS: Ensure that annual maximum values are separated by at least τ. Ifnot, take the block maxima of adjacent blocks with a separation of τPDS (discuss later): Require that retained exceedances of u be separated by a period of atleast τ with values less than u to be considered independent Select the maximum value within this dependent period to be retainedin the PDS
Data Issues: Insufficient Data Can derive return period threshold estimates for any arbitrarily large returnperiod The quality of recurrence interval estimates and their uncertainty isproportional/inversely proportional to the ratio of the recurrence intervalbeing estimated to the data record length With 100 years of data, expect a reasonably accurate and confident estimate of a100-year RP threshold With 5 years of data, expect a highly uncertain estimate of the 100-year RP threshold Shape parameter in particular highly sensitive to data sample Is it worthwhile? Possibly; depends on tolerance to uncertainty
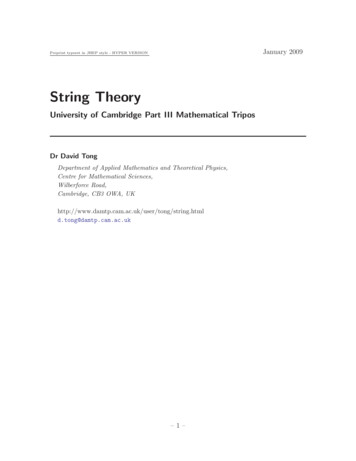
Regionalization Often in atmospheric science, have observations atmany different locations, but not for extended period(especially when dealing with observations) Can often use data from other locations to artificiallyincrease data record length Pick locations spatially distant enough so as to carryindependent information (e.g. using FNL observations forquantifying FCL extremes may or may not carry usefuladditional information not already contained in the FCL obs) Pick locations where you know, subjectively or (preferably)objectively, the climatology/underlying distribution is “closeenough” to the location of interest so that observations fromthat location may be considered random samples from theactual location of interest This can help improve estimates for event frequenciessubstantially greater than the true data record length
EVT Applications Two approaches:1.2.Block Maxima/“Annual Maximum Series” (AMS)Threshold Exceedances/“Partial Duration Series” (PDS) Block Maxima Pros: Simple to apply and interpret Cons: Framework not as often directly useful Not the most efficient use of time series Threshold Exceedance Pros: Relevant and efficient use of data Cons: Harder to implement Harder to know conditions of theory have been satisfied
Block Maxima/Annual Maximum Series What is this, and how/why would I use it? Types of questions being answered: in a given block size/(year), howlikely is an exceedance of a specified threshold? What threshold canbe expected to be exceeded, on average, once every N blocks (years)? Pick some sufficiently large block size n A typical choice for daily data is one year Take the time series you want to analyze, break it into blocks, andtake the maximum of each block to form a new series S Using a block size of one-year, this is called an Annual Maximum Series Fit a GEV distribution to S, use as desired
Example: Ozone Concentrations Suppose you are interested in how ozone concentrations in Denverwill change in a changing climate. In particular, you’re worried aboutdaily exceedances of 75 ppb, which, though rare, can cause seriousadverse health effects for vulnerable populations. Science Question: Will these exceedances get more common underclimate change, and, if so, by how much? Begin with your daily time series of maximum ozone concentrations
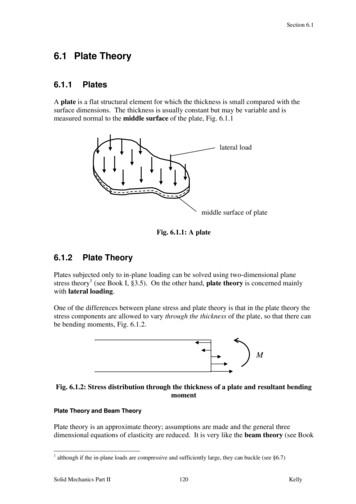
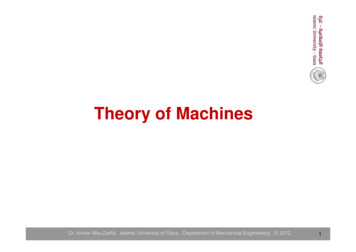
9YearAnnual Maximum DailyConcentration 4186545.252 Begin with your daily timeseries of peak average ozoneconcentrations Extract the maximum valuefrom each year This forms an AnnualMaximum Series 37528.404
Some Python Codeimport numpy #I never import numpy as npams array([ 39.7 , 38.537, 49.378, 42.7 , 42.864, 45.252,41.516, 45.201, 44.725, 40.916, 37.896, 41.268, 47.356,40.218,51.914, 39.179, 49.104, 40.688, 43.664, 57.477, 42.684,44.173, 44.981, 40.652, 40.201, 41.35 , 41.878, 43.157,37.997, 52.527, 43.606, 48.933, 44.198, 42.538, 43.774,44.679, 54.046, 43.549, 40.843, 50.97 , 38.518, 42.529,40.231, 44.136, 53.131, 41.754, 45.035, 41.678, 44.788,42.456, 42.526, 43.805, 41.547, 45.209, 41.795, 41.853,46.73 , 40.788, 42.919, 41.734, 40.532, 42.192, 43.952,39.887, 44.805, 46.045, 44.854, 44.85 , 40.341, 39.855,43.469, 45.708, 40.762, 43.631, 43.89 , 44.225, 44.269,41.822, 43.18 , 43.647, 48.838, 44.102, 46.04 , 47.115,46.64 , 46.512, 48.148, 48.624, 53.392, 50.559, 48.595,50.033, 49.847, 53.383, 50.436, 52.625, 49.836, 51.858,52.086, 50.463, 55.191, 52.52 , 53.336, 57.24 , 58.855,60.839, 58.76 , 60.757, 59.233, 70.465, 60.48 , 59.291,62.367, 62.559, 64.42 , 66.503, 64.123, 66.42 , 67.158,69.3 , 68.274, 65.359, 66.468, 66.805, 68.198, 70.874,70.485, 68.611, 67.561, 71.122, 68.86 , 69.813, 66.46 ,71.944, 69.933, 71.425, 71.682, 70.398, 69.033, 72.188,69.992, 74.937, 67.871, 65.661, 67.811])import lmoments#format per row is: [year, month, day, mda8]hist data numpy.genfromtxt('historical mda8.csv',delimiter ',')year col, month col, day col, mda8 col 0,1,2,3DAYS PER YEAR 30 31 31 #Only JJA dataNUM YEARS hist data.shape[0]/DAYS PER YEARams numpy.zeros(NUM YEARS)for i in range(0,NUM YEARS):ams[i] numpy.max(hist data[DAYS PER YEAR*i:DAYS PER YEAR*(i 1),mda8 col])
Distribution Fitting/Parameter Estimation After obtaining an AMS, ready to fit a GEV distribution to it Numerous methods of parameter estimation exist:1. Maximum Likelihood Estimation (MLE)2. Method of L-Moments (MoLM)3. Other less popular options
L-Moments Analogous to traditional moments (mean, variance, skewness, kurtosis, etc.) Linear combinations of ordered statistics (ranked values) Suppose you have a set of measurements, {X1,X2, ,Xn-1}, ordered smallest tolargest. The n’th L-Moment may be defined as:𝜆𝑛 (𝑋) 1𝑛𝑛 1𝑖 𝑛 1 1𝑖 0𝑖𝐸[𝑋𝑛 𝑖 ], where E denotes expectation For a sample of size s, the sample L-moment may be computed as:𝑠𝑛1𝑛 𝑖 1 𝑠 1𝑏𝜆𝑛 𝑋 𝑠 1𝑋𝑖𝑏 𝑛 𝑏𝑏𝑛 𝑛𝑖 1𝑏 0 Probability Distribution parameters may be described as a function of the Lmoments of the underlying distribution
Python Code, Part IIlmoms lmoments.samlmu(ams,4)[51.324696551724152, 5.9213236590038347, 0.23805132564991779,0.0062106119828451972]params lmoments.pelgev(lmoms)[46.015121694247711, 7.692054511279907, -0.10329314112117975]𝜇𝜎𝜉 Voila! Ready to use fit to answer science questions. Science Question: Assuming the climate system has been (fairly) stationary over thehistorical period, how likely is a given year to experience a 75 ppb MDA8 23786883 #The probability of exceeding 75 ppb MDA8 concentrations inDenver is about 4%
Python Code, Part III Science Question: How does this compare with the Denver annual exceedance probability (AEP) of theclimate system under RCP8.5? Simply repeat the processrcp data numpy.genfromtxt('rcp85 mda8.csv',delimiter ',')num years rcp rcp data.shape[0]/DAYS PER YEARrcp ams numpy.zeros(num years rcp)for i in range(0,num years rcp):rcp ams[i] numpy.max(rcp data[DAYS PER YEAR*i:DAYS PER YEAR*(i 1),mda8 col])rcp params lmoments.pelgev(lmoments.samlmu(rcp ams,4))[69.052504208625095, 3.8698113941111165, -0.042061272523397253](1.0-lmoments.cdfgev(75,rcp params))0.20191405324688017 #Annual Exceedance Probability 20% Under RCP8.5, Denver Annual Exceedance Probability of O3 MDA8 in excess of 75 ppb has increased from 4%to 20%
Other Questions Can answer other related questions as well. Often interested in what amountcorresponds to a prescribed frequency. What ozone concentration has a probability of being exceeded in a given year of 1% inthe historical climate? In the RCP 8.5 climate? 3912154 RCP8.5:lmoments.quagev(0.99,rcp params)88.693087373127554 The “100-year event”, at least from the AMS perspective, actually goes down* under theRCP8.5 scenario, despite the increase in frequency of 75 ppb exceedances
Threshold Exceedance/Partial Duration Series Often times, you may not be interested in the maximum values over a‘block’. Consider the ozone problem; suppose any exceedances of 75 ppb areconsidered harmful, and these may occur multiple times in a givenblock/given year, and may go several years without any events ofconcern. In these scenarios, often most interested in PDS-based EVT statistics Also often termed “Peaks-over-Threshold” (PoT) method
Pickands-Balkema-de Haan Theorem “The Second Theorem of Extreme Value Theory” The one used for threshold exceedances Again, suppose you have some random variable X, sampled from an unknownunderlying distribution F Define the conditional function Fu:𝐹 𝑢 𝑦 𝐹(𝑢)𝐹𝑢 𝑦 𝑃 𝑋 𝑢 𝑦 𝑋 𝑢 1 𝐹(𝑢) Fu describes the distribution of excesses over a given threshold u, given that thethreshold has been exceeded Pickands-Balkema states:lim 𝐹𝑢 𝐺𝑃𝐷(𝜇, 𝜎, 𝜉)𝑢 where GPD denotes the Generalized Pareto Distribution
Pickands-Balkema-de Haan Theorem What does this mean? Provided your underlying probability distribution F of a randomvariable X is not highly unusual, regardless of what F is, and providedthat the threshold u is sufficiently large, exceedances of u will bedistributed as the Generalized Pareto Distribution (GPD)
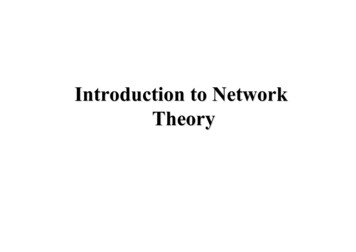
Generalized Pareto Distribution (GPD) Three parameter distribution:1.Location parameter µ Shifts distribution left/right2.Scale parameter σ Determines ‘spread’ of distribution3.Shape parameter ξ Determines shape of distribution, and distributionfamily to which it belongs𝐹𝑖𝑛𝑖𝑡𝑒 𝑇𝑎𝑖𝑙ξ 0𝐸𝑥𝑝𝑜𝑛𝑒𝑛𝑡𝑖𝑎𝑙 𝐷𝑒𝑐𝑎𝑦 𝑇𝑎𝑖𝑙ξ 0 (𝐸𝑥𝑝. 𝐷𝑖𝑠𝑡. 𝑤ℎ𝑒𝑛 𝜇 0) 𝑃𝑜𝑙𝑦𝑛𝑜𝑚𝑖𝑎𝑙 𝐷𝑒𝑐𝑎𝑦 𝑇𝑎𝑖𝑙ξ 0 𝑃𝑎𝑟𝑒𝑡𝑜 𝜎 𝜉 , 1 𝜉PDF: 𝑓 𝑥; 𝜇, 𝜎, 𝜉 1𝜎1 𝑥 𝜇𝜉𝜎1𝜉 1
Generalized Pareto Distribution- Other Properties𝜇, Valid Interval:𝜇, 𝜇 𝜉 0𝜎𝜉𝜉 0 CDF: 𝐹 𝑥; 𝜇, 𝜎, 𝜉 1 1 1𝑥 𝜇𝜉𝜎 𝜉 L-moments Estimators (l1 mean, l2 L-scale, l3 L-skewness*):1 3𝑙3𝜇 𝑙1 𝑙2 2 1 𝑙31 3𝑙31 3𝑙3𝜎 𝑙2 1 2 1 𝑙31 𝑙31 3𝑙3𝜉 1 𝑙3*𝑙1 𝜆1 ; 𝑙2 𝜆2 ; 𝑙3 𝜆3𝜆2
PDS/PoT Methods: Application Usually more relevant than AMS-based statistics Also slightly more difficult to apply Two Challenges:1.2.Selecting threshold uEnsuring data independence (1) a challenge because don’t want to choose a threshold too low, elsePickands-Balkema won’t apply. Don’t want to choose a threshold too high,or you’ll have a small sample and parameter estimates will be poor. Common choice/lower bound: lowest AMS-value in the corresponding record (oftenchoose slightly higher) (2) is a recurring problem with atmospheric data; adjacent samples in timeoften very correlated
AMS/PDS Statistics Are AMS and PDS statistics related, and, if so, how? Yes. Langbein (1949) related PDS-based average recurrence intervals(ARIs) to AMS-based annual exceedance probabilities (AEPs) throughthe simple equation: 1𝐴𝐸𝑃 1 𝑒 𝐴𝑅𝐼 Two approaches tend to converge at high return periods/rare events
Uncertainty Quantification/ConfidenceIntervals Can always do by bootstrapping (most common, I think) Analytic alternative for GEV: x(p) μ (σ/ξ) {1 [ log(1 p)]} ξ Confidence interval: Re-parameterize replacing location parameter μwith x(p) & use profile likelihood
Summary Extreme Value Theory has numerous applications throughout theatmospheric sciences and other fields Many applications (outside of hydrology) have received limited attention orare just beginning to receive attention Very general: makes few assumptions about the underlyingdistribution of the time series data Relatively easy to apply: can be performed in 10 lines of code Allows one to speak objectively and quantitatively about eventswhich tend to have the largest societal impacts
Python Code: E-Folding Time#Determine e-folding time Ti 1corrcoef sum 0DAYS PER YEAR 30 31 31NUM YEARS 145while i DAYS PER YEAR:for j in range(0,NUM YEARS):hist data part hist data[j*DAYS PER YEAR:(j 1)*DAYS PER YEAR,mda8 col]corrcoef sum numpy.corrcoef(hist data part[i:],hist data part[:-1*i])[1,0]corrcoef sum / NUM YEARSif corrcoef sum 1.0/math.e:breakcorrcoef sum 0i 1efold i#Result: efold 2 (days); corr 0.21 (corr(i 1) 0.51)
Python Code: Threshold Calculation#Determine threshold u; use minimum AMS valueams numpy.zeros(NUM YEARS)for i in range(0,NUM YEARS):ams[i] numpy.max(hist data[DAYS PER YEAR*i:DAYS PER YEAR*(i 1),mda8col])U numpy.min(ams)#Result: U 37.896
Python Code: Make Partial Duration Series#Form PDS, given U and efoldpds []mda8 vals hist data[:,mda8 col]pds ufilt mda8 vals[numpy.where(mda8 vals U)]pds inds numpy.where(mda8 vals U)[0]#Simple implementation that takes first independent exceedancelast val -1*efoldfor i in range(0,mda8 vals.shape[0]):if i last val efold:continueif mda8 vals[i] U:pds.append(mda8 vals[i])last val ipds numpy.array(pds)#Result: pds.shape[0]/NUM YEARS 22.3 (x longer than AMS series this is very high)
Python Code: Fit and Applylmoms pds lmoments.samlmu(pds,4)params pds lmoments.pelgpa(lmoms pds)
Often in atmospheric science, have observations at many different locations, but not for extended period (especially when dealing with observations) Can often use data from other locations to artificially increase data record length Pick locations spatially distant enough so as to carry