Transcription
UNDERSTANDINGCLINICAL TRIALSTATISTICSPrepared by Urania Dafni, XanthiPedeli, Zoi Tsourti
DISCLOSURES Urania Dafni has reported no conflict of interestXanthi Pedeli has reported no conflict of interestZoi Tsourti has reported no conflict of interest
KEY POINTS Randomization – StratificationSuperiority vs. non-inferiorityStopping boundariesPlanned vs. post-hoc analysisKaplan-Meier plots, mediansForest plotsWaterfall plots
STUDY DESIGN Experiments answer a scientific question by isolating theintervention and the outcome from extraneous influencesWhat are the goals? Eliminate systematic error (Bias) Minimize random error (Precision) any effect rendering the observed results not representative of the treatment effectinaccuracy of results due to samplingEnsure the generalizability of study resultsStudy Design is the methodology for achieving thesegoals eliminate bias randomization and stratification, blinding, choice of designminimize random error establish a sample size sufficient to achieve study goals
RANDOMIZATIONFundamental Principle in comparing interventions:Groups must be alike in all important aspects and only differ in the intervention each groupreceives.Randomization:Each patient has the same chance of receiving any of the study treatments.LimitationsBenefits Comparability is achieved “Similar on average” does notguarantee balanced groups Eliminates systematic bias Ethical Issues in some cases Balances both known and(usually bad designs)unknown factors Interference with doctor/patient Randomized groups arerelationship“similar on the average” Administrative Complexity
STRATIFICATION INRANDOMIZED TRIALS Overall cohort of patients is partitioned in homogeneous subgroups (strata)Patients are randomized to treatment arms within each stratumBenefits Equal allocation of strata of patientsto each treatment arm Reduction of random error(variability of effect estimates)Limitations Requires prior knowledge forpossible stratification factors Too many stratification factors leadto the opposite result (imbalanceinstead of balance)
STRATIFICATION INRANDOMIZED TRIALS Possible stratification factors:Prognostic or predictive factors, e.g.biomarker status,previous treatment,patient’s baseline characteristics Implications for analysis:Examine (stratification factor x treatment effect) interaction Significant Interaction predictive factorSeparate evaluation of the treatment effect is performed in each stratum Non-significant Interaction prognostic factor:Comparison of treatments can take place in the overall population(adjusting for the stratification factor)
SUPERIORITY VS. NONINFERIORITY TRIALSEquivalence or (Noninferiority) trialSuperiority trial“Is the new treatmentbetter than the standardone?”H0 :“No effect” or“no difference” in theclinical effect of the twotreatmentsReject H0Prove superiority“Is the newtreatment as goodas the standardone?”: equivalence limit ornon-inferiority margin(pre-specified quantity)PROOF OF EQUIVALENCEshould not be confused withFAILURE TO REJECT the null hypothesisin a superiority trialH0:“Different effect” or“difference” inthe clinical effect ofthe two treatmentsReject H0Prove equivalence ornon-inferiorityLesaffre E, Superiority, Equivalence and Non-Inferiority Trials. Bulletin of the NYU Hospital for Joint Diseases,2008; 66(2):150-4.Zee BCY, Planned Equivalence or Noninferiority Trials Versus Unplanned Noninferiority Claims: Are theyequal? J Clin Oncol, 2006; 24: 1026-1028, Reprinted with permission 2006 American Society of ClinicalOncology, All rights reserved
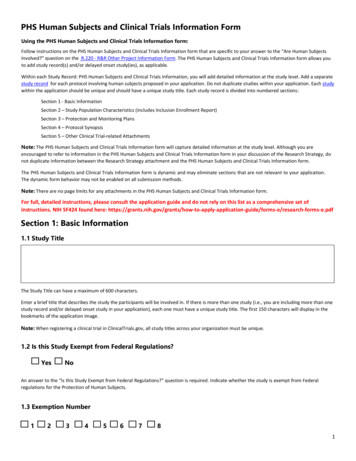
DETERMINING THE STOPPINGBOUNDARIES The Group Sequential Approach:Repeated significance testingAim: Ability to stop the trial earlier withstatistically significant conclusions withoutincreasing the type I and type II errorsWant to choose boundaries at differenttime points for interim analyses whilekeeping the overall desired type I andtype II errorsAnalysisPocockO’Brien 160.0417Critical values – nominal p-values:4 analyses, α 0.05, two-sided rulePocock / O’Brien-Fleming boundaries H0 / H1Stop andConcludeefficacyContinuePocock: performs each test at the samenominal α level (spends α evenly)O’Brien-Fleming: spends very little α duringthe initial analysis and keeps almost all of αfor later during the final analysisEaSt 6.3.1: a software package for the design and interim monitoring ofgroup sequential clinical trials, Cytel Software Corporation, Cambridge, MA,2011
SUBGROUP ANALYSIS:PLANNED VS. POST-HOC Problem ofmultiplicityAn important limitation of subgroupanalysis: performing multiple subgroupcomparisons can increase the risk of falsepositive findings.What is the difference betweenplanned & post-hoc analysis?Planned analysis is predetermined anddocumented before any exploratory dataanalysis, while post-hoc is not. Rui Wang MS, et al. Statistics in Medicine - Reporting of Subgroup,Analyses in Clinical Trials. N Engl J Med 2007; 357; 21: 2189-2194From Lagakos SW, (2006). The Challenge of Subgroup Analyses —Reporting without Distorting, N Engl J Med, 2006; 354:1667-1669,Copyright 2006 Massachusetts Medical Society. Reprinted withpermission from Massachusetts Medical Society. Why planned analysis is preferable topost-hoc?Post-hoc analysis increases the risk ofapproving drugs that have no beneficial effect(false positives), while with planned analysisone can control this error by limiting theirnumber and adjusting for multiplecomparisons.
KAPLAN-MEIER PLOTS: THE CURVETHAT CHANGED THE WORLDWhat is a Kaplan-Meier (KM) plot? Graphical tool for presenting survival Useful for comparison between groupsAdvantages Median50% of observations are below this valueIt accommodates censoring andis not influenced by outliersModel-freeTakes censoring into accountUnbiased: Censoring affectsprecision but not accuracyMedian is read directly from the plotLimitations Mainly descriptiveNo control for covariatesRequires categorical predictorsNo time-varying variablesKaplan EL, Meier P. (1958). Nonparametric estimation from incompleteobservations. J. Amer. Statist. Assn. 53:457–481.Use log-rank test to test H0:no difference betweensurvival functionsAttention: Do not over-interpret plateaus!
FOREST PLOTS: FOREST OFLINES A quick overview of multiple effect estimates from different studies or subgroupsPresentation of the relative strength (and its variation) of effects of interest Common effect estimates:Hazard Ratio,Odds Ratio,Relative Risk,Mean difference,Median survival It is used in: Meta-analysis (originally) Subgroup analysis (EMA, 2014) Presentation of multivariatemodels, Sensitivity analysis, etc.If "value of no effect" included in the CI Effect not significantCochrane Handbook for Systematic Reviews of Interventions, Part 2, Chapter 11 (Updated 2011)Lewis, S. and Clarke, M. (2001). 'Forest plots: trying to see the wood and the trees,' BMJ, 322, 1479-1480European Medicines Agency (2014). Guidelines on the investigation of subgroups in confirmatory clinical trials.
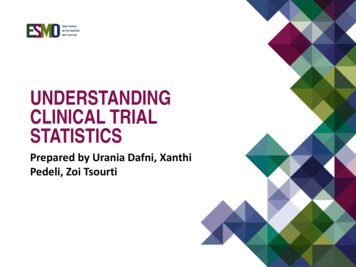
WATERFALL PLOTS A graphical illustration of a quantitative variable per subject.Commonly used in oncology clinical trials for response or treatment duration.Advantages A novel efficacy measure for presenting thereduction in tumour burden for each subject Allows for a more detailed interpretation ofstable disease as graded with RECISTLimitations Can become intractable as a visualisation toolfor large cohorts of patients Displays limited ability to portray randomizationschemes other than 1:1Example. Waterfall plot of best % change from baseline in the sum of tumour diameters for targeted lesionsThreshold Each vertical bar represents an individualpatient. Each colour represents key patient characteristice.g. objective response or smoking status. The data are organised from worst to best(based on the parameters included) resembling awaterfall.Gillespie TW, Understanding Waterfall Plots. J Adv Pract Oncol, 2012; 3(2): 106-111
Thank you!
BOUNDARIES The Group Sequential Approach: Repeated significance testing Aim: Ability to stop the trial earlier with statistically significant conclusions without increasing the type I and type II errors Want to choose boundaries at different time points for interim analyses while keeping the overall desired type I and type II errors