Transcription
Upper secondary education in Mauritius: a casestudyA. K. MaullooB. J. Naugah1
This report forms part of a collection of six case studies commissioned by the RoyalSociety in 2017 examining upper-secondary education reform in different jurisdictions.The case studies are designed to give the reader an understanding of the trends inupper secondary curriculum reform and, in particular, the recent moves that certainjurisdictions have made towards a broader and more balanced curriculum.These case studies were officially launched at the Royal Society’s symposium Broadand Balanced: What is the future for our post-16 curriculum? on 17 October, 2017.About the authorsDr Aman Kumar Maulloo is the Director of the Rajiv Gandhi Science CentreDr Jayantee Naugah is the Chairperson of the Rajiv Gandhi Science Centre Trust FundBoard since 20152
AbstractThis case study takes stock of the present post-16 STEM curriculum in Mauritius andanalyses the participation and performance of students in STEM subjects as well asassessing the role of educators and policy makers in the present education system.Data were collected through survey questionnaires, interviews and secondary sources.They were then analysed quantitatively and qualitatively, and the findings have providedan insight of the nature of the existing post-16 curriculum on students’ outcomes. Thefinancial and practical implications of the curriculum model adopted were considered inthe study. The results have indicated that there should be more emphasis on STEMsubjects and existing policies will have to be reviewed to remedy the issues that haveemerged from this study.1IntroductionThe development of a country is primarily determined by the quality of the humanresources, which is dependent on the level of knowledge, skills and attitudes. It isbelieved that a high quality of science and technology education provides the foundationfor understanding the world through specific disciplines such as biology, chemistry,physics and mathematics. Carefully designed curricula at post-16 will enable students todevelop scientific knowledge, methods, processes and uses of science and technology.This case study focuses on the main features of the post-16 STEM (Science,Technology. Engineering, Mathematics) curriculum in Mauritius, the political and policycontext behind its features, the scientific subjects and skills within it, its impact onstudent outcomes and the financial and practical implications involved. It should behighlighted that, according to relevant local institutions, similar studies have not beenconducted in Mauritius to date.1.1The education systemThe education sector in the Republic of Mauritius falls under the responsibility of theMinistry of Education and Human Resources, Tertiary Education and ScientificResearch (MOEHRTESR). This Ministry is responsible for the pre-primary, primary,secondary and tertiary education sectors as well as for Special Education Needs (SEN),and Technical and Vocational Education and Training (TVET).It is also the parent ministry for a number of parastatal bodies involved in the educationsector. The main institutions pertinent to this case study are briefly mentioned below:(i)(ii)(iii)The Mauritius Institute of Education (MIE) provides training for the preprimary, primary and secondary sectors of education, targeting all cadres,including teaching and management (MIE website). MIE has a pivotal role inthe preparation of STEM curriculum materials for grades 3 to 9 but a morelimited role for grades 10 to 13.The Mauritius Examinations Syndicate (MES) has as its main objective interalia to organise and conduct examinations locally and co-operate with otherexamination bodies, engage in relevant research, and to promote thedevelopment of a sound system of examinations (MES website).The Rajiv Gandhi Science Centre (RGSC) is responsible for the promotionand popularisation of science among the population, specially for students,through a spectrum of activities. One of its roles is to advise the Ministry ofEducation on the short and long term science education plans in Mauritius(RGSC website).3
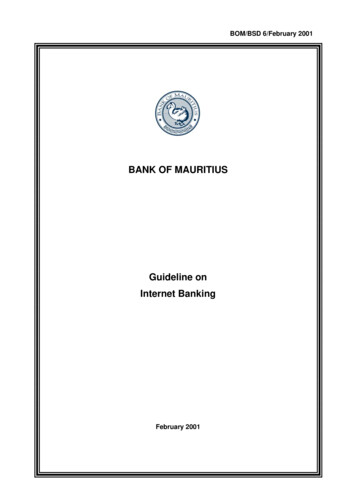
The Mauritian education system has been based on the English model of 3 6 5 2 untilthe implementation of the Nine Years Continuous Basic Education (NYCBE) (Section1.2) in January 2017.The 3 6 5 2 model is displayed in Figure 1a below. It is structured with three years ofpre-primary education (age 3-5 years), six years of primary education (age 5 – 11years), five years of secondary education leading to School Certificate (SC)examinations (age 12-16 years), and two years of optional further education leading toHigher School Certificate (HSC) examinations (age 17-18 years). Education is free andcompulsory up to age 16. While there has been a complete reform of the system fromgrades 1 to 9 (presented in Section 1.2), the model in figure 1a is still valid for grades 10to 13.Science is compulsory up to age 14 (Grade 9). At Grade 10, students choose six coresubjects including mathematics for SC examinations; science subjects are optional atthis level. The SC and HSC syllabi, examinations and markings of examination papersare carried out by the University of Cambridge International Examinations (CIE), UK,jointly with the Mauritius Examinations Syndicate (MES). Despite various initiatives,science subjects are not popular among students both at SC and HSC levels, asindicated by the statistical analysis performed in this study (see Section 4 onQuantitative Findings).4
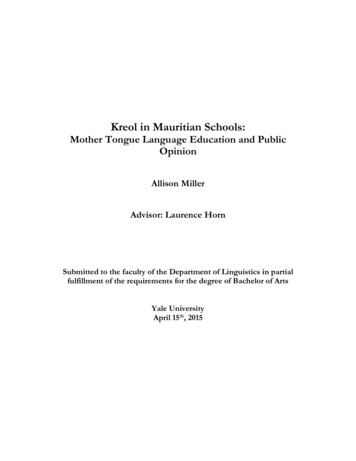
Labour MarketHigher Education4GradeSecondaryCambridge Higher SchoolCertificate (HSC)Form VI/Grade 13UpperVocational TrainingUpper SecondaryForm VI/Grade 12LowerForm V/Grade 11Cambridge School Certificate (SC)Form IV/Grade 10Form III/Grade 9Form II/Grade 8Form I/Grade 7Lower Secondary EducationPre-VocationalEducation (3 years)PrimaryGrade 6Certificate of Primary Education (CPE)Grade 5Grade 4Grade 3Grade 2Grade 1Primary EducationPre-Primary EducationPre-PrimaryFigure 1a: The Mauritian Education system until 2016(Credit: Education and Human Resources Strategy Plan 2008-2020)1.2The present educational reformsNine Years Continuous Basic Education (NYCBE, Inspiring Every Child, MOEHRTESR,2016) is an educational reform that was introduced in 2017 to replace the former systemof which, with its intense competition, resulted in a significant proportion of children notbeing adequately literate and numerate despite completing 6 years of primary schooling.An estimated 28% of students failed to complete their secondary education. This newmodel of the Mauritian education system is shown in figure 1b.In a society increasingly dominated by an accelerating pace of technology-inspiredchange, and to meet the requirements of 21st century workforce, NYCBE aims toensure that all children successfully complete the basic education cycle and then moveon to secondary education via different pathways - general, vocational or technical thus leading to tertiary education. It is also designed to equip students with relevantknowledge, skills and attitude, thus improving learning outcomes and guaranteeingsuccess in future learning.5
Figure 1b: The New Education Reform in Mauritius (as from January 2017)NYCBE is built on six major pillars, namely Curriculum Change, Innovative Pedagogies,Meaningful Assessment, Continuous Professional Development, Conducive LearningEnvironment and System Governance and Accountability. The main concept of thereform is in line with Sustainable Development Goal - SDG 4 - which is about inclusiveand equitable quality education for all and lifelong learning.Since the Mauritian Education System is based on the English one, the abovedescription clearly shows that it has a narrow-based post-16 curriculum designed andassessed by the Cambridge International Examinations (CIE) in collaboration with theMauritius Examination Syndicate (MES). In a globalised world dominated by scienceand technology, there are clear incentives to change to a broader curriculum to equipthe STEM learners with the necessary knowledge and skills to face the 21st centurychallenges.6
2Aims and objectivesThe aim of this case study is to provide an insight into the existing post-16 STEMcurriculum in the Mauritius.The five main objectives of this case study are to: Identify the main features of the post-16 STEM curriculum in Mauritius Understand the political and policy context behind the features of thecurriculum Analyse the scientific subjects and skills within the curriculum Study the impact of the broad nature of the curriculum on studentoutcomes Look into the financial and practical implications of the curriculum modeladopted3MethodologyIn order to meet the objectives set in the previous section, three concurrent methods ofdata collection were used, namely, semi-structured interviews, questionnaires andsecondary data sources. Selective sampling was utilised by hand-picking therespondents on the basis of their expertise, the time-frame and resources available forthis study. Relevant permissions were obtained from concerned authorities beforeproceeding with the study.Semi-structured questionnaires were prepared (Appendix 1), customised, andadministered to Senior Officials of the concerned organisations (MIE, MES,MOEHRTESR), as well as to educators and students attending a workshop organisedby the RGSC. There were 100 students (83% boys and 17% girls) and 16 educatorscoming from 5 schools in four different zones. Details about the educators were notcollected. The questionnaires consisted of a variety of multiple choice and open-endedquestions to grasp maximum information relevant to the study. Google Forms were usedto prepare and conduct all the surveys.Concerning the information gathered from MIE, MES and MOEHETESR, face-to-faceinterviews were held upon appointment followed by survey through the questionnaires.In some instances, the interviews were recorded with the permission of theinterviewees, then transcribed for further analysis. They were then compared with thenotes taken in parallel in all the interviews, which lasted about one hour.The forms for the survey questionnaires for educators and students were distributed toall, duly filled and collected on the same day. The process was carried out in an ethicalway (Cresswell, 2003). The surveys and interviews were held in a very objective way toremove biases and errors. Things were seen from different perspectives and thisallowed the researchers to corroborate the findings, thus, enhancing the validity of thedata, (Abdullah J et al., 2000).Secondary sources were also utilised during the study to provide an insight about theprevailing situation concerning STEM in Mauritius. The main sources have been fromthe MES, Statistics Mauritius (Statistics Mauritius website) and Education Cards(Education 2007, Education 2012, Education 2013, Education 2014, Education 2015).7
The data were analysed both qualitatively and quantitatively using Google Forms andMicrosoft Excel. Qualitative analysis was carried out by grouping the data under thetranscribed data into appropriate categories.4Quantitative AnalysisTo understand the situation in the post-16 STEM subjects, it is essential to understandthe trends from lower grades, as this has a direct impact on the post-16 outcomes andbeyond.The total enrolment in the primary schools has gradually decreased from 122,312 in1977 (Education Card, 2007) to 97,300 in 318 primary schools in 2016 (EducationStatistics 2016). In 2015, 20,434 of school candidates sat for the Certificate of PrimaryEducation (CPE) in the Republic of Mauritius with a net pass rate of 74.2%. The intakesin secondary schools have increased from 91,782 in the year 1977 to reach a peak of124,971 in 2015 followed by a sharp decline to 120,944 in 2016.4.1Intake Trends in the Mauritian Education Sector - STEMAs described earlier, students make their choice of subjects in grade 9. They areencouraged to choose up to 8 subjects including core subjects of English language,French language and mathematics and a combination of other subjects.Subjects are grouped in rigid clusters - science, technical, economics and humanities depending on various factors, and students must choose only one cluster. Students arestreamlined according to subjects and resources available at the schools; for example, ifthey opt for the technical stream, physics appears both as a science and as a technicalsubject alongside design and technology, whereas biology or chemistry are onlyavailable as science subjects in the science cluster. The inflexibility of the clusters thuslimits their choice of subjects.A sample of the options available for students is given below:CoreSubjects(To bedone byAll)1. EnglishOption 1ChemistryOptionsBiologyPhysicsOtherSubjectsAdd MathsORHinduism2. French3. MathematicsOption 2EconomicsBusinessStudiesPrinciple ofAccountsDesign andCommunicationHindiOR ComputerStudiesStudents are allowed to choose a minimum of 7 subjects and a maximum of 8 subjects(3 core either option 1 or option 2 one or two from other subjects).8
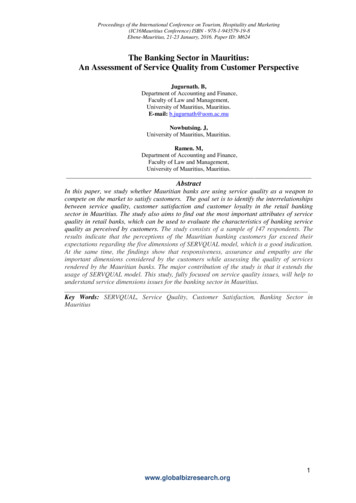
The choice made at this level is already an indication of the course of study the studentswill pursue. The system narrows down from a maximum of 8 subjects at grades 10/11 to5 subjects in grades 12/13.4.1.1Trends of Intakes at Grade 10/11The mean number of candidates examined in SC in Grade 11 is 19,543 over the pastdecade are shown in Figure 2 below.School Certificate ure 2: Intakes in Grade 10 from 2007 to 2016 (Source: MES 2017)The variation in the above Bar Chart indicates a sharp fall in the years 2013-2014. Thevariations in the intake pattern presented in this section may be due to demographicchanges. There is a correlation (excluding other factors such as repeat candidates, etc)between the birth rates in the period 1992 to 2000 (see table below) and the intakesindicated in Figure 2 above. In general, the intakes for SC for a specific year will followthe demographic pattern of children born about 15 years ago.Birth rates in Mauritius 1992 - 2000Year1992199319941995Number 22170 21667 21050 00019398Source: Statistics Mauritius: Historical Series 2015- PopulationAs for the choice of subjects in STEM in Grade 10, mathematics is compulsory. Theother subjects considered are biology, chemistry, and physics. The trends for the intakeof STEM subjects is given in Figure 3 below:9
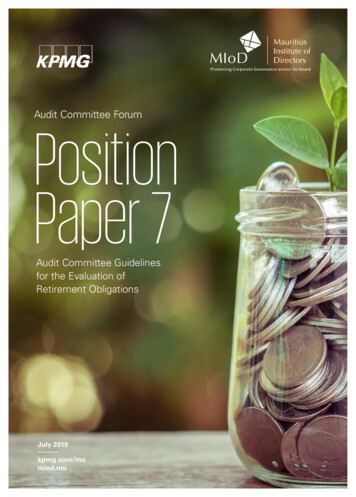
Trends in Choice of Subjects - ce For AllDesign &TechnologyFigure 3: STEM Choice in Grade 10 from 2000 to 2016Figure 3 shows declining intakes in chemistry and biology, but especially for biology.The only science subject which has remained stable is physics. With the introduction ofcomputer studies and design & technology, other science subjects, namely chemistryand biology are becoming less attractive. The rate of popularity of approximately 1.5%per annum (p.a.) for computer studies is higher than for design & technology (less than0.5% p.a.). It is interesting to observe how, in 2007, the intake for computer studiesovertook that of biology, and then overtook chemistry, in 2011, to become the mostpopular choice besides mathematics, which is compulsory.A new subject entitled 21st Century Science (Cambridge Outlook, Issue 5, 2008) wasintroduced in the SC Curriculum on a pilot basis in 2009. This subject was designed forstudents not studying science subjects and had as main objective to develop scientificliteracy for our modern society driven by science and technology. The subject titlechanged to Science for All in 2012.The syllabus (Cambridge O-Level Syllabus, Science for All, 2016) enables candidatesto: recognise the impact of science and technology on everyday life; make informeddecisions about issues and questions that involve science;understand and reflect on the information included in (or omitted from) media reportsand other sources of information.From Figure 3, it can be observed that there is a sharp decline and interest in thissubject. Only 114 candidates took part in this examination in 2016 as compared to 745when it was introduced. Presently only two private schools are offering Science for All.Feedback received from a face-to-face interview with Senior Officers of the Ministry ofEducation suggested this subject did not take off because: specialist teachers werereluctant to teach the integrated approach required by Science for All; there was aperception that it was a difficult subject; and there was a lack of resource and requiredinfrastructure to support it.10
4.1.2 Trends of Intakes at Grades 12/13The choice of subjects for HSC depends on the combination offered in the specificschools and also on the performances of the candidates at SC level.HSC 2016NUMBER OF STUDENTS102008200620042002200200Figure 4: HSC Intake for STEM subjects 2016Figure 4 indicates the number of students opting for the STEM subjects in 2016. Thegeneral paper (GP) is used as a benchmark as it is compulsory, and thus indicates thesize of the cohort. At HSC, candidates must choose 3 principal subjects (e.g.mathematics, physics, chemistry) and one subject at subsidiary level. The general paperis compulsory. Biology is the least popular subject; mathematics is most popular.HSC 2000 - 20167060%50403020100200020022004BIOLOGYDESIGN INGMATHSPHYSICS2016Figure 5: HSC trends in STEM subjectsThe trends for intakes in STEM subjects are shown in Figure 5. There is a correlation inthe trends in intakes at SC and HSC in science subjects. In-depth study is required to11
further understand these trends. Computing and design & technology have beenincluded as they are increasing in popularity and are seen as key competitor subjects totraditional STEM courses, and, as we saw from the trends in SC uptake, chemistry andbiology in particular.While physics and mathematics are more or less stable, it is clear that chemistry andbiology are on the decline. In fact, the above graphics indicate that biology is the leastpopular subject at HSC with only 472 candidates and 284 passes (MES Statistics,2016).4.1.3Enrolment by GenderThere is a gender disparity in the enrolment of science subjects at SC and HSC levels.Figure 6: Intakes of Boys and Girls in STEM at Grade 10As per the Figure 6, at SC level physics is extremely popular among boys as comparedto girls; there is a comparable number of boys and girls who opt for chemistry; biology ismore attractive to girls.A different picture emerges for intakes of science subjects at HSC level as depicted inFigure 7. Physics is more popular with boys as compared to chemistry and biology,which are more popular with girls.12
Figure 7: Intakes of Boys and Girls in STEM at Grade 12The gender disparity in science subjects appears to reflect trends in many othercountries. Further study is required to understand whether the gender disparity in thechoice of science subjects is related to the same root causes observed elsewhere orwhether there are gender issues unique to the Mauritius case.4.1.4 Enrolment in the Tertiary SectorThe tertiary education sector is overseen by the Tertiary Education Commission (TEC).As per the TEC website:“The Tertiary Education Commission has as objects to promote, plan, develop andcoordinate post-secondary education in Mauritius and to implement an overarchingregulatory framework to achieve high international quality. It also has the responsibilityto allocate government funds to the Tertiary Education Institutions under its purview andto ensure accountability and optimum use of resources. “13
Enrolment in Tertiary Education, December 2011December 42015Figure 8: Trend in enrolment in the Tertiary Education Sector (Source; StatisticsMauritius)Figure 8 shows the parabolic trend of the enrolment in the tertiary sector with a peak in2014 when the enrolment was 50,608, and then a decrease to 48,970 in 2015. 44% ofthe students are enrolled in public-funded universities and 57.7% were female.(Education Card 2015. In this distribution, 31% are enrolled in science related courses(science, engineering, manufacturing & construction, agriculture, health & welfare).4.2Performance Quality in STEMIn this section, the performances at SC and HSC are analysed for the STEM subjects.4.2.1 SC results of STEM subjectsAs per available information from the MES, the overall pass rate has constantlydecreased from 77.8 % in 2009 to 72.5% in 2015.The School Certificate results are graded from 1 to 9, where 1 & 2 are distinctions, 3 to6 represent credits, 7-8 are passes, and 9 is a Fail.Figure 9 depicts the distribution of grades at SC for main science subjects: biology,chemistry, mathematics and physics for the 2016 cohort.Overall, the general tendency in all subjects follows a similar pattern. It can be observedthat the performances of girls as compared to boys are marginally better, except formathematics where they are comparable. There are less failures for girls in chemistry,biology and physics respectively. The quality of the results is of concern as the majorityof the candidates have a credit of 5 or more. This is a general observation that fewstudents achieve excellence while the majority obtain either passes or fails. This is moreobvious in physics as shown by the high number of fails (grade 9). The dips observed inthe graphs indicate that a low percentage of students obtain grades 4 to 5 as comparedgrades 1-3 or 6-9.14
Figure 9: SC – Performance of boys and girls in STEM15
Figure 10: SC - Grade distributions in science subjectsFigure 10 represents the subject wise distribution of SC results from 2000 to 2016. Withthe objective of analysing the quality of SC the results have been grouped as follows: 13; 4-6; 7-8; & 9. Thus, the students excelling in the various subjects are having grades 1to 3. The lowest rate of failures is found in design and technology.16
Table 1: Mean SC result distribution 2000-2016Percentage of students achievingthe gradesGradeGradeGrade Grade1-34-67-8914.230.832.822.1Subject2st Century ScienceAdditional MathematicsBiologyChemistryComputer StudiesDesign & 9.115.86.523.7Physics33.62823.215.2The values in Table 1 show the average percentage of students that have achieved thegrouped results from 2000 to 2016. About 26% of students achieve grades 1 -3 whileover 47% obtain grade 7 or lower. Among the STEM subjects, the poorest results occurin biology, and the best results occur in design and technology, closely followed byphysics.Based on the SC, the students are enrolled in Lower VI if they have at least 3 credits.The Ministry of Education is presently considering revising the eligibility requirements toat least 5 credits to improve the quality of the HSC cohort.4.2.2 HSC Results of STEM subjectsIn Figure 11, the performances trend in the STEM subjects over the past decade arepresented.HSC Performance in EARBiologyChemistryMathematicsPhysicsFigure 11: HSC performance trends in STEM172016
It can be observed that the percentage of passes in mathematics, chemistry and physicsare stable at about 80% whereas biology has seen a decline and fluctuates around 60%(although, as the least popular subject, biology has a very small cohort, which mayaccount for the larger fluctuations).Figure 12: HSC grade distribution in STEM 2000-2016In Figure 12, the subject-wise distribution of HSC results is shown from 2000 to 2016.HSC results are graded as A* for excellent; A to E passed with decreasing degree ofexcellence, U for ungraded and O for ordinary level pass. To evaluate the quality ofHSC results the grades have been grouped as follows: Grade A* to Grade C areconsidered good results, then Grade D to Grade O poor results.18
Table 2: Mean HSC result distribution 2000-2016% studentsachieving thegradesGradeGradeA* - bjectBiologyChemistryComputingDesign & TechnologyMathematicsPhysicsThe data in Table 2 indicates the quality of results in HSC STEM subjects over theperiod 2000 to 2016. The average of good results was 43% (A* - C) as compared topoor results which is about 57%. Subject wise analysis indicates that the poorest resultsare obtained in biology while the best occurs in design and technology closely followedby mathematics.Comparing the quality of results for SC and HSC, we can deduce that there is a directcorrelation between the performance and SC and that at HSC. Further study is requiredto verify this hypothesis.In the existing system in Mauritius, students compete for scholarships at HSC level. Thisinfluences the students’ choice for subjects which are more scoring (Appendix 1g).5Qualitative AnalysisAs described in Section 3, surveys and interviews were carried out using purposivesampling. The results of the studies are presented in this section to meet the objectivesset in Section 2.5.1Survey among StudentsThe questionnaire administered is given in Appendix 1a. The responses obtained fromthe students are summarised in Appendix 1b.It is observed that most students surveyed found chemistry and biology difficult ascompared to mathematics and physics. They were inspired to study science for severalreasons including “understanding of the environment”, “importance in everyday life.” Itwas also noted that science teaching was deemed too teacher-oriented and there was alack of demonstrations and practicals. They stated that practicals helped them tounderstand science better. It was interesting to remark that most students used ICTtools as source of information.19
5.2Survey among EducatorsA sample questionnaire is given in Appendix 1c. The summary of responses is given inAppendix 1d.Most educators admitted that they used textbooks as a main teaching method. Theyalso stated that they use activity-based methods and integrated ICT in the teachingprocess. Teachers stated that they had access to a wide range of resources andparticipated in a number of activities to keep abreast of the latest trends in their subjectareas and they also advise students on the choice of subjects.Though students are inspired by science, the quality of the teaching may impactadversely on their choices and performances. It is also questionable whether educatorsare putting into practice active methods of teaching in the classroom.5.35.3.1Summary of interviews with relevant institutionsMauritius Institute of EducationA meeting was held with the Director and Staff of MIE conversant with STEM. Severalissues were raised about the science education system in Mauritius. This was followedby a questionnaire (Appendix 1e) circulated to all those present in the meeting. Theoutcomes of this survey are summarised in Appendix 1f.MIE has a leading role in preparing STEM curriculum for grades 7 to 9, but STEMsubjects are not addressed in depth. It should be noted that there is a lack of propercommunication among the subject areas at MIE related to STEM while preparing thecurriculum. This tends to lead to a compartmentalisation in developing curriculum thusimpacting on STEM as a holistic learning area.Teachers are trained in the delivery of the STEM curriculum through innovativepedagogical skills such as inquiry-based approach. Many educators are still to betrained as it is a matter of choice from the educator whether he/she wishes to be trained,unlike the primary sector where training is compulsory. These changes in the STEMcurriculum at grades 7 to 9 are likely to influence the choice of subjects at post-grade 9level, and it is expected that more students will learn science. There was a mixed feelingwith regards to the question of resources. Finally, MIE has a limited role and influenceon the SC/HSC level though it forms part of the Advisory committee at the MES.5.3.2Mauritius Examination SyndicateAn interview was held with the Director and Deputy Director of MES and the objectivesof the institution in the education landscape of Mauritius was explained. Information fromthe interview has been integrated into the various sections of this document.One important role of MES is the planning and organisation of national examinations atvarious milestones in the educational sector, starting with the newly introduced PSAC atend of Grade 6, for which MES prepares the examination papers in line with thecurriculum and textbooks prepared by MIE. At the end of one year compulsory preprimary education, the primary school readiness programme is applied to facilitate entryto Grade 1. Science assessment occurs in grades 4/5. At Grade 9 a nationalexamination called the National Certificate of Education (NCE) is held and the outcomesof the examination will serve for progression of students to upper secondary and20
orientation to either general or technical or vocational education (Inspiring every child,2016).At Grades 11 and 13, MES jointly with CIE organise the SC and HSC examinations forall students in Mauritius. Presently, the Government is paying the examination fees forSC and HSC subject to certain conditions that the candidates must abide to. MES isfully responsible for the timetabling (in-line with requirements of CIE). Most markings aredone in UK and the results are published through MES.MES also has an important role in the compilation of relevant statistics for allexaminations.5.3.3Ministry of Education and Human Resources, Tertiary Education and ScientificResearchAt the Ministry of Education and Human Resources, Tertiary Education and ScientificResearch, an interview was held with the Director Curriculum & Evaluation
Science is compulsory up to age 14 (Grade 9). At Grade 10, students choose six core subjects including mathematics for SC examinations; science subjects are optional at this level. The SC and HSC syllabi, examinations and markings of examination papers are carried out by the University of Cambridge International Examinations (CIE), UK,