Transcription
El Niño and La Niña: Causes and Global ConsequencesMichael J McPhadenVolume 1, The Earth system: physical and chemical dimensions of global environmental change,pp 353–370Edited byDr Michael C MacCracken and Dr John S PerryinEncyclopedia of Global Environmental Change(ISBN 0-471-97796-9)Editor-in-ChiefTed MunnThis is a US Government Work and is in the public domain in the United States of America
El Niño and La Niña: Causesand Global ConsequencesMichael J McPhadenNational Oceanic and Atmospheric Administration,Seattle, WA, USAEl Niño is a warming of the tropical Pacific thatoccurs roughly every three to seven years and lasts for12–18 months. It is dynamically linked to the SouthernOscillation, a see-saw in surface atmospheric pressurebetween the Australian–East Asian region and the easterntropical Pacific. During El Niño, the trade winds weakenalong the equator as atmospheric pressure rises in thewestern Pacific and falls in the eastern Pacific. Weakenedtrade winds allow warm surface water, normally confinedto the western Pacific, to migrate eastward. Wind-drivenupwelling, a process that brings cold water to the surfacealong the equator and along the west coasts of Northand South America, is also greatly reduced, causing seasurface temperatures to rise. Upwelled waters are richin nutrients that support biological productivity, so thatreduced upwelling adversely affects marine ecosystems andeconomically valuable fish stocks.In the atmosphere, deep cumulus clouds and heavy rainstypically occur in the western Pacific over the warmestsurface waters. As these waters migrate eastward duringEl Niño, so does the heavy rainfall. Condensation of watervapor into liquid water releases heat into the middleand upper troposphere. This heat provides a source ofenergy to drive global wind fields that extend El Niño’sinfluence to remote parts of the planet. Altered circulationpatterns produce droughts, floods, unusual storminess, heatwaves, and other weather extremes that have serious social,economic, and public health consequences. However, ElNiño can also have a positive influence on weather, such asbringing milder winters to North America and suppressingAtlantic hurricane formation.La Niña is a climatological phenomenon akin to El Niño,but with opposite tendencies in the tropical Pacific Oceanand atmosphere. La Niña is characterized by strongerthan normal trade winds and colder than normal tropicalPacific sea surface temperatures. It is also characterized byunusually high surface atmospheric pressure in the easterntropical Pacific and low surface pressure in the westerntropical Pacific in association with the Southern Oscillation.La Niña’s effects on global weather are roughly oppositeto those of El Niño. As a result, El Niño, La Niña andSouthern Oscillation are often referred to collectively as ElNiño/Southern Oscillation (ENSO), a cycle that oscillatesyear-to-year between warm, cold and neutral states in thetropical Pacific.After the disastrous 1982–1983 El Niño, which was neither predicted nor even detected until nearly at its peak,a 10-year international scientific research program wasundertaken between 1985–1994 to improve the understanding, detection, and prediction of ENSO-related variability(see TOGA (Tropical Ocean Global Atmosphere), Volume 1). New networks of moored and drifting buoys, islandand coastal tide gauges, and ship-based measurementswere initiated. Satellites provided global observations of theocean and the atmosphere. Computer models were developed to forecast El Niño and La Niña events with lead timesof up to one year. Scientific progress in these areas washighlighted during the 1997–1998 El Niño, which by somemeasures was the strongest on record. This El Niño wasmonitored day-by-day at a level of detail never before possible. In addition, early warning impending impacts, madepossible by new data and forecasting techniques led to planning efforts in some parts of the world that helped to reducethe toll the El Niño, might otherwise have taken.The strength of the 1997–1998 El Niño, the tendency formore frequent El Niño events and less frequent La Niñaevents in the past 25 years, and the prolonged 1991–1995El Niño have raised questions about the possible influence ofglobal warming on the ENSO cycle. Some recent computermodel simulations suggest that the ENSO cycle may bemore energetic in a warmer world. However, no firmconclusions can be drawn at present because models usedto simulate the interaction between global warming andENSO are limited in their ability to accurately represent keyphysical processes. Also, available data are insufficient tounambiguously establish that recent changes in the ENSOcycle are outside the range of natural variability.HISTORICAL BACKGROUNDEl Niño in Spanish means the child, with specific referenceto the Christ child. It was the name given by fishermento a warm southward flowing coastal ocean current thatoccurred every year around Christmas time off the westcoast of Peru and Ecuador. The term was later restricted tounusually strong warmings every few years that disruptedlocal fisheries, led to massive bird die offs, and broughttorrential rains to the region. These coastal warmings andepisodes of heavy rainfall have been linked by researchersover the past 40 years to much more extensive ocean warmings that occur across the width of the tropical Pacific basin(Figure 1). The term El Niño has now become synonymous with these extensive ocean warmings because of theirimpacts on global climate (Philander, 1990).El Niño is coupled to an atmospheric phenomenon knownas the Southern Oscillation, first defined by Sir GilbertWalker in the early 20th century. Walker was an Englishman who was appointed director general of observatories
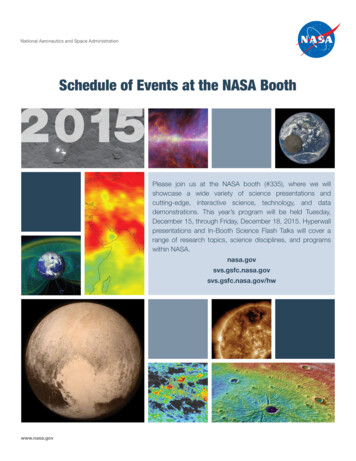
2THE EARTH SYSTEM: PHYSICAL AND CHEMICAL DIMENSIONS OF GLOBAL ENVIRONMENTAL CHANGEDecember 1990Normal30 N22242620 N10 N280 2610 S20 S22 2430 S(a) El NinoDecember 199730 N222420 N2610 N280 3010 S20 S2630 S222824(b) La NinaDecember 199830 N222420 N2610 N0 28263010 S2420 S30 S100 E(c)140 E180 140 W100 W60 WFigure 1 Monthly averaged sea surface temperature (in C) illustrating normal conditions in December 1990 (a), El Niñoconditions in December 1997 (b), and La Niña conditions in December 1998 (c)in India in 1904. He arrived in the wake of a devastating drought and famine that claimed more than a millionlives in 1899–1900. Most of the rain in India falls during the summer monsoon. When the monsoons fail, theresults can be disastrous for Indian agriculture. Walkerbelieved that summer monsoon rainfalls might be predictable, so he set out to find possible precursors, gathering weather information from all over the world. Inthe 1920s and 1930s, he published a series of papersdescribing a year-to-year see-saw in surface atmosphericpressure between the Eastern and Western Hemispheres(Figure 2). He found that when pressure was unusuallylow over the Indian Ocean region and the western tropical Pacific, it was high east of the international date linein the southeastern tropical Pacific. This situation corresponded to periods of good monsoon rains in India.When this pressure pattern was reversed, with low pressures east of the date line and high pressures west ofthe date line, rainfall was deficient not only in India,but also in neighboring countries such as Australia andIndonesia.Unfortunately, for Walker, variations in the SouthernOscillation lagged rather than led those associated withIndian summer monsoon rainfall, so that his index was
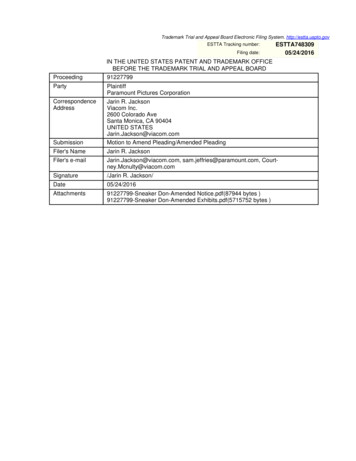
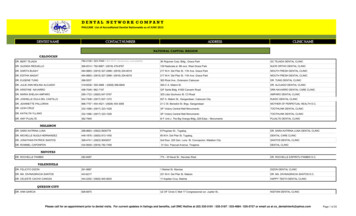
EL NIÑO AND LA NIÑA: CAUSES AND GLOBAL CONSEQUENCES2380 N0–260 200L–2L2–5 L02H40 –202–22L0–20 8L –8H264–420 –60020 40 2220 W20 EL–2–460 100 140 180 60 S0140 100 60 WFigure 2 Spatial pattern of annual mean sea level pressure anomalies associated with the Southern Oscillation. Solidcross hatching indicates regions where sea level pressure varies in phase with Darwin, Northern Australia, and lightshading indicates regions where sea level pressure varies out of phase with Darwin. Units are in correlation coefficient(ð10), for which large absolute values indicate a more consistent relationship with Darwin (Trenberth and Shea, 1987)(a)Standard deviation210 1 2Temperature ( C) 332Southern oscillation indexTemperature anomalies(5 N 5 S, 90 W 150 W)10 1(b)190019201940196019802000YearFigure 3 (a) SOI, which is a normalized difference between Tahiti, French Polynesia minus Darwin, Australia surfaceair pressure, after typical seasonal variations have been subtracted out. Periods of SOI greater in magnitude than 0.5are shaded to emphasize the relationship with El Niño and La Niña episodes. Low SOI is associated with warm seatemperatures (El Niño), and high SOI with cold sea temperatures (La Niña). (b) Sea surface temperature anomalies (thatis, deviations from normal) for the region 5 N – 5 S, 90 W – 150 W from 1900 – 1999. Positive anomalies greater thanabout 0.5 C indicate El Niño events. Negative anomalies less than about 0.5 C indicate La Niña events
4THE EARTH SYSTEM: PHYSICAL AND CHEMICAL DIMENSIONS OF GLOBAL ENVIRONMENTAL CHANGEnot useful for monsoon predictions. Curiously, he alsofound that the low index phase of the Southern Oscillationwas correlated with warm winters over Canada and dryconditions in parts of South Africa. His work was met witha great deal of skepticism though because he could notprovide a physical explanation for the observed connectionsbetween the Southern Oscillation and climatic variations inwidely separated parts of the globe. This skepticism wasevident in his obituary, published in the Quarterly Journalof the Royal Meteorological Society (1959, p. 185):Walker’s hope was presumably not only to unearth relationsuseful for forecasting but to discover sufficient and sufficientlyimportant relations to provide a productive starting point fora theory of world weather. It hardly seems to be working outlike that.Ironically, Walker died in 1958 during the 1957–1958International Geophysical Year (IGY), the first truly international scientific study of the global oceans, atmosphere, andsolid earth (see IGY (International Geophysical Year),Volume 1). Intensive measurements were being undertakenin a coordinated effort to better understand the processesinvolved in shaping the global environment. As fate wouldhave it, 1957–1958 coincided with a strong El Niñoevent. Measurements from the various observing systemsdeployed during the IGY stimulated Jacob Bjerknes toexamine how interactions between the ocean and the atmosphere in the tropical Pacific could affect weather patterns(see Bjerknes, Jacob, Volume 1). Bjerknes was a Norwegian meteorologist who emigrated to the US just beforeWorld War II. He had established his reputation in the earlypart of the century by making fundamental contributions tothe understanding of fronts and weather systems at middleand high latitudes. Using IGY data in the 1960s, Bjerknes would be the first to identify the relationship betweenEl Niño and the Southern Oscillation, to propose physicalmechanisms by which they might interact, and to describesome of the effects of El Niño on North American weather.The close connection between El Niño and the SouthernOscillation over the past 100 years can be seen in the stronginverse relationship between two commonly used indicators(Figure 3). The Southern Oscillation index (SOI) is basedon departures from normal of surface atmospheric pressureat Tahiti, French Polynesia, and Darwin, Northern Australia.The difference of Tahiti minus Darwin pressure provides ameasure of the pressure force that drives the trade windsacross the Pacific basin. When this index is negative (lowpressure at Tahiti relative to Darwin), the trade winds areweak. When the index is positive, the trade winds arestrong.A commonly used index for El Niño is the areal averagedsea surface anomaly (i.e., deviation from normal) in theBox 1 El Niño and La Niña, Past and PresentEl Niño and La Niña events generally last 12 – 18 months,and tend to be most fully developed during the Northern Hemisphere winter season. Thus, they often spantwo calendar years. Commonly used indices like thosein Figure 3 show that El Niño events over the past50 years occurred in 1951, 1953, 1957 – 1958, 1963,1965 – 1966, 1969, 1972 – 1973, 1976 – 1977, 1982 – 1983,1986 – 1987, 1991 – 1995 and 1997 – 1998. La Niña eventsof the past 50 years occurred in 1949 – 1950, 1955 – 1956,1964, 1970 – 1971, 1973 – 1975, 1988 – 1989, 1995 – 1996and 1998 – 2000. Weak cold events also occurred in1967 – 1968 and 1984 – 1985, but these were not accompanied by positive values of the SOI.Instrumental records available for identifying El Niñoand La Niña years prior to the mid-19th century are verylimited. However, it has still been possible to identify ElNiño events in the distant past using anecdotal historicalinformation from the reports of early explorers andsettlers in those areas bordering the Pacific where inmodern times El Niño consistently affects weather andclimate. Quinn et al. (1987) produced a chronology of ElNiño events going back to 1525 using historical reports ofconditions from the coastal region and adjacent watersof northwestern South America. Their work suggests,e.g., that Francisco Pizarro’s conquest of the Incas in1531 – 1532 coincided with an El Niño event. Heavyrains and swollen rivers, which typically occur onlyduring El Niño years in Peru, delayed Pizarro’s advancethrough the countryside. On the other hand, the samerains produced abundant vegetation, providing plentifulfodder for his horses, which were one of the chief tacticaladvantages (along with swords) that his small contingentof soldiers had over the natives.Quinn (1992) extended this El Niño chronology backto 622 AD using maximum yearly Nile River flow dataat Cairo, and related historical information on Africandroughts, floods, plagues and famines. Careful recordsof Nile stream flow were kept because it formed thebasis of Egyptian agriculture for thousands of years. Thestream flow records reveal year-to-year changes that canbe related to variations in summer monsoon rains overthe highlands of Ethiopia. These rains, and the streamflows they feed, are typically reduced in El Niño years.It is possible to extend the record of ENSO timescale variations even further back in time by developingclimate reconstructions using proxy data from treerings, laminated lake sediments, glacier ice cores andtropical Pacific corals. These proxies preserve year-byyear records of environmental parameters related tophysical climate, such as temperature, precipitation, orrainwater runoff. The relevant climate information isencoded in the chemical and isotopic composition ofcoral skeletons, the water content and chemistry ofice cores, the thickness and grain sizes of sedimentlayers, and the thickness and density of tree rings.Properly calibrated against modern instrumental records,proxy data allow investigations on ENSO-related climatevariability to extend many thousands of years into thepast.
EL NIÑO AND LA NIÑA: CAUSES AND GLOBAL CONSEQUENCESregion 5 N to 5 S, 90 W to 150 W. Large positive valuesof this index define warm El Niño conditions, while largenegative values indicate cold La Niña conditions. It isevident that the warm surface temperatures are stronglylinked to weak trade wind (negative values of the SOI)and vice versa. These indices show that the 1982–1983 ElNiño and the 1997–1998 El Niño were the strongest of the20th century.El Niño events exhibit some common characteristics(such as unusually warm sea surface temperatures andweak trade winds in the tropical Pacific) that allow themto be classified as a distinct phenomenon (see Box 1).However, they often differ among themselves in duration, intensity and in the details of their development.No two El Niños are exactly alike, and the same is trueof La Niña events. Thus, the ENSO cycle displays adegree of irregularity for which there is yet no simpleexplanation.5Normal conditionsWalker circulationEquatorThermocline120 E80 WEl Niño conditionsEL NIÑO PHYSICS AND THE ENSO CYCLETo understand El Niño, we must first understand what isconsidered normal. Sunlight reaching the Earth’s surface ismore intense in the tropics than at higher latitudes, so thatthe warmest ocean temperatures are found near the equator. Air masses over warm tropical waters extract heat andmoisture from the ocean, expand, become less dense thansurrounding air, and ascend to higher altitudes. The rising air cools and condenses, producing towering cumulusclouds and heavy precipitation through a process referred toas deep convection. At upper levels of the troposphere (thelowest 10–12 km of the atmosphere affected by weather)these air masses flow poleward, then sink in regions of highsurface pressure over the subtropical oceans of the Northernand Southern Hemispheres. The rising tropical air massesin turn are fed by air drawn in towards the equator near thesurface from the subtropical high-pressure zones. This circulation cell on the meridional plane is called the Hadleycirculation in honor of George Hadley, an 18th centuryBritish meteorologist who was the first to provide a theoretical explanation for it (see Hadley Circulation, Volume 1).The equatorward flowing surface air masses are deflectedwestward because of the rotation of the Earth about itsaxis (the Coriolis effect). The result is easterly tradewindsystems in the Northern and Southern Hemispheres. Thenortheast and southeast trade winds meet in the Intertropical Convergence Zone, situated on average about five to tendegrees of latitude north of the equator in the Pacific. This isa region of deep convection, cumulus cloud formation, andheavy rainfall that comprises the ascending branch of theHadley circulation. A second zone of converging surfacewinds, the South Pacific Convergence Zone, is on averagelocated several degrees south of the equator in the westerntropical Pacific.EquatorThermocline120 E80 WFigure 4 Schematic of normal and El Niño conditions inthe equatorial PacificAlong the equator, the trade winds normally drive surfaceflow westward in the south equatorial current (Figure 4).This current piles up the warm surface water in the westernPacific, and drains it from the eastern Pacific. The thermocline, which is the sharp vertical temperature gradientseparating the warm surface layer from the cold deep ocean,is pushed down to a depth of 150 m in the west, but shoalsto 50 m depth in the east. Sea level tends to mirror thermocline depth since water expands when heated. Thus, whilethe thermocline tilts downward towards the west along theequator, sea level rises to the west where it stands about60 cm higher than in the eastern Pacific.The relative shallowness of the thermocline in the eastern Pacific facilitates the upward transport of cold interiorwater by the trade winds, and a cold tongue develops insea surface temperature from the coast of South Americato near the international date line. The east–west surfacetemperature contrast reinforces the easterly trade winds,since low atmospheric surface pressure is associated withwarm water in the west and high surface pressure with
6THE EARTH SYSTEM: PHYSICAL AND CHEMICAL DIMENSIONS OF GLOBAL ENVIRONMENTAL CHANGEBox 2 Equatorial WavesOne early theory for El Niño postulated that the windsblowing equatorward off the west coast of SouthAmerica weakened during an El Niño event, so thatcoastal upwelling would be reduced and sea surfacetemperatures would rise. However, Klaus Wyrtki, anoceanographer at the University of Hawaii, demonstratedin the mid-1970s that winds along the coast of SouthAmerica actually strengthened during El Niño (Wyrtki,1975). He found instead that weakening of the tradewindsthousands of kilometers to the west in the centralPacific was related to the development of El Niñoalong the coast of South America some months later.Based on these results, Wyrtki suggested that large scaleequatorial ocean waves were the mechanism by whichwind variations in the central Pacific could lead to theonset of El Niño in the eastern Pacific.Two classes of oceanic waves are important forunderstanding the cycle of El Niño and La Niña variations.One class is referred to as Kelvin waves, namedafter Lord Kelvin (William Thompson), a 19th centuryBritish physicist who was the first to theoreticallypredict such waves in rotating fluids. The other classis referred to as Rossby waves, named after CarlGustaf Rossby, a Swedish-born meteorologist who incooler water in the east. Also, as the trade winds flowfrom east to west, they pick up heat and moisture fromthe ocean. The warm, humid air mass becomes less denseand rises over the western Pacific warm pool where deepconvection leads to towering cumulus clouds and heavyprecipitation. Ascending air masses in this region of deepconvection return eastward in the upper levels of the troposphere, then sink over the cooler water of the EasternPacific. Bjerknes labeled this atmospheric circulation pattern on the equatorial plane the Walker circulation inhonor of Sir Gilbert Walker (see Walker Circulation, Volume 1).Upwelling is a key oceanic process that regulates seasurface temperatures along the equator and along muchof the west coast of the Americas. Wind-driven surfacecurrents flow to the right of the winds in the NorthernHemisphere and to the left of the winds in the SouthernHemisphere because of the Coriolis force. Easterly tradewind-driven currents therefore flow poleward in oppositedirections near the equator in the Northern and SouthernHemispheres. This divergent surface flow is fed from belowby upwelled thermocline water to create the equatorial coldtongue (Figure 1). A similar process operates off the westcoasts of the Americas. Equatorward winds on the easternflanks of subtropical high-pressure systems drive surfacewaters offshore. These offshore flows are fed from belowby cooler thermocline waters, which then lower coastal seasurface temperatures.During El Niño, the trade winds weaken in the westernand central equatorial Pacific as atmospheric pressure risesthe 1930s first discovered this kind of wave in theatmosphere (see Rossby Waves, Volume 1; Rossby, CarlGustaf, Volume 1). Both types of wave are generated inthe equatorial ocean by large-scale variations in surfacewinds.Kelvin waves propagate eastward along the equatorand Rossby waves propagate westward. They are evidentbelow the surface as undulations of the thermocline,causing it to rise and fall by tens of meters as the wavespass by. Equatorial waves also affect sea level and theintensity and direction of ocean currents. The Earth’srotational forces trap these waves within several hundredkilometers of the equator in the open ocean, so theytransfer energy very efficiently over many thousands ofkilometers in the east – west direction.Kelvin waves take about two months to cross thePacific basin and Rossby waves take about six monthsto cross. When they reach the landmasses at the easternand western boundaries of the ocean, they reflect backinto the interior and, in the case of Kelvin waves, leakenergy to higher latitudes along the west coasts ofthe Americas. The life cycle of these waves, evolvingover many months and seasons in response to changingwinds, are a critical aspect of ocean dynamics controllingthe evolution of El Niña and La Niña events.in the west and falls in the east (Figure 4). Weakened tradewinds generate waves in the ocean interior, which radiatealong the equator both to the east and to the west away fromthe region of wind forcing (see Box 2). Over the course ofa few months, these waves elevate the thermocline in thewest and push it down in the east. In the cold tongue region,depression of the thermocline leads to surface warming asequatorial upwelling can no longer efficiently tap into thecold water reservoir below. Westward flow in the southequatorial current also weakens and reverses when the tradewinds relax, allowing the western Pacific warm pool tomigrate eastward. Sea level drops in the west and rises inthe east in response to the redistribution of warm surfacewaters.As sea surface temperatures warm east of the date line,the pattern of deep convection and precipitation also shiftseastward. This reinforces the reduction in trade wind intensity, because westerly winds flow into the convective centerfrom the west. Pressure continues to fall in the east and risein the west as the region of convection and rainfall migrateseastward. The system becomes locked in a positive feedbackloop, with warming surface temperatures leading to weakened trade winds and vice versa. This positive feedback iseventually broken when the oceanic waves that elevated thethermocline in the western Pacific at the onset of the eventbounce off the land masses bordering the western Pacific andreflect back toward the east. As the reflected waves propagateeastward along the equator, they elevate the thermocline andinitiate surface cooling. Cooler surface waters in the easternPacific increase the east–west atmospheric pressure gradient
EL NIÑO AND LA NIÑA: CAUSES AND GLOBAL CONSEQUENCESand the strength of the trade winds, which in turn reinforcessurface cooling through intensified upwelling. These interactions between the ocean and the atmosphere terminateEl Niño typically 12–18 months after its onset. The oceanreturns to near normal conditions, or it may overshoot into acold La Niña state.While El Niño involves an intimate coupling of the atmosphere and the ocean, the two fluids respond to each otheron very different time scales. The atmosphere is a thousandtimes less dense than the ocean, and therefore respondsalmost immediately to forcing from the ocean surface. Theocean is massive by comparison, so its dynamical responseto atmospheric forcing is relatively sluggish. For example,thermocline depths may take many months to adjust tochanging winds in the tropics, whereas atmospheric convection can develop within hours over warm surface water.It is the slow evolution of the upper ocean thermal field thatprovides the memory for the climate system in the tropicalPacific, and it is this thermal inertia that provides the basisfor predictability of ENSO time scale variations.7EL NIÑO WEATHER IMPACTSOne impact of the eastward shift in rainfall along theequator during El Niño is that drought develops in Australia, Indonesia and neighboring countries. On the otherhand, the island states of the central Pacific and the westcoast of South America are inundated with heavy rains.Heavy rainfall bands normally situated north and south ofthe equator in the Intertropical Convergence Zone and theSouth Pacific Convergence Zone also shift equatorward assurface waters warm. These latitudinal shifts contribute tounusually heavy rains near the equator in the central andeastern Pacific, and to drought conditions at higher latitudesin regions such as New Caledonia and Fiji to the south, andHawaii to the north.Heat released into the troposphere from deep tropicalconvection is one of the principal driving forces for theglobal atmospheric circulation. Changes in the locationof tropical heat sources during El Niño therefore lead towidespread changes in wind and weather patterns outsideNPH0LL30 N0H180 W160 W140 W10 N100 W120 WEquatorH0LFigure 5 Schematic diagram of the PNA pattern of middle tropospheric pressure anomalies during Northern Hemispherewinter coinciding with an El Niño event. Dark arrows indicate strengthening of the subtropical westerly jet streams and,along the equator, weakening of the upper branch of the Walker circulation. Lighter arrows depict mid-tropospheric flowsas distorted by the anomalous high and low pressure patterns. Rainfall and cloudiness are enhanced over the shadedregion near the equator (Horel and Wallace, 1981)
8THE EARTH SYSTEM: PHYSICAL AND CHEMICAL DIMENSIONS OF GLOBAL ENVIRONMENTAL CHANGEPacific Northwest and southern Canada, so that much ofCanada and the northwestern US tend to experience mildwinters. Low pressure in the southeastern US associatedwith the PNA pattern brings wetter, cooler conditions to thestates bordering the Gulf of Mexico. Similar wave trains areexcited in the Southern Hemisphere, but they are weakerand more variable than those in the north.Teleconnections also affect the subtropical jet streamswhich are swift air flows girdling the Earth at altitudescentered between about 10 000 m and 12 000 m (see Teleconnection, Volume 1). The eastward migration of deepconvection during El Niño causes the core of these jetstreams to intensify and shift southeastward in the centraland eastern Pacific (Figure 5). The jet streams are a majorinfluence on the location of storm tracks, so that southernCalifornia and northern Chile typically experience stormierthe tropical Pacific. These remote effects of El Niño arereferred to as teleconnections. In the extratropics, teleconnections are usually most pronounced during the winterseason, though they are detectable in other seasons as well.Anomalous tropospheric heating in the central tropicalPacific during El Niño generates quasi-stationary atmospheric wave trains that radiate poleward and eastward.In the Northern Hemisphere, these waves set up thePacific North American Teleconnection Pattern, or (PNA)pattern, which is a series of high- and low-pressure centers extending from the central North Pacific to NorthAmerica (Figure 5). During El Niño, the Aleutian low pressure center over the North Pacific deepens, high pressuredevelops over western North America, and low pressureprevails over the southeastern US. These pressure changessteer warmer air masses from southern latitudes into theEl Niño weather patterns December–February70 NWarm50 NWarmWarmWarmWetDryWet & CoolWetDryWet & WarmDry&Warm10 SDryWarm60 E10 NWarmWet0 30 N120 E30 S50 S180 120 W6
are shaded to emphasize the relationship with El Ni no and La Ni na episodes. Low SOI is associated with warm sea temperatures (El Ni no), and high SOI with cold sea temperatures (La Ni na). (b) Sea surface temperature anomalies (that is, deviations from normal) for the region 5 N-5 S, 90 W-150 W from 1900-1999. Positive anomalies .