Transcription
Childhood Healthy Weight Action Plan for Darlington 2017 – 2022DarlingtonChildhood Healthy Weight Plan2017 – 2022Version 51
Childhood Healthy Weight Action Plan for Darlington 2017 – 2022ContentsPageVision3Aim3Objectives3Key Messages4Introduction5Epidemiological Assessment of Need9North East Regional Childhood Obesity13Findings from the Healthy Lifestyle Survey in Darlington)17TO TRANSFORM THE ENVIRONMENT SO THAT IT SUPPORTS HEALTHY LIFESTYLESUnderstanding and Adapting the Obesogenic Environment18Out of Home Food Provision20Access to Green Space23Active Travel25Action Plan262
Childhood Healthy Weight Action Plan for Darlington 2017 – 2022VISIONDarlington is to increase the proportion of children leaving primary school aged 10-11 years (Year 6)with a healthy weight. This will be achieved by developing a whole systems approach to tacklingchildhood obesity. Darlington will ensure the healthy weight agenda is integrated in other relevantplans; tackling environmental, physical and other determinants which make choosing to eat a healthybalanced diet and having a physically active lifestyle an easier option.AIMTo increase numbers of children leaving primary school at a healthy weight and reduce inequalities ofchildren and young people in Darlington by identifying priority actions, developing recommendationsand implementing plans. These will focus on prevention and a partnership approaches and will haveto be within the main envelope of funding.OBJECTIVES To transform the environment so that it supports healthy lifestyles by increasing andmaintaining use of green space for play and recreation. To transform the environment so that healthier choices are available in the provision of out ofhome food To transform the environment by supporting the public sector to lead by example with Foodchoices Increase making healthier choices easier by providing information and practical support onactive travel Increase making healthier choices easier by delivering an awareness raising campaign To support the services needed to tackle excess weight by increasing breastfeeding rates To support the services needed to tackle excess weight by Making Every Contact Count(MECC)3
Childhood Healthy Weight Action Plan for Darlington 2017 – 2022KEY MESSAGES The most recent measurements from Darlington (2016/17) show the rate of childhood obesityin the town sits above the national average at both reception and year 6. It is very slightlybelow the regional average at reception age but in line with North East regional average inyear 6. The percentage of children at year 6 who are categorised as obese in Darlington is 22%, thisfigure is more than double the figure at reception age where the percentage is 10%. These rates of childhood obesity have significant consequences for the health of our childrenduring childhood and into adulthood. These include mental health concerns as well asdiseases such as diabetes and heart disease. In Darlington childhood obesity is not evenly spread it is concentrated in the central urban andeastern wards and has a strong correlation with deprivation levels. Although the main causes of obesity are poor diet and low levels of physical activity it hasbeen shown that environmental changes can have the most impact on reducing obesity. Anenvironment that promotes activity in travel and recreation and does not provide easy accessto energy dense food can reduce obesity levels. This method requires a co-ordinated partnership approach from a wide variety of stakeholdersto enable effective and sustainable environmental change. This includes planning anddevelopment, environmental health, leisure and culture, and licensing. Areas identified as having higher levels of childhood obesity would benefit the most fromsupport to modify the environment to make the healthy choice the easy choice. Mapping tounderstand the detail of the environments in required including; out of home food provision,exposure to advertising and promotions, healthy food provision and active travel routes. Tackling the obesogenic environment will be supported by the promotion of the healthylifestyle message to reinforce the need for healthy behaviours as a means of prevention andtreatment for those with excess weight. This will include complimentary and consistent changefor life messages. By transforming the environment, making healthier choices easier and supporting services totackle excess weight we hope to increase the number of children in Darlington leaving primaryschool at a healthy weight. This action plan details specific actions following the recommendations outlined in the nationalgovernment document Childhood Obesity: A plan for Action 2016.4
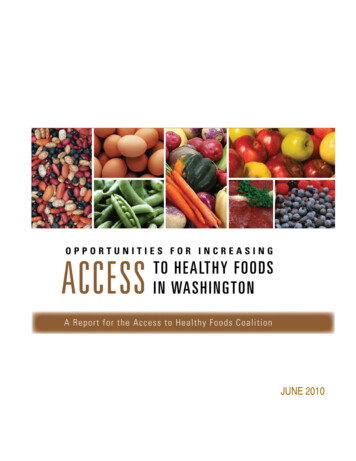
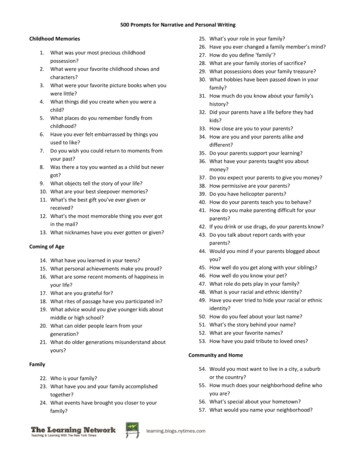
Childhood Healthy Weight Action Plan for Darlington 2017 – 2022INTRODUCTION Childhood obesity and excess weight are significant health issues for children. They can haveserious implications for the physical and mental health of a child1. Obese children are morelikely to become obese adults and have a higher risk of morbidity and premature mortality inadulthood2. Obesity and overweight are linked to a wide range of diseases, most notably, diabetes (type2), asthma, hypertension, cancer, heart disease and stroke3. The effect of obesity on the mental and emotional health of children and young people canalso be significant, many children experience bullying linked to their weight4.Figure 1: Obesity Harms Children and Young People51Public Health England, Childhood Obesity: Applying All Our Health (2015)World Health Organisation Global Strategy on Diet, Physical Activity and Health (2004)3Public Health England, Childhood Obesity: Applying All Our Health (2015)4National Obesity Observatory. Obesity and Mental Health (2011)5Public Health England, Childhood Obesity: Applying All Our Health (2015)25
Childhood Healthy Weight Action Plan for Darlington 2017 – 2022 The impact of obesity is not only on health, the cost to the economy is also great: it wasestimated that the NHS in England spent 5.1 billion on overweight and obesity-related illhealth in 2014/15. The total cost to society is estimated to be between 27 billion and 46billion.6 On 18 August 2016, the government published its childhood obesity plan Childhood Obesity: APlan for Action. The aim of this document is to significantly reduce England’s rate of childhoodobesity within the next 10 years by implementing the individual commitments in the plan. Poor diet and low levels of physical activity are the primary causal factors to excess weighthowever the likelihood of children becoming overweight or obese is increased by living in afamily where at least one parent or carer is obese7 There is also strong evidence of arelationship between maternal obesity and the birth of babies above a normal weight range,and the development of childhood and adult obesity, irrespective of environmental and geneticfactors8 The amount of sugar that children consume on a daily basis is a major contributing factor togaining weight. The National Diet and Nutrition Survey found that sugary drinks account for30% of 4 to 10 year olds’ daily sugar intake. Children’s consumption of added or processedsugars (non-milk extrinsic sugars) significantly exceeds the maximum recommended level.Their consumption of saturated fat, as part of their daily food energy, significantly exceeds themaximum recommended level of 11% of total food energy9. In July 2015, the Scientific Advisory Committee on Nutrition (SACN) published itsCarbohydrates and Health Report. SACN recommended free sugars intake should not exceed5% of total dietary energy for all ages from 2 years upwards. Free sugars are defined as allsugars added to foods plus those naturally present in fruit juices, syrups and honey. It doesnot include the sugars naturally present in intact fruit and vegetables or milk and dairyproducts.6McKinsey Global Institute Overcoming Obesity: An Initial Economic Analysis. (2014)Public Health England, (2015) Childhood Obesity: Applying All Our Health8‘Maternal Obesity’ noo.org.uk website (December 2015)9Public Health England (2015) Sugar Reduction: the evidence for action76
Childhood Healthy Weight Action Plan for Darlington 2017 – 2022 In October 2015, Public Health England published its sugar reduction evidence package inwhich it suggested 8 possible actions to reduce population sugar consumption. The reportsuggested that a structured and universal programme of reformulation to reduce levels ofsugar in food and drink would significantly lower sugar intakes, particularly if accompanied byreductions in portion size. Sugar reduction is also a key component in the oral health of children and young people.Tooth decay can be a sign of a poor diet, especially excess sugar consumption which can leadto obesity. Low levels of physical activity, and increased sedentary behaviours, of children and youngpeople exacerbate the problems of poor diet and nutrition. In England, only 21% of boys and16% of girls aged 5 to 15 achieve recommended levels of physical activity. As children growolder, the decrease in activity levels is greater for girls than boys: 23% of girls aged 5 to 7meet the recommended levels of activity, but by ages 13 to 15 only 8% still do10. Areas of socioeconomic disadvantage in England have higher childhood obesity rates thanthose in lesser deprived areas. At age 5, children from the poorest income groups are twice aslikely to be obese compared to their most well-off counterparts; by age 11 they are three timesas likely.11 The prevalence of underweight children in the UK is much lower than the prevalence ofobesity. The proportion of underweight children in 2016/17 at Year 6 was 1.3%.12 The causesfor this are varied and individual to the child including not consuming enough calories, notabsorbing enough calories from food or requiring more calories than normal.13 In most cases of underweight children a paediatrician and dietician will support their individualneeds but generally a healthy balanced diet is still recommended. This ensures calories arefrom healthy food sources and sets habits for life.1410Start Active, Stay Active: A report on physical activity from the four home countries’ Chief Medical Officers, July 2011.Guidance: Childhood Obesity: A Plan for Action (updated 2017) an-for-action#fn:1112NCMP: htolderchild.aspx117
Childhood Healthy Weight Action Plan for Darlington 2017 – 2022 In some cases the causes of underweight, overweight or obese children can be linked toneglect. This form of neglect is sometimes associated with ‘failure to thrive’, in which a childfails to develop physically as well as psychologically. However, failure to thrive can occur forother reasons, independent of neglect. Childhood obesity resulting from an unhealthy diet andlack of exercise has been considered as a form of neglect, given its serious long termconsequences15. There are robust protection laws and reporting mechanisms for professionalsworking with children in this situation to ensure they are protected and safeguarded.161516Action for Children: Neglect: Research Evidence To Inform dance/8
Childhood Healthy Weight Action Plan for Darlington 2017 – 2022Epidemiological Assessment of NeedThe National Childhood Measurement Programme (NCMP) measures children’s weight at two agestages: at ages 4 – 5 years (Reception class) and again at ages 10 – 11 year (Year 6). It classifiesthe results into 4 categories; obese, overweight, healthy weight and underweight. Parents areinformed of their child’s result via letter and given the opportunity to seek further advice and support ifthey want to.Nationally approximately one-fifth of 4 to 5 year olds and a third of 11 year olds are overweight orobese, as well as two-thirds of adults.The most recent measurements from Darlington (2016/17) show the rate of childhood obesity in thetown sits above the national average at both reception and year 6 and is very slightly below theregional average at reception age but in line with North East regional average year 6. Please seetables below for more detailed figures.Figure 2: Percentage of overweight and obese children at Reception17 (ages 4 – 5 Years)2016/17Overweight ObeseENGLAND139.6Overweight& ObeseCombined22.6NORTH EAST13.810.724.5DARLINGTON 14.310.524.8Figure 3: Percentage of overweight and obese children at Year 618 (Ages 10-11 Years)2016/17Overweight ObeseENGLAND14.320Overweight& ObeseCombined34.2NORTH EAST14.322.537.322.536.5DARLINGTON 141718NCMP: www.digital.nhs.uk/catalogue/PUB30113NCMP: www.digital.nhs.uk/catalogue/PUB301139
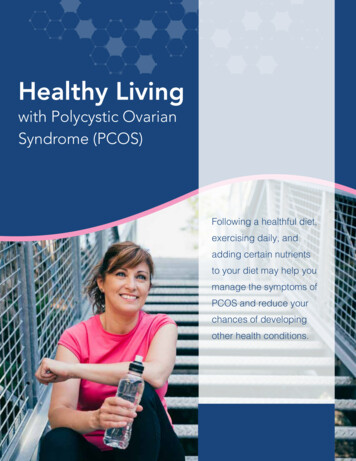
Childhood Healthy Weight Action Plan for Darlington 2017 – 2022Figure 4: Reception Obesity Darlington and its nearest CIPFA Neighbours 19Figure 5: Year 6 Obesity Darlington and its nearest CIPFA Neighbours201920Public health England, Fingertips Tool, NCMP Data easurement-programmePublic health England, Fingertips Tool, NCMP Data easurement-programme10
Childhood Healthy Weight Action Plan for Darlington 2017 – 2022The charts below show us the childhood obesity rates in Darlington, compared to England, at eachage range between 2006/07 and 2014/15. We can see that the rates vary, there is no strong trend,with figures dipping below and above the national average for both age ranges over time. Howevercurrently both measurements are above the national average.Figure 6: Trend in obese children aged 4-5 years (reception age) in Darlington 2006/7 to2014/152121Public health England, Fingertips Tool, NCMP Data easurement-programme11
Childhood Healthy Weight Action Plan for Darlington 2017 – 2022Figure 7: Trend in obese children aged 10-11 years (Year 6 age) in Darlington 2006/7 to2014/152222Public health England, Fingertips Tool, NCMP Data easurement-programme12
Childhood Healthy Weight Action Plan for Darlington 2017 – 2022North East Regional Childhood ObesityThe tables below show obesity prevalence at the two measurement stages across the north eastregion and broken down by local authority area. Darlington’s value is in line with the regional averageat both measurement stages.Figure 8: Prevalence of obesity among children in Reception23Figure 9: Prevalence of obesity children in year 6242324Public health England, Fingertips Tool, NCMP Data easurement-programmePublic health England, Fingertips Tool, NCMP Data, easurement-programme13
Childhood Healthy Weight Action Plan for Darlington 2017 – 2022Although the tables above show us that Darlington’s prevalence of childhood obesity is in line withthe regional average they do not tell us if this is evenly spread across the town.The two maps below show the distribution of obesity across Darlington in reception and Year 6. Theyshow that it is not equally distributed across the borough with a concentration in the urban centre andeastern wards.Figure 10: Distribution of obesity across Darlington in Reception25Figure 11: Distribution of obesity across Darlington in Year 6262526Public Health England, Local Health Tool, www.localhealth.org.ukPublic Health England, Local Health Tool, www.localhealth.org.uk14
Childhood Healthy Weight Action Plan for Darlington 2017 – 2022This unequal distribution and in particular the apparent link with poverty/deprivation and obesity issupported when the deprivation scores and obesity rates (%) in reception and Year 6 are compared.There is below a definite correlation between deprivation and obesity in primary school children.Figure 12: Correlation of Obese children at reception age with deprivation score for EnglandLocal Authorities27Figure 13: Correlation of Obese children at Year 6 with deprivation score for England LocalAuthorities282728Public Health England, Local Health Tool, www.localhealth.org.ukPublic Health England, Local Health Tool, www.localhealth.org.uk15
Childhood Healthy Weight Action Plan for Darlington 2017 – 2022The English Indices of Deprivation 2015 are based on 37 separate indicators, organised acrossseven distinct domains of deprivation which are combined, using appropriate weights, to calculate theIndex of Multiple Deprivation 2015 (IMD 2015). This is an overall measure of multiple deprivationexperienced by people living in an area and is calculated for every Lower layer Super Output Area(LSOA), or neighbourhood, in England. Every such neighbourhood in England is ranked according toits level of deprivation relative to that of other areas.Figure 14: Correlation of obese Children at Reception age by Darlington Ward compared toIMD 2015 score for Ward29Figure 15: Correlation of obese Children at Year 6 age by Darlington Ward compared to IMD2015 score for Ward3029Public Health England, Local Health Tool, www.localhealth.org.ukPublic Health England, Local Health Tool, www.localhealth.org.uk3016
Childhood Healthy Weight Action Plan for Darlington 2017 – 2022Findings from the Healthy Lifestyle Survey in Darlington (primary andsecondary schools)The Primary Healthy Lifestyle Survey 2017/18 took place December 2017 to January 2018 with 16primary schools in Darlington submitting survey responses. 1,468 number of pupils in year 5 and 6completing at least one question of the survey. Seven questions in this survey relate to exercise anddiet and a further five are related to energy drink consumption. The key findings include: 78% (989) of pupils think they achieve the recommended 60 minutes physical activity a day;this is a similar figure to recent years. 80% (1019) of pupils included, ‘to keep fit and healthy’ as one of their reasons for exercising. 80% (1012) of pupils stated they eat a balanced diet. However 51% and 35%, respectively,reported that they eat sweets and chocolate and drink fizzy drinks. 85% (1079) pupils eat breakfast every day. 8% claimed to have energy drinks weekly.The Secondary healthy Lifestyle Survey 2017/18 surveyed 4872 children from across eight differentschools. Among secondary school respondents only 23% (1029) of pupils answered that theyachieved 60 minutes of physical activity a day, a big decline from primary school figures. 3001 pupils(65.9%) stated they follow a balanced diet and 2612 pupils (57.3%) eat breakfast every day.More secondary pupils than primary pupils reported consuming energy drinks. 8% at primary ageclaimed to have them weekly, this figure rose to 20% by secondary school age. However 80% ofrespondents at both primary and secondary age recognised that energy drinks were bad for theirhealth.These results show that children’s knowledge on healthy eating is good but practical support toimprove physical activity levels at secondary school level would be beneficial.The information from the survey on diet habits e.g. fizzy drink and sweet consumption also hasimplications for oral health as well as maintaining a healthy weight due to the high sugar content ofthese foods. Darlington’s oral health plan includes actions to reduce their consumption and thereforereinforces the recommendations in this healthy weight action plan.17
Childhood Healthy Weight Action Plan for Darlington 2017 – 2022TO TRANSFORM THE ENVIRONMENT SO THAT IT SUPPORTSHEALTHY LIFESTYLESUnderstanding and Adapting the Obesogenic EnvironmentIn 2007 the UK government published the Foresight report ‘Tackling obesities: future choices’ itremains the most comprehensive investigation into obesity and its causes. It described the complexrelations between the social, economic and physical environments and individual factors that underliethe development of obesity.31Obesity is a multi-faceted issue that requires action from individuals and wider society to tackleeffectively. A very important action is to adapt the environment so that it does not promote sedentarybehaviour or provide easy access to energy-dense food. The aim is to help make the healthy choicethe easy choice via environmental modification and action at population and individual levels.Adapting the environment can include the built environment by planning in recreational green spaceas well as active travel routes. The government’s public health strategy ‘Healthy lives, healthypeople’, states that “health considerations are Obesity and the environment: increasing physicalactivity and active travel are an important part of planning policy.’32Reducing the proximity of fast food outlets to schools, colleges, leisure centres and other placeswhere children gather is another recommendation to tackle the obesogenic environment.33The healthy choice is even more difficult to make in deprived areas, which have less disposableincome and a higher density of takeaways 34This focus on the environment requires what has been described as, ‘a whole systems approach’ totackling obesity35. In 2015 Public Health England, in partnership with the Local GovernmentAssociation (LGA) and the ADPH, commissioned Leeds Beckett University (LBU) to deliver this threeyear ‘action research’ programme. This approach has effective partnership work at its core.The diagram below details the variety of different partners the healthy weight agenda and obesogenicenvironment can relate to. Darlington will seek to transform the environment so that it supportshealthy lifestyles and make healthier choices easier by focusing on 3 key areas; out of home foodprovision, access to green space, and active travel.31Foresight Report: Tackling Obesity: Future Choices’Healthy Lives: Healthy People33Measuring Up The Medical Profession's Prescription For The Nation's Obesity Crisis Academy of Medical Royal Colleges’ 201334Public Health England. (2013) Obesity and the environment: fast food outlets35Local Government Association Making obesity everybody’s business: A whole systems approach to obesity3218
Childhood Healthy Weight Action Plan for Darlington 2017 – 2022Figure 16: Partnership: the Key to Success3636Public Health Matters Blog: Designing a ‘whole systems approach’ to prevent and tackle obesity19
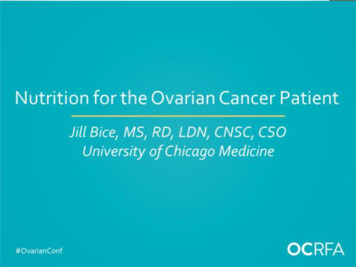
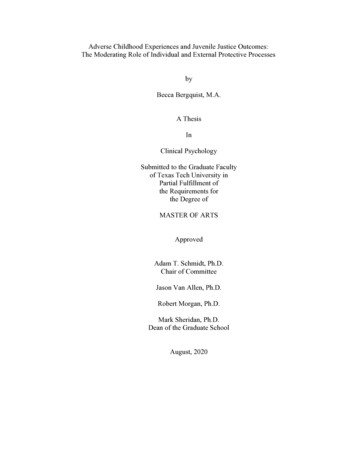
Childhood Healthy Weight Action Plan for Darlington 2017 – 2022Out of Home Food Provision3738 The rise in popularity of out-of-home meals has been identified as an important factorcontributing to rising levels of obesity.37 Meals eaten outside of the home tend to beassociated with higher intakes of energy, fat and salt. One fifth of children eat food from out of home food outlets at least once a week. 38 School children make purchases from a variety of food outlets in the school fringe at lunchtime(if there is a no stay on site policy), and during their journeys to and from school. Popularpurchases include confectionery, sugar sweetened drinks, and hot food takeaways. Manyoutlets have price promotions on these items particularly targeted at children and youngpeople. Food outlets, including grocers, takeaways and convenience stores, increasingly clusteraround schools. However, it is not only the food environment around schools that influencesfood purchases and consumption patterns, the whole journey environment needs to beconsidered. This includes advertising in close proximity to schools on bus stops and billboardsfor example. A number of studies, prevalence of and mapping exercises suggest that there is a greaternumber of hot food takeaways and obesity in deprived areas. Information and education are solid foundations for improving diet, however, a growing body ofevidence suggests that more structural changes are needed to achieve sustained behaviouralchange. These could include reducing the price of healthier foods, increasing the availability ofhealthier options, reducing pack size, and portion control. A hot food takeaway “hotspots” heat map produced for Darlington in 2016 shows thattakeaways are concentrated in certain areas, sharing the same postcodes. The total numberof outlets (from fast food density outlet data) for 2016 in Darlington is 124. Further work is planned to understand the food environment in the areas indicated as havinghigh levels of obesity in the local health maps above. This includes the proximity of takeawaysto schools along with mapping of grocers and convenience stores. Giving consideration to the, ‘whole journey’ actions to map and restrict advertising of highsugar foods are also detailed in the action plan. The Government Buying Standards for Food and Catering Services (GBSF) can be used as astarting point to assess the availability, procurement, price and prominence of healthieringredients, food products and catering practices. The action plan details setting an example by local authority adopting GBSF, and using thisgood practice to promote the use across the Borough.Government Office for Science. Tackling obesities: future choices - project report (2nd edition)Public Health England; Strategies for Encouraging Healthier ‘Out of Home’ Food Provision20
Childhood Healthy Weight Action Plan for Darlington 2017 – 2022Figure 17: Hot food takeaway “hotspots” heat map3939Created by Public Health Team QGIS21
Childhood Healthy Weight Action Plan for Darlington 2017 – 2022Figure 18: Number of Hot food takeaway outlets by Ward4040Created by Public Health Team QGIS22
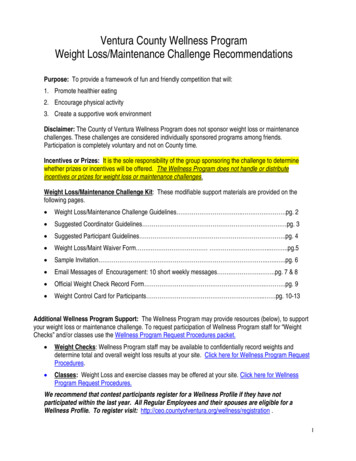
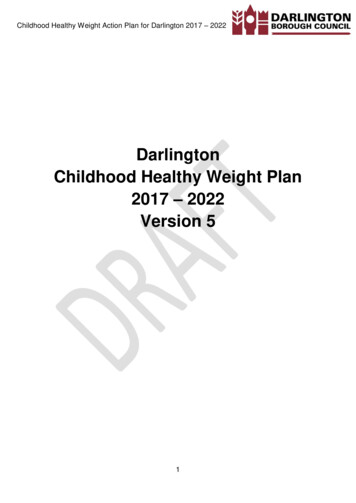
Childhood Healthy Weight Action Plan for Darlington 2017 – 2022Access to Green Space There is substantial evidence that access to good quality green spaces can have benefits tothe health and wellbeing of individuals and communities including overweight and obesitylevels41. Improving access to green spaces for all social groups can reduce health inequalities due tothe unequal access to green space across England.42 The most deprived areas are less likelyto be near green spaces and therefore the people living there will have less opportunity toexperience the health benefits of green space compared with people living in less deprivedareas.43 Research shows that there are higher levels of physical activity in areas with moregreen space.44 Green spaces come in a wide of forms including established parks and woodlands tonatural grasslands and wetlands to green corridors such as riverbanks and cycle ways.45 The location of good quality green space and individual’s proximity to it are not the onlybarriers to accessing it. Often people include barriers to using green space such as fear forpersonal safety, antisocial behaviour, poor maintenance of green spaces, and lack oftransport.46 The maintenance of local green spaces is often a local authority responsibility; providing anopportunity to improve and create green space through joint work across different parts of thecouncil and beyond, particularly public health, planning, transport, and parks and leisure. The maps below show open green space in Darlington, the action plan aims to support theavailability of green space by identifying barriers to accessing it and promoting its use acrossthe borough for play and recreation.41World Health Organisation Urban Green Spaces and HealthPHE Local Action on Health Inequalities: Improving Access to Green Space43PHE Local Action on Health Inequalities: Improving Access to Green Space4244Ellaway A, MacIntyre S, Bonnefoy X. Graffiti, greenery, and obesity in adults: secondary analysis of European cross sectionalsurvey. British Medical Journal. 2005;331(7514):611-2.4546Building the foundations: Tackling obesity through planning and developmentPublic Health England, 2014, Local action on health inequalities: Improving access to green spaces23
Childhood Healthy Weight Action Plan for Darlington 2017 – 2022Figure 15: Open spaces with wards whole borough47Figure 16: OpenSpaces within Town Centre Wards The Centre Of The Borough4847ArcGIS online24
Childhood Healthy Weight Action Plan for Darlington 2017 – 2022Active Travel Darlington’s Active Travel Strategy works to supports the health indicators outlined in theCorporate Performance Management Framework to increase physical activity and reduceobesity levels. Darlington’s Sport and Physical Activity Strategy 2014-19 has the vision that,‘More Darlington residents are more active more often’. Regular physical activity is a key factor helping to prevent obesity and excess weight. TheDepartment of Health recommends that adults complete at least 150 minutes (2.5 hours) ofmoderate-intensity aerobic activity every week. Children over five should take at least 60minutes of moderate to vigorous intensity physical activity every day.49 Physical activity that can be incorporated into everyday life, such as brisk walking and cycling,has been found to be as effective for weight loss as supervised exercise programmes.50However, over a third of adults report they are not as active as recommended suggesting thatthe true proportion is even less.51 Creating an environment where people actively choose to walk and cycle as part of everydaylife can have a significant impact on public health and may reduce inequalities in health. It isan essential component of a strategic approach to increasing physical activity and may bemore cost-effective than other initiatives that promote exercise, sport and active leisurepursuits.52 Practical actions to improve active travel in children included in the plan are mapping to andfrom school journeys and identifying and overcoming barriers to actively travel. Barriers canrange from physical problems like busy roads to safety concerns and confidence issues.Darlington’s Local Transport Plan supports the healthy weight plan by promoting active travel.48ArcGIS OnlineHealthy people, healthy
Childhood Healthy Weight Action Plan for Darlington 2017 - 2022 8 In some cases the causes of underweight, overweight or obese children can be linked to neglect. This form of neglect is sometimes associated with 'failure to thrive', in which a child fails to develop physically as well as psychologically.