Transcription
DarlingtonChildhood HealthyWeight Plan2019 - 2024
2 Childhood Healthy Weight Plan for Darlington 2019 – 2024
ContentsVision4Aim4Objectives4Key Messages5Introduction6Epidemiological Assessment of Need9North East Regional Childhood Obesity13Findings from the Healthy Lifestyle Surveyin Darlington18To transform the environment so that itsupports healthy lifestylesUnderstanding and Adapting theObesogenic Environment19Out of Home Food Provision21Access to Green Space24Active Travel26Childhood Healthy Weight Plan for Darlington 2019 – 2024 3
VisionDarlington is to increase the proportion ofchildren leaving primary school aged 10-11years (Year 6) with a healthy weight. This willbe achieved by developing a whole systemsapproach to tackling childhood obesity.Darlington will ensure the healthy weight agendais integrated in other relevant plans; tacklingenvironmental, physical and other determinantswhich make choosing to eat a healthy balanceddiet and having a physically active lifestyle aneasier option.AimTo increase numbers of children leavingprimary school at a healthy weight and reduceinequalities of children and young peoplein Darlington by identifying priority actions,developing recommendations and implementingplans. These plans will focus on prevention,adopting a partnership approach and will bedelivered within the main envelope of funding.Objectives To transform the environment so that itsupports healthy lifestyles by increasing andmaintaining use of green space for play andrecreation. To transform the environment so that healthierchoices are available in the provision of out ofhome food. To transform the environment by supportingthe public sector to lead by example with foodchoices.4 Childhood Healthy Weight Plan for Darlington 2019 – 2024 Increase making healthier choices easier byproviding information and practical support onactive travel. Increase making healthier choices easier bydelivering an awareness raising campaign. To support the services needed to tackleexcess weight by increasing breastfeedingrates. To support the services needed to tackleexcess weight by Making Every Contact Count(MECC).
Key messages The most recent measurements fromDarlington (2017/18) show the rate of childhoodobesity in the town sits above the nationalaverage at both reception and year 6. It isvery slightly below the regional average atreception age but in line with North Eastregional average in year 6. The percentage of children at year 6 who arecategorised as obese in Darlington is 21.2%,this fgure is more than double the fgure atreception age where the percentage is 8.6%. These rates of childhood obesity havesignifcant consequences for the health of ourchildren during childhood and into adulthood.These include mental health concerns aswell as diseases such as diabetes and heartdisease. In Darlington childhood obesity is not evenlyspread it is concentrated in the centralurban and eastern wards and has a strongcorrelation with deprivation levels. Although the main causes of obesity are poordiet and low levels of physical activity it hasbeen shown that environmental changes canhave the most impact on reducing obesity. Anenvironment that promotes activity in traveland recreation and does not provide easyaccess to energy dense food can reduceobesity levels. Areas identifed as having higher levels ofchildhood obesity would beneft the most fromsupport to modify the environment to makethe healthy choice the easy choice. Mappingto understand the detail of the environmentsis required including; out of home foodprovision, exposure to advertising andpromotions, healthy food provision and activetravel routes. Tackling the obesogenic environment will besupported by the promotion of the healthylifestyle message to reinforce the need forhealthy behaviours as a means of preventionand treatment for those with excess weight.This will include complimentary and consistentchange for life messages. By transforming the environment, makinghealthier choices easier and supportingservices to tackle excess weight we hope toincrease the number of children in Darlingtonleaving primary school at a healthy weight. This plan is in line with the recommendationsoutlined in the national government documentChildhood Obesity: A Plan for Action (2016)and Childhood Obesity: A Plan for Action:Chapter 2 (2018). This method requires a co-ordinatedpartnership approach from a wide varietyof stakeholders to enable efective andsustainable environmental change. Thisincludes planning and development,environmental health, leisure and culture andlicensing.Childhood Healthy Weight Plan for Darlington 2019 – 2024 5
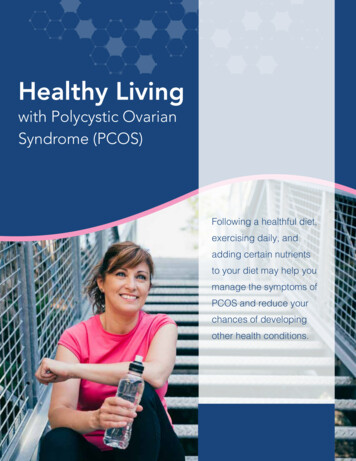
Introduction Childhood obesity and excess weight aresignifcant health issues for children. Theycan have serious implications for the physicaland mental health of a child1. Obese childrenare more likely to become obese adults andhave a higher risk of morbidity and prematuremortality in adulthood.2 The efect of obesity on the mental andemotional health of children and youngpeople can also be signifcant, many childrenexperience bullying linked to their weight.4 Obesity and overweight are linked to a widerange of diseases, most notably, diabetes(type 2), asthma, hypertension, cancer, heartdisease and stroke.3Figure 1: Obesity Harms Children and Young People5Pub ic H&althEnglandObesity harms ch"ldren and young peopte00Emotional andbehaviouralSohoo1 absence Higc olesterol igh bloodpressure,, pre-diabe,tes Stigmatisation bullyng low self.,esteem12 bone &jointproblemsPublic Health England, Childhood Obesity: Applying All Our Health (2015)World Health Organisation Global Strategy on Diet, Physical Activity and Health (2004)Public Health England, Childhood Obesity: Applying All Our Health (2015)4National Obesity Observatory. Obesity and Mental Health (2011)5Public Health England, Childhood Obesity: Applying All Our Health (2015)6 Childhood Healthy Weight Plan for Darlington 2019 – 2024aduits1 breathingdifficul ies3-Increased risk ofbeoom·: g oveMeigh ··sk of m-he th andprematlJre monali,,adul life
The impact of obesity is not only on health,the cost to the economy is also great: it wasestimated that the NHS in England spent 5.1billion on overweight and obesity-related illhealth in 2014/15. The total cost to society isestimated to be between 27 billion and 46billion.6 On 18 August 2016, the government publishedits childhood obesity plan Childhood Obesity:A Plan for Action. The aim of this documentis to signifcantly reduce England’s rate ofchildhood obesity within the next 10 years byimplementing the individual commitments inthe plan. In 2018 Chapter 2 was publishedoutlining actions to work across society settinga national ambition; “to halve childhoodobesity and signifcantly reduce the gap inobesity between children from the most andleast deprived areas by 2030”. Poor diet and low levels of physical activity arethe primary causal factors to excess weighthowever the likelihood of children becomingoverweight or obese is increased by livingin a family where at least one parent or careris obese7 There is also strong evidence of arelationship between maternal obesity and thebirth of babies above a normal weight range,and the development of childhood and adultobesity, irrespective of environmental andgenetic factors.8 The amount of sugar that children consumeon a daily basis is a major contributing factorto gaining weight. The National Diet andNutrition Survey found that sugary drinksaccount for 30% of 4 to 10 year olds’ dailysugar intake. Children’s consumption ofadded or processed sugars (non-milk extrinsicsugars) signifcantly exceeds the maximumrecommended level. Their consumptionof saturated fat, as part of their daily foodenergy, signifcantly exceeds the maximumrecommended level of 11% of total foodenergy.9 In July 2015, the Scientifc AdvisoryCommittee on Nutrition (SACN) publishedits Carbohydrates and Health Report. SACNrecommended free sugars intake shouldnot exceed 5% of total dietary energy for allages from 2 years upwards. Free sugars aredefned as all sugars added to foods plusthose naturally present in fruit juices, syrupsand honey. It does not include the sugarsnaturally present in intact fruit and vegetablesor milk and dairy products. In October 2015, Public Health Englandpublished its sugar reduction evidencepackage in which it suggested 8 possibleactions to reduce population sugarconsumption. The report suggested thata structured and universal programme ofreformulation to reduce levels of sugar infood and drink would signifcantly lowersugar intakes, particularly if accompanied byreductions in portion size. Sugar reduction is also a key component inthe oral health of children and young people.Tooth decay can be a sign of a poor diet,especially excess sugar consumption whichcan lead to obesity.6PMcKinsey Global Institute Overcoming Obesity: An Initial Economic Analysis. (2014)7Public Health England, (2015) Childhood Obesity: Applying All Our Health8‘Maternal Obesity’ noo.org.uk website (December 2015)9Public Health England (2015) Sugar Reduction: the evidence for actionChildhood Healthy Weight Plan for Darlington 2019 – 2024 7
Low levels of physical activity, and increasedsedentary behaviours, of children and youngpeople exacerbate the problems of poordiet and nutrition. In England, only 21% ofboys and 16% of girls aged 5 to 15 achieverecommended levels of physical activity. Aschildren grow older, the decrease in activitylevels is greater for girls than boys: 23% ofgirls aged 5 to 7 meet the recommendedlevels of activity, but by ages 13 to 15 only 8%still do.10 Areas of socioeconomic disadvantage inEngland have higher childhood obesity ratesthan those in lesser deprived areas. At age 5,children from the poorest income groups aretwice as likely to be obese compared to theirmost well-of counterparts; by age 11 they arethree times as likely.11 The prevalence of underweight children inthe UK is much lower than the prevalenceof obesity. The proportion of underweightchildren in 2016/17 at Year 6 was 1.3%. Thecauses for this are varied and individual tothe child including not consuming enoughcalories, not absorbing enough calories fromfood or requiring more calories than normal.13 In most cases of underweight children apaediatrician and dietician will support theirindividual needs but generally a healthybalanced diet is still recommended. Thisensures calories are from healthy foodsources and sets habits for life.14 In some cases the causes of underweight,overweight or obese children can be linkedto neglect. This form of neglect is sometimesassociated with ‘failure to thrive’, in which achild fails to develop physically as well aspsychologically. However, failure to thrivecan occur for other reasons, independentof neglect. Childhood obesity resulting froman unhealthy diet and lack of exercise hasbeen considered as a form of neglect, givenits serious long term consequences15 . Thereare robust protection laws and reportingmechanisms for professionals working withchildren in this situation to ensure they areprotected and safeguarded.1610Start Active, Stay Active: A report on physical activity from the four home countries’ Chief Medical Ofcers, July 2011.11Guidance: Childhood Obesity: A Plan for Action (updated -for-action#fn:1112NCMP: htolderchild.aspx15Action for Children: Neglect: Research Evidence To Inform uidance/8 Childhood Healthy Weight Plan for Darlington 2019 – 2024
EpidemiologicalAssessment of NeedThe National Childhood Measurement Programme (NCMP) measures children’s weight at two agestages: at ages 4 – 5 years (Reception class) and again at ages 10 – 11 years (Year 6). Prevalenceof underweight, healthy weight, overweight, obesity and severe obesity can be examined at localauthority level. Parents are informed of their child’s result via letter and given the opportunity to seekfurther advice and support if they want to.Nationally approximately one-ffth of 4 to 5 year olds and a third of 11 year olds are overweight orobese, as well as two-thirds of adults.The most recent NCMP measurements from Darlington (2017/18) provide a childhood obesity proflefor the town. Levels of obesity at reception age are slightly below the national and regional fgures.By Year 6 levels of obesity have risen above the national average whilst remaining slightly below theregional. The fgures below provide more detail for both age groups.Figure 2: Prevalence of overweight and obese children at Reception17(ages 4 – 5 years)172017/18OverweightObese (includingsevere obesity)Overweight &Severe obesityObese CombinedEngland12.8%9.5%22.4%2.4%North CMP: www.digital.nhs.uk/catalogue/PUB30113Childhood Healthy Weight Plan for Darlington 2019 – 2024 9
Figure 3: Percentage of overweight and obese children at Reception18(ages 10 – 11 years)2017/18OverweightObese (includingsevere obesity)Overweight &Severe obesityObese CombinedEngland14.2%20.1%34.3%4.2%North 9%The percentage of children who are overweight (at reception age) and who are severely obese (inYear 6) are both above the national and regional fgures. The percentage of children in receptionclassifed as obese rises from below to above national fgures by Year 6 (8.6% in reception to 21.2%in Year 6).Figure 4: Reception Prevalence of obesity (including severe obesity)Darlington and its nearest CIPFA neighbours19AreapqRecent NeighbourTrendRankCountpqValuepq95%95%Lower CI Upper CI--EnglandÇ-58,1969.5St. HelensÇ527113.2WarringtonÇ142711.5North East 5399DoncasterÆ13388--.i11.0 - - . . i10.8 - - - . �3Telford and 410.012.19.811.8 9.411.810.3--.i9.211.638910.3 9.311.3820610.0----.i8.811.4Ç638210.0 ---.i--.i8.610.8DerbyÆ43159.5 8.510.5DarlingtonÆ-1018.6 7.110.4BuryÆ101898.0----.i7.09.1II Source: NHS Digital, National Child Measurement ProgrammeCompared with Benchmark: Better Similar Worse Not compared18NCMP: www.digital.nhs.uk/catalogue/PUB3011319Public health England, Fingertips Tool, NCMP Data surement-programme10 Childhood Healthy Weight Plan for Darlington 2019 – 2024
Figure 5: Year 6 Prevalence of obesity (including severe obesity) Darlingtonand its nearest CIPFA neighbours20AreapqRecent NeighbourTrendRankCountpqValuepq95%95%Lower CI Upper .324.3St. .4Telford and 153421.219.7WiganÇ1572721.1North East 18.021.2Æ946418.617.1-.i--.iSource: NHS Digital, National Child Measurement ProgrammeCompared with Benchmark: Better Similar Worse Not compared20Public health England, Fingertips Tool, NCMP Data surement-programmeChildhood Healthy Weight Plan for Darlington 2019 – 2024 11
The charts below show us the childhood obesity rates in Darlington, compared to England, at eachage group between 2006/07 and 2016/17. The prevalence varies, there is no strong trend, withfgures dipping below and above the national average for both age groups over time.Figure 6: Trend in obesity prevalence (including severe obesity) in childrenaged 4-5years (reception) in Darlington between 2006/07 and 2016/172120%15105T2006/07TT2008/09T2010/11 TT2012/13TT2014/15TT2016/17EnglandCompared with Benchmark: Better Similar WorseFigure 7: Trend in obesity prevalence (including severe obesity) in childrenaged 10-11years (Year 6) in Darlington between 2006/07 and 2016/172240%302010T2006/07TT2008/09T2010/11 2012/13T2014/15T2016/17EnglandCompared with Benchmark: Better Similar Worse21Public health England, Fingertips Tool, NCMP Data surement-programme22Public health England, Fingertips Tool, NCMP Data surement-programme12 Childhood Healthy Weight Plan for Darlington 2019 – 2024
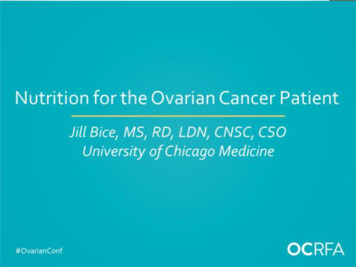
North East RegionalChildhood ObesityThe tables below show obesity prevalence at the two measurement stages across the north eastregion and broken down by local authority area. Prevalence of obesity among children in reception(4-5years) in Darlington is below the national fgure and the lowest in the region. There is anincreasing trend in Darlington in relation to obesity among children in Year 6, with prevalence abovethe national average.Figure 8: Prevalence of obesity among children in r CI Upper CIEnglandÇ58,1969.59.59.6North East eÆ36811.810.713.0Redcar and 2.7Country 1.9Stockton-on-TeesÈ25210.59.411.8South TynesideÆ16910.49.011.9North lingtonÆ1018.67.110.4Source: NHS Digital, National Child Measurement ProgrammeCompared with Benchmark: Better Similar Worse Not compared23Public health England, Fingertips Tool, NCMP Data surement-programmeChildhood Healthy Weight Plan for Darlington 2019 – 2024 13
Figure 9: Prevalence of obesity children in Year 624AreaRecentTrendCountpqValuepq95%95%Lower CI Upper CIEnglandÇ116,13420.120.020.2North East .6Newcastle-upon-TyneÇ66724.623.026.2South 21.124.8Country Durham dÇ1,25422.821.723.9Redcar and 529.923.2DarlingtonÇ24221.219.023.7North 322.2Source: NHS Digital, National Child Measurement ProgrammeCompared with Benchmark: Better Similar Worse Not comparedAlthough the previous fgures show us that Darlington’s prevalence of childhood obesity is slightlybelow the regional average they do not tell us if this is evenly spread across the town.24Public health England, Fingertips Tool, NCMP Data, surement-programme14 Childhood Healthy Weight Plan for Darlington 2019 – 2024
The two maps below show the distribution of obesity across Darlington in reception and Year 6. Theyshow that it is not equally distributed across the borough with a concentration in the urban centre andeastern wards.Figure 10: Distribution of obesity across Darlington in Reception25E'J Add anothcrlod[lrato,;,.2.SIUA t1,4HIU1o7.& {M86)UJo9.2 {Ul 9lUio tO-.e ( IA2l!:j1 Hl11Qo1&lNrl!.( 38)fl, S!il.wxt IU. "', .5Figure 11: Distribution of obesity across Darlington in Year 62625Public Health England, Local Health Tool, www.localhealth.org.uk26Public Health England, Local Health Tool, www.localhealth.org.ukChildhood Healthy Weight Plan for Darlington 2019 – 2024 15
This unequal distribution and in particular the apparent link with poverty/deprivation and obesity issupported when the deprivation scores and obesity rates (%) in reception and Year 6 are compared.The fgures below show a correlation between deprivation and obesity in primary school children.Figure 12: Correlation of obese children at reception age with deprivationscore for England Local Authorities27Obese children (4-5 years) / %17.515 12.5 10 I 7.552.510152025303540Deprivation score (IMD 2015) County & UA in England Darlingtony 0.18x 5.38 R 0.65Obese children (10-11 years) / %Figure 13: Correlation of obese children at Year 6 with deprivation score forEngland Local Authorities283025. ·· 2015 101015 T2025 303540Deprivation score (IMD 2015) County & UA in England 25Public Health England, Local Health Tool, www.localhealth.org.uk26Public Health England, Local Health Tool, www.localhealth.org.ukDarlington16 Childhood Healthy Weight Plan for Darlington 2019 – 2024y 0.36x 12 R 0.62
The English Indices of Deprivation 2015 are based on 37 separate indicators, organised acrossseven distinct domains of deprivation which are combined, using appropriate weights, to calculatethe Index of Multiple Deprivation 2015 (IMD 2015). This is an overall measure of multiple deprivationexperienced by people living in an area and is calculated for every Lower layer Super Output Area(LSOA), or neighbourhood, in England. Every such neighbourhood in England is ranked according toits level of deprivation relative to that of other areas.Figure 14: Correlation of obese children at Reception age by DarlingtonWard compared to IMD 2015 score for Ward29compared to IMD 2015 score for W50 IMD 2015 score4540 35 25 20 15 .,,,,.10 50 30 024 .681012141618Obese Children (Reception) %Figure 15: Correlation of obese children at Year 6 age by Darlington Wardcompared to IMD 2015 score for Wards30compared to IMD 2015 score for W50 IMD 2015 score45.40 35 3025,/2015 50 .10/05// / . .1015202530Obese Children (Y6) %29Public Health England, Local Health Tool, www.localhealth.org.uk30Public Health England, Local Health Tool, www.localhealth.org.ukChildhood Healthy Weight Plan for Darlington 2019 – 2024 17
Findings from the HealthyLifestyle Survey inDarlingtonA healthy lifestyle survey has been conductedin primary and secondary schools in Darlingtonsince 2015. The Primary School Healthy LifestyleSurvey 2018/19 took place during September2018 with 23 primary schools in Darlingtonsubmitting survey responses and 2,488 pupils inyear 5 and 6 completing at least one question ofthe survey. Seven questions in this survey relateto exercise and diet and a further fve are relatedto energy drink consumption. The key fndingsinclude: 79% of pupils included, ‘to keep ft andhealthy’ as one of their reasons for exercising. The most popular activity was ‘playing sportsor games’ (74%). 79% of pupils stated they eat a balanced diet.However 51% and 35%, respectively, reportedthat they eat sweets and chocolate and drinkfzzy drinks everyday. 81% of pupils reported eating breakfast everyday. 9% claimed to have energy drinks weekly.However 80% recognised that they were notgood for health.The Secondary School Healthy Lifestyle Survey2018/19 surveyed 4072 children from acrossseven diferent schools. The key fndings include: The most popular activity was ‘walking orrunning around’ (61%). 56% of pupils reported eating breakfasteveryday. 70% of pupils reported that they eat abalanced diet. However, 55% and 41%respectively claimed that they eat sweets andchocolate and fzzy drinks everyday. 20% of pupils reported to have energy drinksweekly, however over 80% recognised thatthey were not good for health.The results indicate that as children move fromprimary to secondary education they are lesslikely to eat breakfast (reduction from 81% to59%) everyday. The consumption of sweets andchocolate and fzzy drinks slightly increases asthey get older.The information from the survey on diet habitse.g. fzzy drink and sweet consumption also hasimplications for oral health as well as maintaininga healthy weight due to the high sugar contentof these foods. Darlington’s oral health planincludes actions to reduce their consumption andtherefore reinforces the recommendations in thishealthy weight plan. 63% of pupils included ‘to keep ft and healthy’as one of their reasons for exercising.18 Childhood Healthy Weight Plan for Darlington 2019 – 2024
To Transform the Environmentso that it supports HealthyLifestyles Understanding andAdapting the ObesogenicEnvironmentIn 2007 the UK government published theForesight report ‘Tackling obesities: futurechoices’ it remains the most comprehensiveinvestigation into obesity and its causes. Itdescribed the complex relations between thesocial, economic and physical environments andindividual factors that underlie the developmentof obesity.31an understanding of the reality of the challenge,consider how the system is operating and wherethere are the greatest opportunities for change.Stakeholders agree actions and decide as apartnership how to work together to bring aboutsustainable change. There are many potentialstakeholders that can contribute to this agenda.There is broad consensus that obesity is theresult of many factors, activities and determinantsand requires action from individuals and widersociety. We must support new ways of making theissue everyone’s business at a local level. In 2017,Public Health England, the Local GovernmentAssociation, Association of Directors of PublicHealth and Leeds Beckett University publisheda briefng for local authorities ‘Making obesityeveryone’s business. A whole systems approachto obesity’. 32 A whole systems approach is anongoing, dynamic and fexible approach thatenables stakeholders to come together, share31Foresight Report: Tackling Obesity: Future Choices’32Local Government Association Making obesity everybody’s business: A whole systems approach to obesityChildhood Healthy Weight Plan for Darlington 2019 – 2024 19
Figure 16: Partnership: The Key to Success33A key action is to adapt the environment so thatit does not promote sedentary behaviour orprovide easy access to energy-dense food. Theaim is to help make the healthy choice the easychoice via environmental modifcation and actionat population and individual levels.Adapting the environment can include thebuilt environment by planning in recreationalgreen space as well as active travel routes. Thegovernment’s public health strategy ‘Healthylives, healthy people’, states that “healthconsiderations are an important part of planningpolicy.”34The healthy choice is even more difcult to makein deprived areas, which have less disposableincome and a higher density of takeaways.36Darlington will seek to transform the environmentso that it supports healthy lifestyles and makehealthier choices easier by focusing on 3 keyareas:1. Out of home food provision2 Access to green space3. Active travel.Reducing the proximity of fast food outlets toschools, colleges, leisure centres and otherplaces where children gather is anotherrecommendation to tackle the obesogenicenvironment.3533Public Health Matters Blog: Designing a ‘whole systems approach’ to prevent and tackle obesity34Healthy Lives: Healthy People35Measuring Up The Medical Profession’s Prescription For The Nation’s Obesity Crisis Academy of Medical Royal Colleges’ 20136Public Health England. (2013) Obesity and the environment: fast food outlets20 Childhood Healthy Weight Plan for Darlington 2019 – 2024
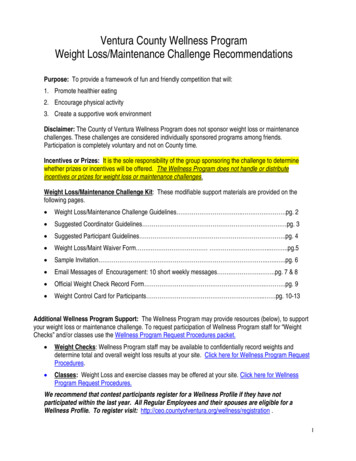
Out of Home Food Provision Public Health England estimated in 2014 that there are over 50,000 fast food and takeawayoutlets, in England. On average, there are more fast food outlets in deprived areas than in moreafuent areas. The increasing consumption of meals out of the home or takeaways has been identifed as animportant factor contributing to rising levels of obesity.37I!I Public Health EnglandM(Jf)31rn!nHeal hmatters Food and drin1k ,environment7a quaneIIo udults/(end on fifth of c HctrenMt food from et.rt oihome food outlets .er!&astonoeew&ekThe increasing constionmeats hasbeen ldfrt.tifled as an important·lo tis· ,Source: PHE, Public Health matters blog: Health Matters: Obesity and the food environment School children make purchases from avariety of food outlets in the school fringeat lunchtime (if there is a no stay on sitepolicy), and during their journeys to andfrom school. Popular purchases includeconfectionery, sugar sweetened drinks andhot food takeaways. Many outlets haveprice promotions on these items particularlytargeted at children and young people.37 Food outlets, including grocers, takeawaysand convenience stores, increasingly clusteraround schools. However, it is not onlythe food environment around schools thatinfuences food purchases and consumptionpatterns, the whole journey environmentneeds to be considered. This includesadvertising in close proximity to schools onbus stops and billboards for example.Government Ofce for Science. Tackling obesities: future choices - project report (2nd edition)Childhood Healthy Weight Plan for Darlington 2019 – 2024 21
A number of studies, prevalence of andmapping exercises suggest that there is agreater number of hot food takeaways andobesity in deprived areas. Information and education are solidfoundations for improving diet, however, agrowing body of evidence suggests that morestructural changes are needed to achievesustained behavioural change. These couldinclude reducing the price of healthier foods,increasing the availability of healthier options,reducing pack size and portion control. Local councils and food businesses (such asfast food takeaways, restaurants, cafes, mobilefood vendors, market stalls, corner shops,convenience stores, leisure centres andchildren’s centres) have great infuence overthe lives of their local community. There are examples of councils working withoutlets to create a healthier food environment.Source: PHE, Public Health matters blog: He
England have higher childhood obesity rates ; can occur for other reasons, independent : than those in lesser deprived areas. At age 5, of neglect. Childhood obesity resulting from : children from the poorest income groups are ; an unhealthy diet and lack of exercise has : twice as likely to be obese compared to their