Transcription
THE RIVER, ITSPOLLUTION ANDWHAT WE CAN DOTO CLEAN ITA Centre for Science and Environment briefing paper
Writer: Sunita NarainEditor: Souparno BanerjeeDesign: Ajit BajajProduction: Rakesh Shrivastava, Gundhar Das 2014 Centre for Science and EnvironmentMaterial from this publication can be used, but withacknowledgement.Maps in this report are indicative and not to scale.Published byCentre for Science and Environment41, Tughlakabad Institutional AreaNew Delhi 110 062Phones: 91-11-29955124, 29955125, 29953394Fax: 91-11-29955879E-mail: cse@cseindia.orgWebsite: www.cseindia.orgPrinted at Multi Colour Services2
THE RIVER, ITSPOLLUTION ANDWHAT WE CAN DOTO CLEAN ITA Centre for Science and Environment briefing paper3
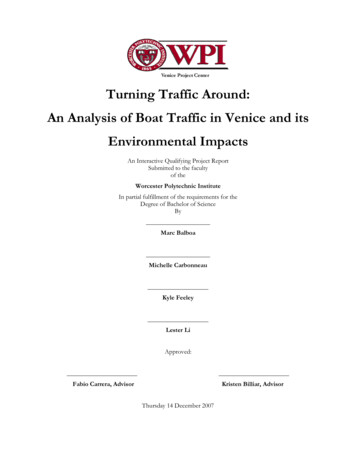
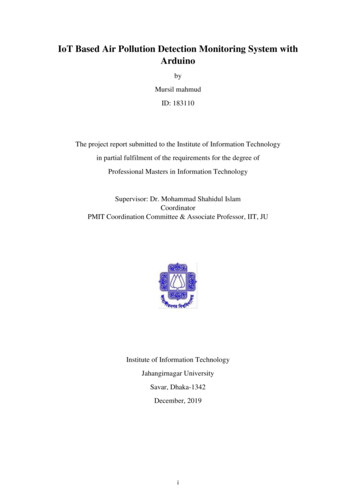
Ganga: the run of the riverPassing through five states, the Ganga covers 26 per cent of the country’s landmass. Despite theenormous amounts of money spent on cleaning it, the river continues to run polluted. Worse, thepollution is increasing even in stretches that were earlier considered clean Numerous hydel projects Decreased environmental flowGangotriDevprayagRishikesh Relatively cleaner But assimilative capacity decreasing Growing pollutionRudraprayagUTTARAKHANDGangaUTTAR PRADESH Growing cities Polluting industriesKanpurSangamAllahabadPatnaMokamaVaranasi BIHARBehramporeVery highpollution levelsJHARKHANDWEST BENGALHighpollution levelsUTTARAKHANDUTTAR PRADESHBIHARJHARKHANDWEST BENGAL450 km1,000 km405 km40 km520 km14 drains440 MLD43 drains3,270 MLD25 drains580 MLDNote: MLD: million litre per day (the figures refer to the collective discharge from the drains into the river)Source: CPCB 2013, Pollution Assessment: River Ganga, Central Pollution Control Board, MoEF, July4DakshineshwarGarden ReachDiamond HarbourUluberia54 drains1,780 MLD
GANGA: THE RIVER, ITS POLLUTION AND WHAT WE CAN DO TO CLEAN ITGanga is India’s largest river basin: it covers 26 per cent of the country’slandmass and supports 43 per cent of its population. In 1986, the government of India launched the Ganga Action Plan (GAP). In August2009, GAP was re-launched with a reconstituted National Ganga RiverBasin Authority. The objectives in the past 30-odd years have remainedthe same: to improve the water quality of the river to acceptable standards(defined as bathing water quality standards) by preventing pollution fromreaching it — in other words, intercepting the sewage and treating it beforedischarge into the river. But despite programmes, funds and some attention,the Ganga still runs polluted. Worse, recent studies show that pollution isincreasing even in the stretches which were earlier considered clean. Whatcan be done? What is the way ahead?This paper puts forward the state of the river and the steps that need to betaken to make Ganga ‘live’ forever.A. PollutionCurrent state, why is it so, and the way aheadThe Ganga Action Plan (GAP-I) had selected 25 towns located along the riverin Uttar Pradesh, Bihar and West Bengal. In 1993, the second phase (GAP-II)continued the programme, but included work on four tributaries of the river —Yamuna, Gomti, Damodar and Mahanadi.In August 2009, the Union government re-launched the Ganga Action Planwith a reconstituted National Ganga River Basin Authority (NGRBA). Underthe notification, dated February 20, 2009, the government gave the river thestatus of a National River. The objective was to ensure abatement of pollutionand conservation of the river. The key difference between the first GangaAction Programme and now, is the recognition that the entire basin of the riverhas to be the basis for planning and implementation. It is not enough to planfor one city’s pollution, without considering the impact of the pollution on thedownstream area. It is accepted that the plan for pollution control must takeinto account the need for adequate water in the river — its ecological flow.How polluted is the river?The challenge of pollution remains grim. According to July 2013 estimates ofthe Central Pollution Control Board (CPCB), fecal coliform levels in the mainstream of the river — some 2,500 km from Gangotri to Diamond Harbour —remain above the acceptable level in all stretches, other than its upper reaches.5
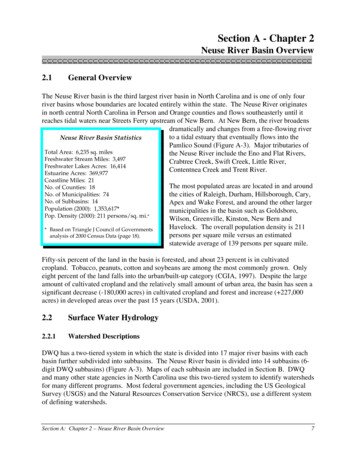
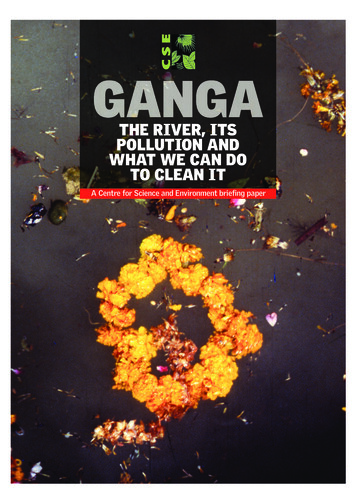
Bhagirathi at GangotriAlaknanda B/C Mandakini at Rudra PrayagMandakini B/C Alaknanda at Rudra PrayagAlaknanda A/C Mandakini at Rudra PrayagAlaknanda B/C to Bhagirathi at DevprayagBhagirathi B/C with Alaknanda at DevprayagAlaknanda A/C with Bhagirathi at DevprayagGanga at Rishikesh U/SGanga A/C of river Song near Satyanarayan temple D/S RaiwalaGanga at Haridwar D/SUpper Ganga river D/S RoorkeeGanga at GarhmukteshwarGanga U/S, AnoopshaharGanga D/S, AnoopshaharGanga at Narora (Bulandsahar), UPGanga at Kachhla Ghat, AligarhGanga at Kannauj U/S (Rajghat)Ganga at Kannauj D/S, UPGanga at Bithoor (Kanpur)Ganga at Kanpur U/S (Ranighat)Ganga at Kanpur D/S (Jajmau pumping station), UPGanga at Dalmau (Rae Bareilly)Ganga at Kala Kankar, Rae BareillyGanga at Allahabad (Rasoolabad), UPGanga at Kadaghat, AllahabadGanga at Allahabad D/S (Sangam), UPGanga U/S, Vindhyachal, MirzapurGanga D/S, MirjapurGanga at Varanasi U/S (Assighat)Ganga at Varanasi D/S (Malviya bridge), UPGanga at Trighat (Ghazipur)Ganga at Buxar, RamrekhaghatGanga at Indrapuri, Dehri-on-SonGanga at the confluence of Son river, Doriganj, ChhapraGanga at Khuri, Patna U/SGanga, Darbhanga ghat at PatnaGanga at Patna D/S (Ganga bridge)Ganga at Punpun, PatnaGanga at FathuaGanga at Mokama (U/S)Ganga at Mokama (D/S)Ganga at MungerGanga at Sultanganj, BhagalpurGanga at BhagalpurGanga at KahalgaonGanga at BaharamporeGanga near Burning GhatGanga at SertamporeGanga at DakshineshwarNabadip on Ganga, Ghoshpara near MonipurghatGanga at Howrah, ShivpurGanga at Garden ReachGanga at UluberiaGanga at Palta, West BengalGanga at Diamond HarbourFecal coliform (PMN /100 ml)Ganga’s journey: Gangotri to Diamond HarbourFecal coliform levels in 2007 and 2011 – even cleaner stretches are becoming polluted6INSTALLED CAPACITY OF STPSOFFICIAL SEWAGE LOADGAP1,208 MLD2,723 MLD55%MEASURED SEWAGE LOADGAP6,087 001,000100101Source: CPCB 2013, Pollution Assessment: River Ganga, Central Pollution Control Board, MoEF, July
GANGA: THE RIVER, ITS POLLUTION AND WHAT WE CAN DO TO CLEAN ITKey problems and approachesThere are three problem areas that need to be addressed in order to find acomprehensive solution to Ganga pollution: The inadequate flow of water in the river, needed to dilute and assimilatewaste The growing quantum of untreated sewage discharged from cities alongthe river The lack of enforcement against point-source pollution from industriesdischarging waste into the river.But even in these reaches, there are worrying signs as fecal coliform levels areincreasing in places like Rudraprayag and Devprayag, suggesting that there isinadequate flow for dilution even in these highly oxygenated stretches (seeGraph: Ganga’s journey: Gangotri to Diamond Harbour).The pollution levels are a cause of worry in the hotspots — the mega and fastgrowing cities — along the river. According to the CPCB’s monitoring data,biological oxygen demand (BOD) levels are high downstream of Haridwar,Kannauj and Kanpur and peak at Varanasi. But what is worrying is that in allthe stretches, pollution is getting worse. This is not surprising given that allalong this heavily populated stretch, freshwater intake from the river is increasing. In this way, water is drawn for agriculture, industry and cities but what isreturned is only waste.Funds have been used up to create infrastructure, without much attentionpaid to the use and efficacy of this hardware. But with all this done, the citiesare still losing the battle with the amount of infrastructure that has yet to bebuilt to convey the sewage and then of course, to treat it and dispose of it.7
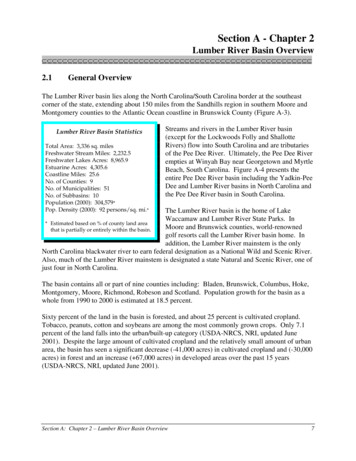
Ecological flow and the need for dilutionRivers have a self-cleansing ability, which allows for assimilation and treatment of biological waste. But in the current context, where withdrawal fromthe river is much higher than the discharge of waste, pollution is inevitable.In the upper reaches of the river, where the oxygenating abilities of the riverare the highest, there are growing signs of contamination. This suggests thateven here, water withdrawal for hydroelectricity is endangering the health ofthe Ganga (see Graph: Annual trend of fecal coliform: the upper reaches).As the river reaches the plains, the water withdrawal peaks for irrigationand drinking water. In this stretch of the river from Rishikesh to Allahabad,there is almost no water during winter and summer months. In other words,the river stops flowing. But the wastewater flow does not ebb. The river thenreceives only waste and turns into a sewer (see Graph: Seasonal mean dischargeinto the Ganga).Graph: Seasonal mean discharge intothe 01,0007,000Source: CPCB 2013, Pollution Assessment: River Ganga, Central PollutionControl Board, MoEF, July86,0005,0004,0003,0002,0001,000Gauging stationSource: CPCB 2013, Pollution Assessment: River Ganga, Central PollutionControl Board, MoEF, JulyAzamabadPatnaBuxar0VaranasiGanga at Rishikesh U/SAlaknanda A/C with Bhagirathi at DevprayagAlaknanda B/C to Bhagirathi at DevprayagBhagirathi at GangotriAlaknanda A/C Mandakini at Rudra PrayagMandakini B/C Alaknanda at Rudra PrayagBhagirathi B/C with Alaknanda at DevprayagAlaknanda B/C Mandakini at Rudra Prayag1Summer (March-May)Mirzapur10Winter (December-February)Rishikesh100Post monsoon 2009Garmukteshwar2008Mean flow (m3/s)Fecal coliform (PMN /100 ml)2007BalawaliGraph: Annual trend of fecalcoliform: the upper reaches
GANGA: THE RIVER, ITS POLLUTION AND WHAT WE CAN DO TO CLEAN ITDomestic sewage and why treatment plants do notsolve the pollution problemDomestic sewage is the major cause of contamination in the river. According tothe CPCB, 2,723 million litre a day (MLD) of sewage is generated by 50 citieslocated along the river, which adds up to over 85 pr cent of the river’s pollutionload.The key problem comes from the main cities on the Ganga. The 36 Class Icities contribute 96 per cent of the wastewater generation. Furthermore, 99 percent of the treatment capacity is installed in these cities. But the problem is thatthe focus on treatment plants has taken away the attention from cleaning theriver. This is what needs to be addressed. But the answers are not just buildingnew sewage treatment plants. The answer lies in the fact that these cities willhave to do sewage management differently. Why?Official % gap:treated vs untreatedThere is a growing gap between installed capacity and treatment55%The most recent assessment shows that there is a massive gap between the generation of domestic sewage and treatment capacity in the main stretch of theGanga. The 2013 CPCB estimate shows that generation is 2,723.30 MLD,while treatment capacity lags behind at 1,208.80 MLD. It is important to compare this with the 2009 estimate (see Table: Sewage generation and treatmentcapacity created in the Ganga), which shows that even as we invest in sewagetreatment capacity, the gap remains the same.According to this estimate, over half the sewage goes untreated into theriver or other water bodies.Unofficial % gap:treated vs untreated80%Even the sewage treatment plants (STPs) built are not workingThe sewage treatment capacity is poor because of factors ranging from lack ofelectricity to operate the plant, to the lack of sewage that reaches the plant fortreatment. The 2013 CPCB report inspected 51 of the 64 sewage treatmentplants (STPs) to find that less than 60 per cent of the installed capacity wasutilised, and 30 per cent of the plants were not even in operation (see Table:Ganga STPs: what works and what does not, as checked by CPCB).Table: Sewage generation andtreatment capacity created in theGanga2009Table: Ganga STPs: what works andwhat does not, as checked by CPCBStates2012No ofInstalledActualTotal noSTPscapacityutilisedof STPs exceedingSewage generation (MLD)2,6382,723inspe-Treatment capacity ( MLD)1,1741,208ctedGap ( MLD)1,4641,5145555% gap: treated vs untreatedSource: CPCB 2009 and 2013capacitySTPsnot inBOD/CODopera-limitstionUttarakhand454-02Uttar Pradesh835828714Bihar514010011West Bengal34457214133Total511,0096021510Note: The CPCB inspected 51 out of 64 STPs on the Ganga in 2012-13Source: CPCB 2013, Pollution Assessment: River Ganga, Central PollutionControl Board, MoEF, July9
Measured sewage flow from138 drainsSewage generation is underestimated and hence the treatmentcapacity needed is much higher6,087MLDThe actual gap between generation and treatment is grossly underestimated.The problem lies in the manner in which governments estimate pollution loadand plan for sewage treatment. The estimation of sewage generation is basedon the quantum of water supplied. The assumption is that 80 per cent of thewater supplied is returned as wastewater. But as cities do not know how muchwater is lost in distribution and how much groundwater is used within theirboundaries, the waste generation estimate could be wide off the mark (seeTable: Difference between actual and measured sewage generation).This shows up in the most recent data collected by CPCB on Ganga. Theactual measured discharge of wastewater into Ganga is 6,087 MLD — which is123 per cent higher than the estimated discharge of wastewater. In otherwords, the gap between treated and untreated waste is not 55 per cent, but 80per cent.According to this, the estimation is that the BOD load is 1,000 tonne/day inthe mainstream of the river.STPs are ineffective because of lack of connectivityMost cities along the Ganga do not have any sewage conveyance systems. InKanpur, Allahabad and Varanasi, 70 to 85 per cent of the city does not have aworking underground drainage system. As a result, drains are not connected toSTPs. What exist are open drains, which make their way into the river. InAllahabad, 57 drains flow into the river; city officials say 10 of these do not addto pollution as their discharge does not reach the river (see Table: Connectivityfor sewage treatment plants: UP cities). But the problem is that this untreatedeffluent adds to the pollution load by contaminating groundwater.Therefore, cities must address the underlying problem of lack of connectivity to sewage systems. This is not done and estimates are prepared, which suggest that cities — old and congested — will be able to lay underground sewageand intercept waste before it reaches the river over time. But experience showsthat building a fully connected system across the city does not happen. The STPis first built, but the drains to intercept sewage do not get completed and theriver continues to be polluted.Varanasi unsewered84%Table: Difference between actualand measured sewage generationOfficialestimateNo ofActualdrains measuredGapof rAllahabad611444095Uttar Pradesh937453,289864072557971West Bengal1,317541,77969Ganga mainstream2,7231386,08780Source: CPCB 2013, Pollution Assessment: River Ganga, Central PollutionControl Board, MoEF, July10City(untreatedUttarakhandBiharTable: Connectivity for sewagetreatment plants: UP citiesVaranasiArea ofArea withUn-Un-city (ha) sewerage seweredseweredarea (%)Drains(ha)area 1,6358,4328423Source: UP government 2010, Presentation made at the meeting of theExecutive Committee of the State Ganga River Conservation Authority,Lucknow, mimeo
GANGA: THE RIVER, ITS POLLUTION AND WHAT WE CAN DO TO CLEAN ITCities lack funds to build and operate STPsThere are three key costs that need to be estimated during project planning.One, the capital cost of building the STP; two, cost of operating the plant; andthree, the cost of intercepting and treating sewage at the plant. Over and abovethese is the cost of maintaining the drainage network. These costs vary,depending on the quality of sewage generated and the effluent standards.The capital costs of STPs, in early 2000, had ranged from Rs 30 lakh to Rs60 lakh per MLD. These costs have now climbed to Rs 1-1.25 crore/MLD, evenwithout the cost of land being included in the project. The operation and maintenance costs, which primarily are electricity, chemicals and labour, are anywhere between Rs 0.60 to Rs 3 per kl, but can increase for tertiary treatment.In the current stretched system, where municipalities are strained to pay forbasic services, running a sewage treatment plant becomes difficult.Also difficult to estimate is the cost of constructing the sewage network,particularly as cities are not greenfield projects; the network needs to be built,or repaired, in already congested areas. If projects under JNNURM-I are usedfor estimation then the average cost of a comprehensive sewage project, including collection network and treatment plant, is anywhere between Rs 3.33-6crore per MLD; the per capita cost would be Rs 4,000. But this is widely considered to be an underestimation as the per capita costs are lower than evenwhat is estimated for a comprehensive water supply scheme — Rs 4,500. Thislack of clarity is understandable because there are few instances where suchcomprehensive sewage systems have been built. An analysis of NGRBA projects shows that costs range from Rs 2.4 crore per MLD in Begusarai to Rs 7.8crore per MLD in Devprayag (see Table: What sewage projects cost, real-time).The payment for the system — capital and O&M —is a key issue of contest between the Central and stategovernments. When it began, the programme wasfunded totally by the Centre. But in early 1990s, states STP cost: Rs 1-1.25 crore/MLDwere asked to invest half the funds. Seven years later,there was a reversal in policy: it was then agreed that Running cost: Rs 0.60-3/kl/daythe Centre would spend 100 per cent of the funds.This arrangement did not last long. In 2001, a newcost-sharing formula was evolved: 70 per cent fundedTable: What sewage projects cost,by Centre and 30 per cent by states. Local bodies werereal-timeexpected to contribute one-third of the state’s share.Project cost1STP capacityCostO&M was also the responsibility of the state and the City(Rs crore)(MLD)(Rs crore/MLD)local body. But this too did not work, because of theBadrinath11.8833.9poor financial state of the municipal bodies.Rudraprayag12.6234.2Under the National Clean Ganga Mission the pay- Karanprayag8.811.46.310.931.47.8ment formula has been re-visited. The Centre will Devprayag279.91584.8build projects through a PPP route, which will require MoradabadBegusarai65.40272.4the concessionaire to design-build-operate the plantsBuxar74.95164.7for five years. The Centre will bear the full costs for five Hajipur113.62225.2years, after which the plant will be handed over to the Munger187.89277.0state government, assuming that in five years, funds1Treatment plant and drainage and pumping stations, under Nationalwill be available to run the plant. It is unclear how that Note:Ganga Basin Authority: sanctioned projects in 2010-2011will work, given the poor financial state of local bodies STP: Sewage treatment plant; MLD: million litre dailySource: Anon 2011, ‘List of approved projects under National Ganga River Basinin all states along the Ganga.Authority (NGRBA)’, MoEF, mimeoWho will pay?11
Industrial pollution: need for eaching& dyeing 11.46796Sugar67Pulp &paperFood,dairy & 01764Industrial pollution into the main Ganga has been an issue of attention andfocus, but without much success. The problem is that many of the industriesthat discharge noxious chemical pollutants into the river are small-scale, wheretechnologies for treatment are inadequate or unaffordable.The 2013 CPCB estimates show that 764 industries in the mainstem ofGanga (and its two tributaries, Kali and Ramganga) consume 1,123 MLD ofwater and discharge 500 MLD of effluent. The bulk of these industries — 90per cent — operate in the Uttar Pradesh stretch of theriver (see Box: UP’s shame: industries that pollute).Graph: Sector-specific industrialThe sector-specific industrial wastewater generawastewater generationtion forming the bulk of the pollution comes from900pulp and paper sector. Tanneries are the highest inIndustrial unitsnumber but have a lower wastewater generation in800Wastewater generation (MLD)comparison. But the problem is that this waste is both700concentrated in stretches of the river where there is no600dilution and assimilative capacity and is particularly500toxic because of its high chemical load (see Graph:400Sector-specific industrial wastewater generation).300Over the past years, many efforts have been made200to reduce the pollution impact of these industries, but100with little success. As a result, the only real difference0is seen when industries are given closure or stop worknotices, as seen during the recent Kumbh mela. But asthis is not a permanent solution, clearly more willneed to be done to find ways to reduce the pollutionSource: CPCB 2013, Pollution Assessment: River Ganga, Central PollutionControl Board, MoEF, Julyfrom these industries, urgently and effectively.UP’S SHAME: INDUSTRIES THAT POLLUTEThis state, which has1,000 km of the river’slength and big cities toboot, also has 687 grosslypolluting industries thatpollute the Ganga. Thesetannery, sugar, pulp andpaper and chemicalindustries contribute 270MLD of wastewater.While tanneries are largein number — 442 — theyonly contribute 8 percent of the wastewaterbut this is highly toxicand concentrated in theKanpur belt. Sugar, pulp12and paper and distilleryplants add up to 70 percent of the wastewater.The inspections by CPCBshowed that of the 404units inspected, only 23required no action. Therest were non-compliantin terms of the laws ofthe country. Up to June2013, enforcement actionwas in various stages, butthis was still to show onthe ground. Clearly,enforcement with bigteeth is the issue at hand(see Table).Table: CPCB action againstindustries polluting the Ganga in UPActionDirection under Section 5 of EnvironmentNo of industries142Protection Act, 1986Directions under Section 18 (1) (b) of12Water Act 1974Letter issued for ensuring compliance25Action under process191Total370Found closed during inspection11No action required23Source: CPCB 2013, Pollution Assessment: River Ganga, Central PollutionControl Board, MoEF, July
MEETA AHLAWAT / CSEGANGA: THE RIVER, ITS POLLUTION AND WHAT WE CAN DO TO CLEAN ITKumbh MelaWhat was done to clean the Ganga and is replication possible?Maha Kumbh in Allahabad has perhaps no parallel in terms of the sheer size of the congregation — withover 100 million people visiting the city of the confluence of the Ganga and Yamuna in just two months. Atthe 2013 Kumbh, the Central and state government’s efforts to combat pollution have had an impact. Thesesteps tell us that it is possible to reduce pollution in the Ganga and all other rivers of the country. The stepstaken were as follows: More water was allowed to flow in the river. The UP government mandated the irrigation department torelease 2,500 cubic feet per second (cusec) (71 cubic metre per second/cumec) from January 1 untilFebruary 28 to ensure adequate depth and dilution of expected pollution loads at the bathing site inAllahabad. Additionally, two days before and one day after each of the six shahi snan days, the stateirrigation department released 11.3 cumec, over and above the minimum stipulated flow. Allahabad broke convention in intercepting sewage from open drains to convey to treatment plants.Given that the city does not have underground sewage, the built plants did not ever work to capacity. Thischanged during the Kumbh as sewage was conveyed and treated, without underground drainage. The city tried experimenting with innovative ways of treating sewage — by using bio-remediation techniques. The preliminary reports suggest that this system is working but needs careful scrutiny and constant monitoring. During the project period the Uttar Pradesh Pollution Control Board (UPPCB) took 19grab samples from the 39 drains, where bio-remediation was being tried. According to their data therewas a 40 per cent reduction in BOD using this technology. A report assessing this technology experimentis awaited, which will help review its effectiveness and options for the future. The government took tough measures against polluting industries — mainly tanneries and distilleries —discharging into the river. In 2012, the Central and state governments had already directed one-fifth ofthe tanneries in the upstream city of Kanpur, which were failing to meet the discharge norms, to shutdown. During the Kumbh a complete closure of all tanneries in the city was ordered.13
What is the solution for Ganga pollution? Whatshould we do?1. Provide for water in the river for ecological flow anddilution.Accept that for cleaning rivers in India, where cost of pollutioncontrol treatment is unaffordable and unmanageable, the availability of water for dilution will be critical. The available standards for ‘acceptable water quality’ provide for a dilution factor of10. This is why discharge standards for waterbodies are set at 30for BOD, while bathing water quality standard is 3 BOD. The factis that given the huge unmet challenge of wastewater treatment,the cost of reducing standards will be unaffordable. Instead, whatshould be provided is water inflow, to build the assimilativecapacity in the river for self-cleansing waste.It is essential to note that rivers without water are drains. It isalso a fact that this release of additional water deprives farmersupstream of irrigation; cities and industries of water. The additional water for ecological flow becomes contested. But this flowmust be mandated so that it comes from the state government’sown allocation of riparian water. The government then has achoice to build storage to collect monsoon water for dilution within its territory or to ‘release’ water to rivers and make other choices for use in agriculture, drinking or industry. In other words, allusers must be forced to plan for water needs based on what theriver can spare, not what they can snatch.MandateEcologicalflowTie fundingTo quantumof flow14Action plan: Ecological flow will be mandatory in all stretches ofthe river. In the upper stretches, where the requirement is for critical ecological functions as well as societal needs, it will be mandated at 50 per cent for mean season flow and 30 per cent forother seasons. In the urbanised stretches, it will be mandatedbased on the quantum of wastewater released in the river and calculated using a factor of 10 for dilution.All Central government funding under the National Missionfor Clean Ganga will be conditional on the quantum of ecologicalflow made available by the state.2. Accept that urban areas will not catch up with theinfrastructure to build conventional sewage networks atthe scale and pace needed for pollution control.Therefore, the conveyance of waste must be re-conceptualised andimplemented at the time of planning treatment plants. This willthen lead to innovative ideas for controlling pollution in drains —
GANGA: THE RIVER, ITS POLLUTION AND WHAT WE CAN DO TO CLEAN ITin situ — treatment of sewage as well as local treatment and reuse.Also, as the plans are premised on the acceptance of non-availability of sewerage networks, the discharge of treated effluent willbe carefully reconsidered and designed. The treated effluent willnot be ‘mixed’ with the untreated waste in drains. Instead, alltreated effluent will either be designed for reuse or it will be discharged directly into the n plan:1. Do not plan for STPs; instead plan for drains that are discharging into the Ganga. Prioritise action based on drains withhigh pollution load, so that impact is immediate.2. Make a drain-wise plan, which looks to treat waste withoutfirst building the internal conveyance system. Plan for interception and pumping to sewage treatment plant. Also plan forin situ drain treatment, as it will bring down pollution levels ofdischarge that is not intercepted. Bottom-line, use the opendrain for treatment of waste. This is the reality that we cannotignore.3. Ensure that there is a plan for treated effluents — do not treatand put back treated wastewater into open drain, where it isagain mixed with untreated waste. Instead, plan deliberatelyfor utilisation or disposal of treated effluent.4. Plan the reuse and recycling of treated effluent, either for citywater use or agricultural use. Plan deliberately. Implement thisobjective.5. Plan to treat wastewater before it discharges into the river.Either intercept drain before discharge to treatment plant orbuild treatment plant on the bank of the river for the remaining waste.6. No untreated waste should be disposed into river. The provision for ecological flow for assimilation of waste will be criticalfor setting standards for discharge. If there is no water in theriver, only waste that is discharged, then standards have to beso stringent that they can meet bathing or even drinking waterquality. This will be prohibitively expensive and it makes noeconomic sense (in a poor country) to clean wastewater todrinking water quality and then not use it for this purpose.7. If all this is not acceptable, or does not get operationalised,then the only alternative for river cleaning is to ask cities to gettheir water supply downstream of their discharge points. Inother words, they will have to use their wastewater and theninvest to clean it to turn it into drinking water for their citizens.15
TightenEnforcementOtherwise, we must learn that we all live downstream. Today,each city’s waste is fast becoming the next city’s water supply.
As the river reaches the plains, the water withdrawal peaks for irrigation and drinking water. In this stretch of the river from Rishikesh to Allahabad, there is almost no water during winter and summer months. In other words, the river stops flowing. But the wastewater flow does not ebb. The river then