Transcription
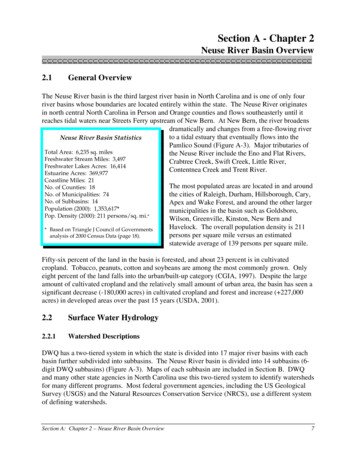
Section A - Chapter 2Neuse River Basin Overview 2.1General OverviewThe Neuse River basin is the third largest river basin in North Carolina and is one of only fourriver basins whose boundaries are located entirely within the state. The Neuse River originatesin north central North Carolina in Person and Orange counties and flows southeasterly until itreaches tidal waters near Streets Ferry upstream of New Bern. At New Bern, the river broadensdramatically and changes from a free-flowing riverto a tidal estuary that eventually flows into theNeuse River Basin StatisticsPamlico Sound (Figure A-3). Major tributaries ofTotal Area: 6,235 sq. milesthe Neuse River include the Eno and Flat Rivers,Freshwater Stream Miles: 3,497Crabtree Creek, Swift Creek, Little River,Freshwater Lakes Acres: 16,414Contentnea Creek and Trent River.Estuarine Acres: 369,977Coastline Miles: 21No. of Counties: 18No. of Municipalities: 74No. of Subbasins: 14Population (2000): 1,353,617*Pop. Density (2000): 211 persons/sq. mi.** Based on Triangle J Council of Governmentsanalysis of 2000 Census Data (page 18).The most populated areas are located in and aroundthe cities of Raleigh, Durham, Hillsborough, Cary,Apex and Wake Forest, and around the other largermunicipalities in the basin such as Goldsboro,Wilson, Greenville, Kinston, New Bern andHavelock. The overall population density is 211persons per square mile versus an estimatedstatewide average of 139 persons per square mile.Fifty-six percent of the land in the basin is forested, and about 23 percent is in cultivatedcropland. Tobacco, peanuts, cotton and soybeans are among the most commonly grown. Onlyeight percent of the land falls into the urban/built-up category (CGIA, 1997). Despite the largeamount of cultivated cropland and the relatively small amount of urban area, the basin has seen asignificant decrease (-180,000 acres) in cultivated cropland and forest and increase ( 227,000acres) in developed areas over the past 15 years (USDA, 2001).2.2Surface Water Hydrology2.2.1Watershed DescriptionsDWQ has a two-tiered system in which the state is divided into 17 major river basins with eachbasin further subdivided into subbasins. The Neuse River basin is divided into 14 subbasins (6digit DWQ subbasins) (Figure A-3). Maps of each subbasin are included in Section B. DWQand many other state agencies in North Carolina use this two-tiered system to identify watershedsfor many different programs. Most federal government agencies, including the US GeologicalSurvey (USGS) and the Natural Resources Conservation Service (NRCS), use a different systemof defining watersheds.Section A: Chapter 2 – Neuse River Basin Overview7
Figure A-3General Map of the Neuse River roFremontVarinaAngierPrincetonFour Oaks03-04-07WintervilleGREENEPikevilleAydenSnow vSFarmvilleEurekaSmithfieldGriftonBensonWAYNELa usNeDoverMesic03-04-08SpringsGroveLENOIRCove Subbasin BoundaryTrentPinkTrentonHillSAMPSON03-04-11County 10MunicipalityCARTERETONSLOWPlanning BranchBasinwide Planning Program Unity Picture September 9, TFountainWILSONGarnerHolly2002040Miles
Under the federal system, the Neuse River basin is made up of hydrologic areas referred to ashydrologic units (USGS 8-digit hydrologic units). The Neuse River basin is made up of fourwhole hydrologic units: the Upper Neuse, Middle Neuse, Contentnea and Lower Neuse. Thelower part of the basin also contains portions of the Pamlico and Bogue-Core Sounds hydrologicunits. Hydrologic units are further divided into smaller watershed units (14-digit hydrologicunits) that are used for smaller scale planning like that done by NCWRP (page 203). There are201 watershed units in the basin. Table A-3 compares the three systems.2.2.2Hydrologic FeaturesThere are 3,497 freshwater stream miles, 16,414 acres of freshwater reservoirs and lakes (TableA-4), 369,977 estuarine acres, and 21 miles of Atlantic coastline in the Neuse River basin. Thereare also countless miles of unmapped small perennial, intermittent and ephemeral streams. Thelower Neuse River basin contains extensive wetland communities also. The basin starts in theeastern Piedmont physiographic region with about two-thirds of the basin in the Coastal Plain.Streams in the Piedmont are typically low gradient with sluggish pools separated by riffles withoccasional small rapids. Piedmont soils are highly erodible and are underlain by fractured rockformations that have limited water storage capacity. Piedmont streams tend to have low summerflows and limited ability to assimilate oxygen-consuming wastes. There are no natural lakes inthe Piedmont. There are several significant reservoirs that serve as water supplies and floodcontrol structures. There are many old millponds and beaver impoundments scattered acrosswatersheds in the region.Streams in the Coastal Plain are slow-moving blackwater streams, low-lying swamps andproductive estuarine waters. The Coastal Plain is flat and the larger waterbodies are meanderingand often lined with swamps and bottomland hardwoods. The swamp streams often stop flowingin the summer and are stained by tannic acid. These streams have limited ability to assimilateoxygen-consuming wastes. Swamp streams often have naturally low dissolved oxygen and pH.Coastal Plain soils are deep sands that have a high groundwater storage capacity. Because of theflat topography and high groundwater supply, there are few reservoirs in the Coastal Plain.Natural lakes include the remnants of bay lakes in the lower Coastal Plain.There are 19 major reservoirs in the Neuse River basin. Most of them are located in the upperportion of the basin. The largest is Falls of the Neuse (Falls Lake) which is managed by the USArmy Corps of Engineers for flood control and is the City of Raleigh water supply. In additionto general protection of aquatic life and secondary recreation, six lakes are classified for primaryrecreation and 14 are designated drinking water supplies (Table A-4).Section A: Chapter 2 – Neuse River Basin Overview9
Table A-3Hydrologic Subdivisions in the Neuse River BasinWatershed Nameand Major TributariesUpper NeuseFalls Lake and Little,Eno and Flat RiversDWQSubbasin6-digitCodesUSGS 8digitHydrologicUnitsUSGS 14-digitHydrologic UnitsLocal Watersheds*0302020103-04-01010010, 060010, 020020, 050040, 010030, 030030, 065030,010040, 040020, 020040, 065010, 020010, 030020, 0650040,010020, 060020, 065050, 010050, 030040, 050010, 010010,020030, 050030, 050020, 030010, 030050, 060030Crabtree Creek andSwift Creek03-04-02070060, 070110, 0110040, 080020, 0110010, 0100040, 070070,100020, 100050, 070090, 100030, 110070, 080010, 090010,110050, 070100, 110020, 140020, 070080, 100010, 110060,070120, 110030, 140010Middle Creek andBass Lake03-04-03100010, 120020, 120030Black Creek andHannah Creek03-04-04130010, 130020, 130030, 150010, 150020, 150050, 150030,150040Little River andBuffalo Creek03-04-06Neuse River03-04-12180010, 180070, 180040, 180050, 180060, 200010, 180020,190010, 200020, 180030, 180080160010, 170020, 170030, 200030, 170040, 200040, 170010,170060, 170050Middle NeuseBear Creek andStone CreekCore CreekSwift Creek andClayroot SwampContentneaContentnea Creek andLittle ContentneaCreek0302020203-04-05010010, 030030, 020030, 040010, 040020, 020030, 060040,030020, 070010, 020020, 010021, 060030, 050020, 060020,030010, 020010, 050030, 010040, 040030, 060010, 030040,010020, 010030, 050040, 010022, 050010, 070020, 01005003-04-08090020, 080020, 080010, 100020, 090080, 10001003-04-09090010, 090030, 090040, 090050, 090055, 090060, 0900700302020303-04-07010010, 010020, 020010, 020020, 020030, 020040,020050,030010, 030020, 030030, 030040, 040010, 040020,040030, 040040, 050010, 050020, 050030, 050040, 050050,050060, 060010, 060020, 060030, 060040, 060040, 060050,070010, 070020, 070030, 070040, 070050Lower NeuseSlocum Creek03-04-10020010, 020020, 020030, 020040, 020050, 020060, 030010,030020, 030030, 030040, 030050, 040010, 050010, 050020,050030, 050040, 050050, 060010, 060020, 070010Trent River03-04-11010010, 010020, 010021, 010030, 010031, 010040, 010050, 01051,010060, 010070, 010071, 010080, 010100Pamlico SoundPamlico SoundBay RiverBogue-Core SoundsCore SoundWest Bay030202040302010503-04-13010010, 010020, 010030, 010040, 020010, 020020, 020030,0900120302010603-04-14050010, 050050, 050060, 050070* Numbers from the 8-digit and 14-digit column make the full 14-digit HU.Section A: Chapter 2 – Neuse River Basin Overview10
Table A-4Statistics for Major Lakes in the Neuse River BasinSubbasin/LakeSurfaceMeanVolume Watershed632Area (ac) Depth (ft) (X 10 m )(mi leOrangeOrangeOrangeWakeWS-III NSW CAWS-II NSW CAWS-II NSW CAWS-II NSW CAWS-II NSW CAWS-II NSW CAWS-II NSW CAWS-III NSW eWakeWakeWakeWS-III NSW CAWS-III NSWB NSWB NSWB NSWWS-III NSWB .4WayneB NSW9.929.50.10.4WilsonWilsonWilsonWS-III NSWWS-III NSW CAWS-III NSW -01Lake MichieLittle River ReservoirLake ButnerLake RogersLake Ben JohnsonLake OrangeCorporation LakeFalls of the Neuse Reservoir03-04-02Lake BensonLake WheelerBig LakeReedy Creek LakeSycamore LakeApex ReservoirLake Crabtree03-04-05Cliffs of the Neuse Lake03-04-07Lake WilsonToisnot ReservoirWiggins Mill Reservoir* Refer to page 44 for more information.2.2.3Minimum StreamflowOne of the purposes of the Dam Safety Law is to ensure maintenance of minimum streamflowsbelow dams. Conditions may be placed on dam operations specifying mandatory minimumreleases in order to maintain adequate quantity and quality of water in the length of a streamaffected by an impoundment. The Division of Water Resources, in conjunction with the WildlifeResources Commission, recommends conditions relating to release of flows to satisfy minimuminstream flow requirements. The Division of Land Resources issues the permits.The US Army Corps of Engineers operates Falls Lake dam (subbasin 03-04-01) in Wake Countyon the Neuse River. The drainage area is 769.9 square miles and has minimum releaserequirements of 65 cfs (cubic feet/second) from November to March and 100 cfs from April toOctober. The target flow below the dam at Clayton is 184 cfs from November to March and 254cfs from April to October. During extreme drought conditions the flows may be lower.The City of Wilson operates Buckhorn Reservoir dam (subbasin 03-04-07) on Contentnea Creek.Minimum release requirements are 7.6 cfs when water supply storage is above 70 percent. WhenSection A: Chapter 2 – Neuse River Basin Overview11
water supply storage is below 70 percent and above 50 percent, 5.3 cfs minimum flow isrequired. Below 50 percent of water supply storage, a 1.4 cfs minimum flow is required.Bass Lake (subbasin 03-04-02) operated by the Town of Holly Springs on Basal Creek has aminimum release of 5.2 cfs or inflow, whichever is less.Presentwood Lakes No. 1 and No. 2 (subbasin 03-04-02) in Cary on Crabtree Creek have aminimum release of 0.2 cfs or inflow, whichever is less, from June to February and 0.4 cfs orinflow, whichever is less, from March to May.Little River dam at Orange Factory (subbasin 03-04-01) in Durham County has a minimumrelease of 6 cfs from December to May and 2 cfs from June to November. A minimum release of0.64 cfs is required when normal pool elevation is less than 70 percent of usable storage capacity.Minimum flows on the Eno River are complicated and determined by two different methods.Table A-5 summarizes withdrawals and instream flow requirements for the portion of the EnoRiver above Durham.Table A-5Maximum Allowable Surface Water Withdrawals and Instream FlowRequirements for the Western Eno River (NCDENR-DWR, October 2001)Instream Flow Requirement atHillsborough Gage(MGD)Allowable Surface Water Withdrawal(MGD)Percent ofStorageRemaining atLake OrangeTown of†Hillsborough eFromWest ForkEno ReservoirTotal Flow atHillsboroughGage***1.100.651.75Stage 1100 - 801.51†0.820.431.100.651.75Stage 280 - 651.10Stage 360 - 50Stage 450 - 401.28†0.700.320.450.651.10Stage 540 - ge 6 30Notes:†Allowable withdrawals for Hillsborough shown above do not include withdrawals of water supply releases from West Fork Eno Reservoir.* - Adjusted to reflect outside source agreement for Hillsborough and Orange-Alamance.- Excess withdrawals from Eno River based on outside source agreement may be made when flows at the Eno River at Hillsborough Gageare 10 cubic feet per second (cfs) and above, regardless of water level in Lake Orange. Maximum withdrawals shall be limited to the totalof the contract amount and the allocated amount.- A low flow period will begin on the 7th consecutive day of the average daily flow at the Hillsborough Gage dropping below 10 cfs. Onthe 4th day, the Orange County Engineer will request that affected parties prepare for a low flow period.- When flows are between 10 cfs and 3 cfs at the Hillsborough Gage during a low flow period, withdrawals from the Eno River shall belimited to the Stage 1 amount shown above (100-80 percent of storage remaining), regardless of water level in Lake Orange.- When flows are below 3 cfs at the Hillsborough Gage during a low flow period, withdrawals shall be limited to amounts shown above forpercent of storage remaining at Lake Orange.- A low flow period will be terminated when average daily flow at the Hillsborough Gage registers 10 cfs or greater for a period of 7consecutive days. The Orange County Engineer will notify affected parties when the low flow period is terminated.**For Piedmont Minerals: When flows at the Hillsborough Gage are 14 cfs and above, withdrawals from the Eno River will be limited to900,000 gallons per day (GPD). Between 14 cfs and 4 cfs, withdrawals will be limited to 430,000 GPD, regardless of water level in LakeOrange. Below 4 cfs, withdrawals will be limited to amounts shown above for percent of storage remaining.Section A: Chapter 2 – Neuse River Basin Overview12
2.2.4Water WithdrawalsPrior to 1999, North Carolina required water users to register their water withdrawals with theDivision of Water Resources (DWR) only if the amount was 1,000,000 gallons or more ofsurface water or groundwater per day. In 1999, the registration threshold for all water usersexcept agriculture was lowered to 100,000 gallons per day.There are 176 registered water withdrawals in the Neuse River basin not including thoseassociated with the 78 public water systems discussed below. Fifty-one of these are surfacewater withdrawals. Excluding the public water systems or power generating facilities, there is acumulative permitted capacity to withdraw 192 MGD of water. For more information on waterwithdrawals, visit http://www.dwr.ehnr.state.nc.us/ or call DWR at (919) 733-4064.2.2.5Interbasin TransfersIn addition to water withdrawals (discussed above), water users in North Carolina are alsorequired to register surface water transfers with the Division of Water Resources if the amount is100,000 gallons per day or more. In addition, persons wishing to transfer two million gallons perday (MGD) or more, or increase an existing transfer by 25 percent or more, must first obtain acertificate from the Environmental Management Commission (G.S. 143-215.22I). The riverbasin boundaries that apply to these requirements are designated on a map entitled Major RiverBasins and Sub-Basins in North Carolina, on file in the Office of the Secretary of State. Theseboundaries differ from the 17 major river basins delineated by DWQ. The 8-digit hydrologicunit boundaries (Table A-3) correspond to these basins within the Neuse River basin. Table A-6summarizes IBTs involving the Neuse River basin.In determining whether a certificate should be issued, the state must determine that the overallbenefits of a transfer outweigh the potential impacts. Factors used to determine whether acertificate should be issued include: the necessity, reasonableness and beneficial effects of the transfer;the detrimental effects on the source and receiving basins, including effects on water supplyneeds, wastewater assimilation, water quality, fish and wildlife habitat, hydroelectric powergeneration, navigation and recreation;the cumulative effect of existing transfers or water uses in the source basin;reasonable alternatives to the proposed transfer; andany other facts and circumstances necessary to evaluate the transfer request.A provision of the interbasin transfer law requires that an environmental assessment orenvironmental impact statement be prepared in accordance with the State Environmental PolicyAct as supporting documentation for a transfer petition. For more information on waterwithdrawals, visit http://www.ncwater.org or call DWR at (919) 733-4064.Section A: Chapter 2 – Neuse River Basin Overview13
Table A-6Estimated Interbasin Transfers in the Neuse River Basin ReceivingSubbasinEstimatedTransfer (MGD)Cary/ApexCary/ApexHaw RiverNeuse River12.1Cary/ApexMorrisvilleHaw RiverNeuse River 0.1DunnBensonCape Fear RiverNeuse River1.2DurhamDurhamNeuse RiverHaw River18.7Franklin CountyYoungsvilleTar RiverNeuse River 0.1Johnston CountyFuquay-VarinaNeuse RiverCape Fear River0.25Orange-Alamance W.S.Orange-Alamance W.S.Neuse RiverHaw River0.5RoxboroRoxboroRoanoke RiverNeuse River 0.1ZebulonZebulonNeuse RiverContentnea Creek0.82.2.6Water SupplyThe following is summarized from the North Carolina Water Supply Plan developed by theDivision of Water Resources (DWR) for the Neuse River basin (NCDENR-DWR, January2001). The information is compiled from Local Water Supply Plans submitted to DWR by 78public water systems.Total water use in the Neuse River basin is reported to be approximately 191 MGD. Residentialdemand accounted for 79 MGD. Public water systems supplied 82 MGD from surface water and30 MGD from groundwater. Self-supplied water accounted for 77 MGD. For more informationor to view local water supply plans, visit http://www.dwr.ehnr.state.nc.us/ or call DWR at (919) 7334064.2.3Population and Growth TrendsBelow are three different ways of presenting population data for the Neuse River basin.Population data presented by county allow for analysis of projected growth trends in the basinbased on Office of State Planning information (April and May 2001). Data presented bymunicipality summarizes information on past growth of large urban areas in the basin. The datadeveloped by Triangle J Council of Governments allow for 2000 population data to be presentedby watershed units and by subbasin. While the three different sets of information cannot bedirectly compared, general conclusions are apparent by looking at the information. Countieswith the highest expected growth are associated with the largest municipal areas and the mostdensely populated watersheds in the basin.2.3.1County Population and Growth TrendsTable A-7 shows the projected population for 2020 and the change in growth between 2000 and2020 for counties that are wholly or partly contained within the basin. Since river basinboundaries do not coincide with county boundaries, these numbers are not directly applicable toSection A: Chapter 2 – Neuse River Basin Overview14
the Neuse River basin. This information is intended to present an estimate of expectedpopulation growth in counties that have some land area in the Neuse River basin.Table A-7CountyPast and Projected Population (1990, 2000, 2020) and Population Change byCountyPercent ofCountyin Basin 19902000EstimatedPopulation2020EstimatedPop Change1990-2000EstimatedPop ubtotal Source: North Carolina Center for Geographic Information and AnalysisNote: The numbers reported reflect county population; however, these counties are not entirely within the basin.The intent is to demonstrate growth for counties located wholly or partially within the basin.Populations of counties that are wholly or partly contained within the basin increased by over414,000 people between 1900 and 2000. Figure A-4 presents projected population growth bycounty (2000-2020) for the Neuse River basin based on information developed by Triangle JCouncil of Governments. Durham, Johnston and Wake are growing the fastest in the upperbasin, with Pitt County growing the fastest in the lower basin. The county populations areexpected to grow by more than 867,000 by 2020 to almost three million people. With theincreased population there will be increased drinking water demands and wastewater discharges.There will also be loss of natural areas and increases in impervious surfaces associated withconstruction of new homes and businesses.For more information on past, current and projected population estimates, contact the Office ofState Planning at (919) 733-4131 or visit their website at http://www.ospl.state.nc.us/demog/.Section A: Chapter 2 – Neuse River Basin Overview15
Figure A-4PERSON20-30%40-50%ORANGEPercent Projected County Population Growth (2000-2020)GRANVILLEin the Neuse River E70 %WILSONJOHNSTON70 ICO10-20%Subbasin BoundaryCounty BoundaryPlanning BranchBasinwide Planning Program Unity Picture September 9, 2002200E2040 MilesCARTERET10-20%
2.3.2Municipal Population and Growth TrendsTable A-8 presents population data from Office of State Planning for municipalities withpopulations greater than 2,000 persons, located wholly or partly within the basin. The highesturban population growth has occurred in the upper basin around Raleigh, Cary and Durham.Table A-8Population (1980, 1990, 2000) and Population Change for Municipalities GreaterThan 2,000 Located Wholly or Partly in the Neuse River BasinMunicipalityCountyApr-80Apr-90Apr-2000Apex ÂAydenBenson ÂCary ÂClaytonCreedmoorDurham ÂFarmvilleFuquay-Varina ÂGarnerGoldsboroGreenville ÂGriftonHavelockHillsboroughHolly Springs ÂKinstonKnightdaleLa GrangeMorrisville ÂMount Olive ÂNew BernRaleighRiver BendRoxboro ÂSelmaSmithfieldTrent WoodsWake tonChatham, WakeJohnstonGranvilleDurham, Orange, rWakeLenoirDurham, WakeDuplin, akeWakeWilsonPittJohnston, 19212,5884,24744,4054,7914,046Percent Change Percent 230.221.418.628.652.777.2115.845.420.256.127.5 - The numbers reported reflect municipality population; however, these municipalities are not entirely within the basin.The intent is to demonstrate growth for municipalities located wholly or partially within the basin.Section A: Chapter 2 – Neuse River Basin Overview17
Apex, Cary, Holly Springs, Knightdale, Morrisville and Wake Forest had very high growth rates.Raleigh and Durham also increased population substantially in the last ten years.2.3.3Basin Population and Population DensityMost population data are collected from within county or municipal boundaries. It is difficult toevaluate population and population density within watersheds using this information.Information on population density at a watershed scale is useful in determining what streams arelikely to have the most impacts as a result of population growth. This information is also usefulin identifying stream segments that have good opportunities for preservation or restoration. TheTriangle J Council of Governments has used GIS to present 2000 census block data by watershedunits (Figure A-5). This information is presented to summarize population and populationdensity by each subbasin and for the entire basin.The overall population of the basin based on Triangle J Council of Governments analysis is1,353,617, with approximately 211 persons/square mile. Stoney Creek (subbasin 03-04-05) isthe most densely populated local watershed with 2,573 persons/square mile. Fifty-four percentof the basin population is located in 10 percent of the basin land area. The watersheds with thehighest population densities are near Raleigh, Durham, Goldsboro, Kinston, New Bern andWilson.2.4Local Governments and Planning Jurisdictions in the BasinThe Neuse River basin encompasses all or portions of 18 counties and 74 municipalities. TableA-9 provides a listing of these municipalities, along with the regional planning jurisdiction(Council of Governments). Twelve municipalities are located in more than one major riverbasin.Section A: Chapter 2 – Neuse River Basin Overview18
Figure A-5 Population Density by 14-digit Hydrologic UnitFigure A. Census 2000 Population Densityby Hydrologic Unitforthe Neuse RiverBasinNeuse RiverBasinin North CarolinaLEGENDPersons/AcrePersons/Sq.Mile0 -0.10 -640.1-0.2564 -1600.25 -0.5160 -3200.5 -2.5320 -16002.5 -51600 -3200County BoundariesNWE1001020304050 M ilesSPrepared by Triangle J CouncilofGovernm ents; Decem ber2001c:\gis\ncdata\co-c2k.apr
Table A-9CountyLocal Governments and Planning Units within the Neuse River eCravenPBridgeton, Cove City, Dover, Havelock, New Bern, River Bend, Trent Woods, VanceboroDuplinPMount Olive * DurhamJDurham * , Morrisville * FranklinKYoungsville GranvilleKCreedmoor, StemGreenePHookerton, Snow Hill, WalstonburgJohnstonJJonesPBenson , Clayton, Four Oaks, Kenly *, Micro, Pine Level, Princeton, Selma, Smithfield,Wilson’s Mills, Zebulon *Pollocksville, TrentonLenoirPKinston, La Grange, Pink HillNashLBailey, MiddlesexOrangeJDurham * , HillsboroughPamlicoPPersonKAlliance, Arapahoe, Bayboro, Grantsboro, Mesic, Minnesott Beach, Oriental, Stonewall,VandemereRoxboro PittQAyden, Farmville, Fountain , Greenville , Grifton, WintervilleWakeJWaynePApex , Cary * , Durham * , Fuquay Varina , Garner, Holly Springs , Knightdale,Morrisville * , Raleigh, Rolesville, Wake Forest, Wendell, Zebulon *Eureka, Fremont, Goldsboro, Mount Olive * , Pikeville, Seven Springs, Walnut CreekWilsonLBlack Creek, Kenly *, Lucama, Saratoga, Sims, Stantonsburg, Wilson*Located in more than one county. Located in more than one major river basin.Note: Counties adjacent to and sharing a border with a river basin are not included as part of that basin if only a trace amount ofthe county ( 2 percent) is located in that basin, unless a municipality is located in that county. (Note: Duplin County isincluded because of the municipality, Mount Olive. Also, Cary is located in Chatham County, which is not a countywithin the Neuse River basin.)RegionJKLPQ2.5NameTriangle J Council of GovernmentsKerr-Tar Regional Council of GovernmentsUpper Coastal Plain Council of GovernmentsEastern Carolina CouncilMid-East CommissionLocationResearch Triangle ParkHendersonRocky MountNew BernWashingtonLand CoverLand cover can be an important way to evaluate the effects of land use changes on water quality.Unfortunately, the tools and database to do this on a watershed scale are not yet available. Parts2.5.1 and 2.5.2 below describe two different ways of presenting land cover in the Neuse Riverbasin. The CGIA land cover information is useful in providing a snapshot of land cover in thebasin from 1993 to 1995. This information is also available in a GIS format so it can bemanipulated to present amounts of the different land covers by subbasin or at the watershedSection A: Chapter 2 – Neuse River Basin Overview20
scale. The NRI land cover information is presented only at a larger scale (8-digit hydrologicunit), but the collection methods allow for between year comparisons. The two datasets cannotbe compared to evaluate land cover data. Th
At New Bern, the river broadens dramatically and changes from a free-flowing river to a tidal estuary that eventually flows into the Pamlico Sound (Figure A-3). Major tributaries of the Neuse River include the Eno and Flat Rivers, Crabtree Creek, Swift Creek, Little River, Contentnea Creek and Trent River. The most populated areas are located .