Transcription
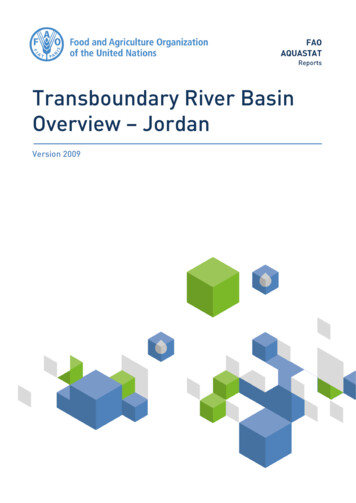
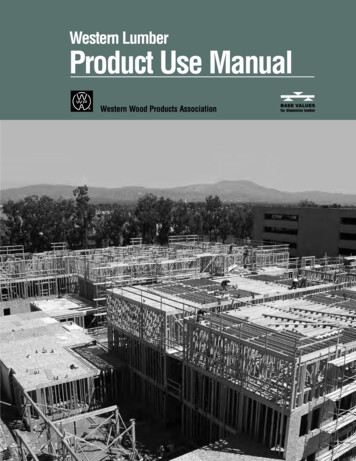
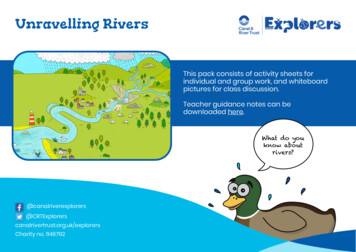
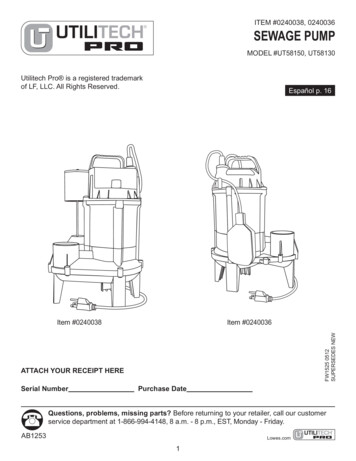
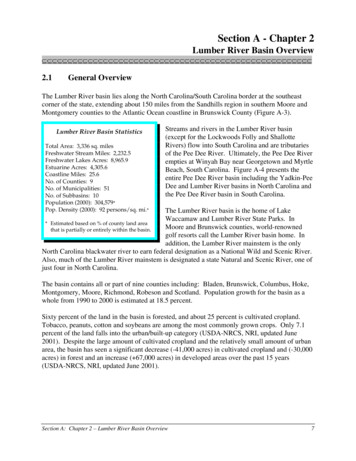
Section A - Chapter 2Lumber River Basin Overview 2.1General OverviewThe Lumber River basin lies along the North Carolina/South Carolina border at the southeastcorner of the state, extending about 150 miles from the Sandhills region in southern Moore andMontgomery counties to the Atlantic Ocean coastline in Brunswick County (Figure A-3).Lumber River Basin StatisticsTotal Area: 3,336 sq. milesFreshwater Stream Miles: 2,232.5Freshwater Lakes Acres: 8,965.9Estuarine Acres: 4,305.6Coastline Miles: 25.6No. of Counties: 9No. of Municipalities: 51No. of Subbasins: 10Population (2000): 304,579*Pop. Density (2000): 92 persons/sq. mi.*Streams and rivers in the Lumber River basin(except for the Lockwoods Folly and ShallotteRivers) flow into South Carolina and are tributariesof the Pee Dee River. Ultimately, the Pee Dee Riverempties at Winyah Bay near Georgetown and MyrtleBeach, South Carolina. Figure A-4 presents theentire Pee Dee River basin including the Yadkin-PeeDee and Lumber River basins in North Carolina andthe Pee Dee River basin in South Carolina.The Lumber River basin is the home of LakeWaccamaw and Lumber River State Parks. In* Estimated based on % of county land areaMoore and Brunswick counties, world-renownedthat is partially or entirely within the basin.golf resorts call the Lumber River basin home. Inaddition, the Lumber River mainstem is the onlyNorth Carolina blackwater river to earn federal designation as a National Wild and Scenic River.Also, much of the Lumber River mainstem is designated a state Natural and Scenic River, one ofjust four in North Carolina.The basin contains all or part of nine counties including: Bladen, Brunswick, Columbus, Hoke,Montgomery, Moore, Richmond, Robeson and Scotland. Population growth for the basin as awhole from 1990 to 2000 is estimated at 18.5 percent.Sixty percent of the land in the basin is forested, and about 25 percent is cultivated cropland.Tobacco, peanuts, cotton and soybeans are among the most commonly grown crops. Only 7.1percent of the land falls into the urban/built-up category (USDA-NRCS, NRI, updated June2001). Despite the large amount of cultivated cropland and the relatively small amount of urbanarea, the basin has seen a significant decrease (-41,000 acres) in cultivated cropland and (-30,000acres) in forest and an increase ( 67,000 acres) in developed areas over the past 15 years(USDA-NRCS, NRI, updated June 2001).Section A: Chapter 2 – Lumber River Basin Overview7
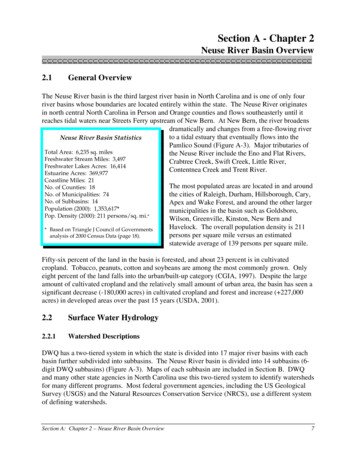
Figure A-3 General Map of the Lumber River Basinin North ROBESON03-07-53Tar erroGordoWhitevilleChadbournBrunswickFair or CityBRUNSWICK03-07-57LegendCarolinaShoresRiver Basin BoundarySubbasin Boundary03-07-59BoliviaBoiling SpringLakesVarnumtownShallotteHoldenOcean Isle BeachBeachSunsetBeachOakIslandCounty BoundaryHydrographyMunicipality7071421 MilesPlanning BranchBasinwide Planning Program UnitJanuary 12, 2004
Figure A-4General Map of the Entire Yadkin-Pee Dee and Lumber River BasinsSection A: Chapter 2 – Lumber River Basin Overview9
2.2Surface Water Hydrology2.2.1Watershed DescriptionsDWQ has a two-tiered system in which the state is divided into 17 major river basins with eachbasin further subdivided into subbasins. The Lumber River basin is divided into 10 subbasins (6digit DWQ subbasins). Maps of each subbasin are included in Section B. DWQ and many otherstate agencies in North Carolina use this two-tiered system to identify watersheds for manydifferent programs. Most federal government agencies, including the US Geological Survey(USGS) and the Natural Resources Conservation Service (NRCS), use a different system ofdefining watersheds. Under the federal system, the Lumber River basin is made up of hydrologicareas referred to as hydrologic units (USGS 8-digit hydrologic units). The Lumber River basin ismade up of four whole hydrologic units: the Lumber, Little Pee Dee, Waccamaw and CarolinaCoastal-Sampit. Hydrologic units are further divided into smaller watershed units (14-digithydrologic units) that are used for smaller scale planning like that done by NCWRP (page 147).There are 102 14-digit hydrologic units in the Lumber River basin.2.2.2Hydrologic FeaturesThere are 2,232.5 freshwater stream miles, 8,965.9 acres of freshwater acres, 4,305.6 estuarineacres, and 25.6 miles of Atlantic coastline in the Lumber River basin. Most of the Lumber Riverbasin contains extensive wetland communities where 88 percent of the freshwater streams aresupplementally classified as swamp waters. There are also areas of the Non-Riverine Swampsand Peatlands ecoregion with flat, poorly drained soils of peat and muck. The basin starts in theSandhills physiographic region with about two-thirds of the basin in the Coastal Plain region.Streams in the Sandhills ecoregion are typically swift-flowing sandy streams which receivesubstantial flow from high quality groundwater during low rainfall periods.Streams in the coastal plain are slow-moving blackwater streams, low-lying swamps andproductive estuarine waters. The Coastal Plain is flat and the larger waterbodies are meanderingand often lined with swamps and bottomland hardwoods. The swamp streams often stop flowingin the summer and are stained by tannic acid. These streams have limited ability to assimilateoxygen-consuming wastes. Swamp streams often have naturally low dissolved oxygen and pHvalues. Coastal Plain soils are deep sands that have a high groundwater storage capacity.Because of the flat topography and high groundwater supply, there are few reservoirs in theCoastal Plain. Natural lakes include the remnants of bay lakes in the lower Coastal Plain.2.2.3Minimum StreamflowOne of the purposes of the Dam Safety Law is to ensure maintenance of minimum streamflowsbelow dams. Conditions may be placed on dam operations specifying mandatory minimumreleases in order to maintain adequate quantity and quality of water in the length of a streamaffected by an impoundment. The Division of Water Resources, in conjunction with the WildlifeResources Commission, recommends conditions relating to release of flows to satisfy minimuminstream flow requirements. The Division of Land Resources issues the permits.Section A: Chapter 2 – Lumber River Basin Overview10
The Resorts of Pinehurst, Inc. operates Lake Pinehurst dam (subbasin 03-07-50) in MooreCounty on Horse Creek. Lake Pinehurst dam has a minimum flow release of 2.5 cfs or inflow,whichever is less.Lake Auman (Seven Lakes West) dam is operated by the Seven Lakes West Property OwnersAssociation, Inc. (subbasin 03-07-50). Lake Auman is located in Moore County on an unnamedtributary of Jackson Creek and has a minimum flow release of 2.0 cfs or inflow, whichever isless.The Pinewild Country Club of Pinehurst operates Holly Course Lake dam (subbasin 03-07-50) inMoore County on Sandy Run Creek. Holly Course Lake dam has a minimum flow release of 0.4cfs or inflow, whichever is less.Division of Water Resources conducted a streamflow study for Southern Pines’ proposedincrease in withdrawal from 4 MGD to 8 MGD from Drowning Creek and found that theincrease would not adversely impact downstream habitat. In addition, the town requested adetermination, in anticipation of 50-year sales projections, of how much they could exceed the 8MGD withdrawal. The study determined that, from a physical habitat perspective, withdrawalsbetween 8 MGD and 14 MGD (21.6 cfs) would not be detrimental if a flow target of 36.2 MGD(56 cfs) could be maintained at the downstream US Geological Survey gage at Highway US 1.2.2.4Water WithdrawalsPrior to 1999, North Carolina required water users to register their water withdrawals with theDivision of Water Resources (DWR) only if the amount was 1,000,000 gallons or more ofsurface water or groundwater per day. In 1999, the registration threshold for all water usersexcept agriculture was lowered to 100,000 MGD.There are six registered water withdrawals in the Lumber River basin not including thoseassociated with the two public water systems discussed below. All of these are surface waterwithdrawals. Excluding the public water systems or power generating facilities, there is acumulative permitted capacity to withdraw 10.5 MGD of water. For more information on waterwithdrawals, visit http://www.dwr.ehnr.state.nc.us/ or call DWR at (919) 733-4064.2.2.5Interbasin TransfersIn addition to water withdrawals (discussed above), water users in North Carolina are alsorequired to register surface water transfers with the Division of Water Resources if the amount is100,000 MGD or more. In addition, persons wishing to transfer 2 MGD or more, or increase anexisting transfer by 25 percent or more, must first obtain a certificate from the EnvironmentalManagement Commission (G.S. 143-215.22I). The river basin boundaries that apply to theserequirements are designated on a map entitled Major River Basins and Sub-Basins in NorthCarolina, on file in the Office of the Secretary of State. These boundaries differ from the 17major river basins delineated by DWQ. The 8-digit hydrologic unit boundaries (Figure A-7)correspond to these basins within the Lumber River basin. Table A-3 summarizes IBTsinvolving the Lumber River basin.Section A: Chapter 2 – Lumber River Basin Overview11
In determining whether a certificate should be issued, the state must determine that the overallbenefits of a transfer outweigh the potential impacts. Factors used to determine whether acertificate should be issued include: the necessity, reasonableness and beneficial effects of the transfer;the detrimental effects on the source and receiving basins, including effects on water supplyneeds, wastewater assimilation, water quality, fish and wildlife habitat, hydroelectric powergeneration, navigation and recreation;the cumulative effect of existing transfers or water uses in the source basin;reasonable alternatives to the proposed transfer; andany other facts and circumstances necessary to evaluate the transfer request. A provision of the interbasin transfer law requires that an environmental assessment orenvironmental impact statement be prepared in accordance with the State Environmental PolicyAct as supporting documentation for a transfer petition. For more information on waterwithdrawals, visit http://www.ncwater.org or call DWR at (919) 733-4064.Table A-3Estimated Interbasin Transfers in the Lumber River Basin ReceivingSubbasinEstimatedTransfer (MGD)Brunswick CountyOcean Isle BeachCape Fear RiverShallotte River0.386Brunswick CountyShallotteCape Fear RiverShallotte River0.2182.2.6Water SupplyThe following is summarized from the North Carolina Water Supply Plan developed by theDivision of Water Resources (DWR) for the Lumber River basin (NCDENR-DWR, January2001). The information is compiled from Local Water Supply Plans submitted to DWR by twopublic water systems. In 1995, the USGS estimated that total water use in the Lumber Riverbasin was 69 MGD, with slightly less than half coming from surface water sources.Total water use in the Lumber River basin is reported to be approximately 26.9 MGD. Publicwater systems supplied 11 MGD from surface water. For more information or to view localwater supply plans, visit http://www.dwr.ehnr.state.nc.us/ or call DWR at (919) 733-4064.2.3Population and Growth TrendsBelow are three different ways of presenting population data for the Lumber River basin.Population data presented by county allow for analysis of projected growth trends in the basinbased on Office of State Planning information (April and May 2001). Data presented bymunicipality summarize information on past growth of large urban areas in the basin. While thethree different sets of information cannot be directly compared, general conclusions are apparentby looking at the information. Counties with the highest expected growth are associated with thelargest municipal areas and the most densely populated watersheds in the basin.Section A: Chapter 2 – Lumber River Basin Overview12
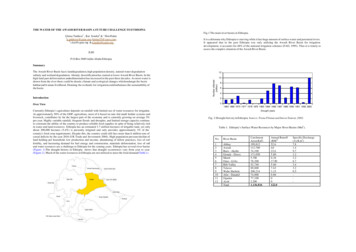
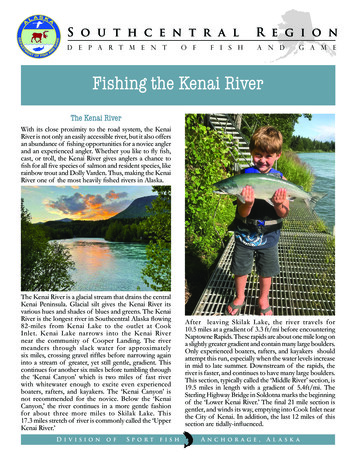
2.3.1County Population and Growth TrendsTable A-4 shows the projected population for 2020 and the change in growth between 2000 and2020 for counties that are wholly or partly contained within the basin. Since river basinboundaries do not coincide with county boundaries, these numbers are not directly applicable tothe Lumber River basin. This information is intended to present an estimate of expectedpopulation growth in counties that have some land area in the Lumber River basin.Table A-4CountyPast and Projected Population (1990, 2000, 2020) and Population Change byCountyPercent ofCountyin Basin i19902000EstimatedPopulation2020EstimatedPop Change1990-2000EstimatedPop total Source: North Carolina Center for Geographic Information and AnalysisNote: The numbers reported reflect county population; however, these counties are not entirely within the basin.The intent is to demonstrate growth for counties located wholly or partially within the basin.Populations of counties that are wholly or partly contained within the basin increased by 83,414people between 1990 and 2000. Figure A-5 presents projected population growth by county(2000-2020) for the Lumber River basin. Hoke, Moore and Robeson counties are growing thefastest in the upper basin, with Brunswick County growing the fastest in the lower basin. Thecounty populations are expected to grow by more than 156,000 by 2020. With the increasedpopulation there will be increased drinking water demands and wastewater discharges. Therewill also be loss of natural areas and increases in impervious surfaces associated withconstruction of new homes and businesses.For more information on past, current and projected population estimates, contact the Office ofState Budget and Management at (919) 733-7061 or visit the North Carolina State Demographicswebsite at http://demog.state.nc.us/.Section A: Chapter 2 – Lumber River Basin Overview13
Figure A-5 Percent Projected County Population Growth (2000-2020)in the Lumber River -30%COLUMBUSNWE10-20%SBRUNSWICK50-60%LegendRiver Basin BoundarySubbasin Boundary1001020 MilesPlanning BranchBasinwide Planning Program UnitJanuary 12, 2004
2.3.2Municipal Population and Growth TrendsTable A-5 presents population data from Office of State Planning for municipalities withpopulations greater than 2,000 persons, located wholly or partly within the basin. The highesturban population growth has occurred in the upper basin around Pinehurst and the lower basinaround Boiling Spring Lakes. Laurinburg also increased population substantially in the last tenyears. In 1999, Long Beach and Yaupon Beach incorporated to become the Town of Oak Island.Table A-5Population (1980, 1990, 2000) and Population Change for Municipalities GreaterThan 2,000 Located Wholly or Partly in the Lumber River BasinMunicipalityAberdeenCountyMooreBoiling Spring Lakes BrunswickPercent Change Percent axtonRobeson, Scotland2,7112,5762,551-5.0-1.0Oak Island Brunswick .4,5506,571 st Moore1,7465,0919,706191.690.7Raeford Hoke3,6303,4693,386-4.4-2.4Red SpringsRobeson3,6073,7993,4935.3-8.1Saint PaulsRobeson1,6391,9922,13721.57.3Southern Pines Moore8,6209,21310,9186.918.5Tabor bus5,5655,0785,148-8.81.4 - The numbers reported reflect municipality population; however, these municipalities are not entirely within the basin.The intent is to demonstrate growth for municipalities located wholly or partially within the basin.Note: Red Springs is listed only in Robeson County in the 2001 NC League of Municipalities Directory. However, it is listedin Robeson and Hoke counties on the Office of State Planning website for the April 2001 municipality population data eventhough there are no population figures listed for Hoke County.2.3.3Basin Population and Population DensityMost population data are collected from within county or municipal boundaries. It is difficult toevaluate population and population density within watersheds using this information.Information on population density at a watershed scale is useful in determining what streams arelikely to have the most impacts as a result of population growth. This information is also usefulin identifying stream segments that have good opportunities for preservation or restoration. Theoverall population of the Lumber River basin is 304,579, with approximately 92 persons/squaremile for counties which are partially or entirely in the basin.Section A: Chapter 2 – Lumber River Basin Overview15
2.4Local Governments and Planning Jurisdictions in the BasinThe Lumber River basin encompasses all or portions of nine counties and 51 municipalities.Table A-6 provides a listing of these municipalities, along with the regional planning jurisdiction(Council of Governments). Eleven municipalities are located in more than one major river basin.Table A-6CountyLocal Governments and Planning Units within the Lumber River OHokeNBladenboro, Clarkton, Dublin , Tar Heel Boiling Spring Lakes , Bolivia, Calabash, Carolina Shores, Holden Beach, Oak Island ,Ocean Isle Beach, Shallotte, Sunset Beach, VarnamtownBoardman, Bolton , Brunswick, Cerro Gordo, Chadbourn, Fair Bluff, Lake Waccamaw,Tabor City, WhitevilleRaeford MontgomeryGCandor MooreJAberdeen, Foxfire Village, Pinebluff, Pinehurst , Southern Pines RichmondRobesonNNScotlandNHoffman , Norman Fairmont, Lumber Bridge, Lumberton, Marietta, Maxton *, McDonald, Orrum, Parkton,Pembroke, Proctorville, Raynham, Red Springs, Rennert, Rowland, Saint PaulsEast Laurinburg, Gibson, Laurinburg, Maxton *, Wagram* Located in more than one county.Located in more than one major river basin.Note: Counties adjacent to and sharing a border with a river basin are not included as part of that basin if only a trace amount ofthe county ( 2 percent) is located in that basin, unless a municipality is located in that county.NameLocationRegionGPiedmont Triad Council of GovernmentsGreensboroJTriangle J Council of GovernmentsDurhamNLumber River Council of GovernmentsLumbertonOCape Fear Council of GovernmentsWilmington2.5Land CoverLand cover can be an important way to evaluate the effects of land use changes on water quality.Unfortunately, the tools and database to do this on a watershed scale are not yet available. Parts2.5.1 and 2.5.2 below describe two different ways of presenting land cover in the Lumber Riverbasin. The CGIA land cover information is useful in providing a snapshot of land cover in thebasin from 1993 to 1995. This information is also available in a GIS format so it can bemanipulated to present amounts of the different land covers by subbasin or at the watershedscale. The NRI land cover information is presented only at a larger scale (8-digit hydrologicunit), but the collection methods allow for between year comparisons. The two datasets cannotbe compared to evaluate land cover data. This information is presented to provide a picture ofthe different land covers and some idea of change in land cover over time. In the future, it ishoped that land cover information like the GIS formatted dataset will be developed to make moremeaningful assessments of the effects of land use changes on water quality. This dataset wouldalso be useful in providing reliable and small-scale information on land cover changes that canbe used in water quality monitoring, modeling and restoration efforts.Section A: Chapter 2 – Lumber River Basin Overview16
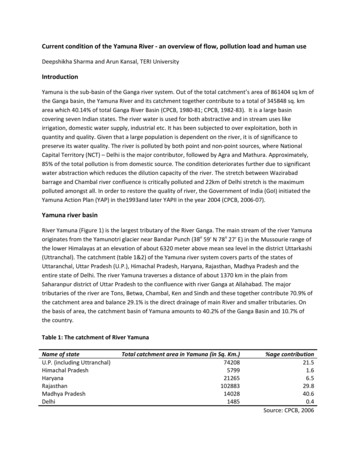
2.5.1CGIA Land CoverThe North Carolina Corporate Geographic Database contains land cover information for theLumber River basin based on satellite imagery from 1993-1995. The state’s Center forGeographic Information and Analysis (CGIA) developed 24 categories of statewide land coverinformation. For the purposes of this report, those categories have been condensed into fivebroader categories as described in Table A-7. Figure A-6 provides an illustration of the relativeamount of land area that falls into each major cover type for the Lumber River basin. Section Bof this plan provides land cover data specific to each subbasin based on this information.Table A-7Description of Major CGIA Land Cover CategoriesLand CoverTypeLand CoverDescriptionUrbanGreater than 50 percent coverage by synthetic land cover (built-upon area) andmunicipal areas.Cultivated CroplandAreas that are covered by crops that are cultivated in a distinguishable pattern.Pasture/Managed HerbaceousAreas used for the production of grass and other forage crops and othermanaged areas such as golf courses and cemeteries. Also includes uplandherbaceous areas not characteristic of riverine and estuarine environments.Includes salt and freshwater marshes, hardwood swamps, shrublands and allkinds of forested areas (such as needleleaf evergreens, deciduous hardwoods).Forest/WetlandWaterAreas of open surface water, areas of exposed rock, and areas of sand or siltadjacent to tidal waters and lakes.Lumber River Basin Land Cover (1993-1995)Water1%Cultivated cropland28%Urban1%Forest/wetland66%Figure A-6Pasture/managedherbaceous4%Percentages within Major CGIA Land Cover Categories in the Lumber RiverBasinSection A: Chapter 2 – Lumber River Basin Overview17
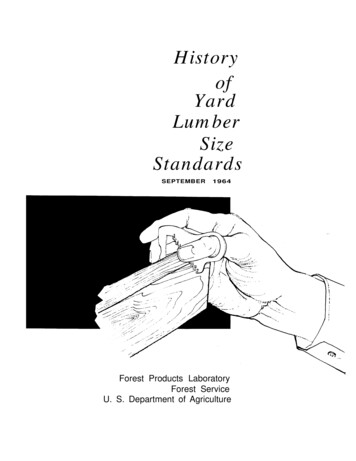
2.5.2NRI Land Cover TrendsLand cover information in this section is from the most current National Resources Inventory(NRI), as developed by the Natural Resources Conservation Service (USDA-NRCS, NRI,updated June 2001). The National Resources Inventory (NRI) is a statistically based longitudinalsurvey that has been designed and implemented to assess conditions and trends of soil, water andrelated resources on the Nation’s nonfederal rural lands. The NRI provides results that arenationally and temporally consistent for four points in time -- 1982, 1987, 1992 and 1997.In general, NRI protocols and definitions remain fixed for each inventory year. However, part ofthe inventory process is that the previously recorded data are carefully reviewed asdeterminations are made for the new inventory year. For those cases where a protocol ordefinition needs to be modified, all historical data must be edited and reviewed on a point-bypoint basis to make sure that data for all years are consistent and properly calibrated. Thefollowing excerpt from the Summary Report: 1997 National Resources Inventory providesguidance for use and interpretation of current NRI data:"The 1997 NRI database has been designed for use in detecting significant changes inresource conditions relative to the years 1982, 1987, 1992 and 1997. All comparisons fortwo points in time should be made using the new 1997 NRI database. Comparisons madeusing data previously published for the 1982, 1987 or 1992 NRI may provide erroneousresults because of changes in statistical estimation protocols, and because all data collectedprior to 1997 were simultaneously reviewed (edited) as 1997 NRI data were collected."Table A-8 summarizes acreage and percentage of land cover from the 1997 NRI for the majorwatersheds within the basin, as defined by the USGS 8-digit hydrologic units, and compares thecoverages to 1982 land cover. Definitions of the different land cover types are presented inTable A-9. Figure A-7 also shows the relationship between the 8-digit hydrologic units andDWQ subbasin. These data can be used to evaluate changes in land cover over the large arearepresented by the 8-digit hydrologic units and should not be assumed to represent land coverchanges at smaller scales in specific watersheds. In the Lumber River basin, the 8-digithydrologic units extend into South Carolina, and thus, are partially contained in North Carolina.Data from 1982 are also provided for a comparison of change over 15 years. During this period,urban and built-up land cover increased by 67,000 acres. Uncultivated cropland decreased by4,000 acres while pastureland remained about the same. Forest and cultivated cropland coversignificantly decreased by 30,000 and 41,000 acres, respectively. Most land cover change isaccounted for in the upper Lumber River basin hydrologic unit that includes rapidly growingareas in Hoke, Moore and Robeson counties as well as the lower Lumber River basin hydrologicunit in Brunswick County. Figure A-8 presents changes in land cover between 1982 and 1997.Section A: Chapter 2 – Lumber River Basin Overview18
Table A-8Land Cover in the Lumber River Basin by Major Watersheds – 1982 vs. 1997(Source: USDA-NRCS, NRI, updated June 2001)MAJOR WATERSHED AREASLumberLAND COVERCult. CropAcres(1000s)LittlePee DeeAcres(1000s)%%WaccamawAcres(1000s)%Carolina %Acres%since(1000s)%(1000s) TOTAL (1000s) 3590.727.2-7.0Uncult. 02169.9100.02174.6100.0Urban & Built-UpFederal% of Total BasinSUBBASINS8-DigitHydraulic Units49.611.430.97.903-07-50 03-07-5103-07-52 -07-5903040203030402040304020603040207* Watershed areas as defined by the 8-Digit Hydraulic Units do not necessarily coincide with subbasin titles used by DWQ.Source: USDA, Soil Conservation Service - 1982 and 1997 NRI.Section A: Chapter 2 – Lumber River Basin Overview19
Figure A-7 8-Digit Hydrologic Units in the Lumber River 07-57Legend030402068-Digit Hydrologic Units03040203030402040304020603040207Subbasin Boundary030402071001020 MilesPlanning BranchBasinwide Planning Program UnitJanuary 12, 2004
Table A-9Description of Land Cover Types(Source: USDA-NRCS, NRI, updated June 2001)TypeDescriptionCultivated CroplandHarvestable crops including row crops, small-grain and hay crops, nursery and orchardcrops, and other specialty crops.Summer fallow or other cropland not planted.Uncultivated CroplandPasturelandIncludes land that has a vegetative cover of grasses, legumes and/or forbs, regardless ofwhether or not it is being grazed by livestock.At least 10 percent stocked (a canopy cover of leaves and branches of 25 percent orgreater) by single-stemmed trees of any size which will be at least 4 meters at maturity,and land bearing evidence of natural regeneration of tree cover. The minimum area forclassification of forestland is 1 acre, and the area must be at least 1,000 feet wide.Includes airports, playgrounds with permanent structures, cemeteries, publicadministration sites, commercial sites, railroad yards, construction sites, residences, golfcourses, sanitary landfills, industrial sites, sewage treatment plants, institutional sites,water control structure spillways and parking lots. Includes highways, railroads andother transportation facilities if surrounded by other urban and built-up areas. Tracts ofless than 10 acres that are completely surrounded by urban and built-up lands.Rural Transportation: Consists of all highways, roads, railroads and associated rightsof-way outside urban and built-up areas; private roads to farmsteads; logging roads; andother private roads (but not field lanes).Small Water Areas: Waterbodies less than 40 acres; streams less than 0.5 miles wide.Census Water: Large waterbodies consisting of lakes and estuaries greater than 40 acresand rivers greater than 0.5 miles in width.Minor Land: Lands that do not fall into one of the other categories.ForestlandUrban andBuilt-up AreasOther80Changes in Acres (1000s)77.8%6040202.9%0%0 UprestrePas turopt. CUnculCult.Crop-60Land C over TypeFigure A-8Land Cover Changes from 1982 to 1997 for the Lumber River Basin(Source: USDA-NRCS, NRI, updated June 2001)Section A: Chapter 2 – Lumber River Basin Overview21
2.6NPDES Permits SummaryDischarges that enter surface waters through a pipe,ditch or other well-defined point of discharge arebroadly referred to as ’point sources’. Wastewater pointsource discharges include municipal (city and county)* oxygen-consuming wastes,and industrial wastewater treatment plants and small* nutrients,* color, anddomestic wastewater treatment systems serving schools,* toxic substances including chlorine,commercial offices, residential subdivisions andammonia and metals.individual homes. Stormwater point source dischargesinclude stormwater collection systems formunicipalities that serve populations grea
Brunswick County Ocean Isle Beach Cape Fear River Shallotte River 0.386 Brunswick County Shallotte Cape Fear River Shallotte River 0.218 2.2.6 Water Supply The following is summarized from the North Carolina Water Supply Plan developed by the Division of Water Resources (DWR) for the Lumber River basin (NCDENR-DWR, January 2001).