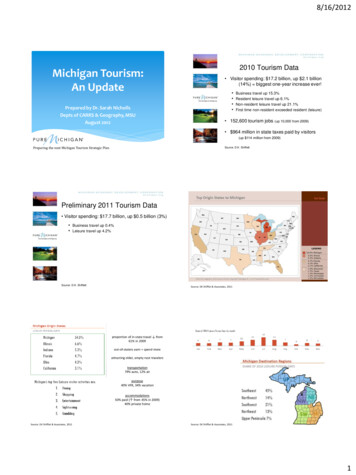
Transcription
8/16/2012Michigan Tourism:An UpdatePrepared by Dr. Sarah NichollsDepts of CARRS & Geography, MSUAugust 20122010 Tourism Data Visitor spending: 17.2 billion, up 2.1 billion(14%) biggest one-year increase ever! Business travel up 15.3%Resident leisure travel up 6.1%Non-resident leisure travel up 21.1%First time non-resident exceeded resident (leisure) 152,600 tourism jobs (up 10,000 from 2009) 964 million in state taxes paid by visitors(up 114 million from 2009)Preparing the next Michigan Tourism Strategic PlanSource: D.K. ShifflettPreliminary 2011 Tourism Data Visitor spending: 17.7 billion, up 0.5 billion (3%) Business travel up 0.4% Leisure travel up 4.2%Source: D.K. ShifflettSource: DK Shifflet & Associates, 2011proportion of in-state travel from61% in 2009out-of-staters earn spend moreattracting older, empty nest travelerstransportation79% auto, 12% airpurpose40% VFR, 34% vacationaccommodations50% paid ( from 45% in 2009)40% private homeSource: DK Shifflet & Associates, 2011Source: DK Shifflet & Associates, 20111
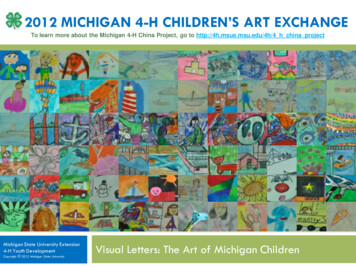
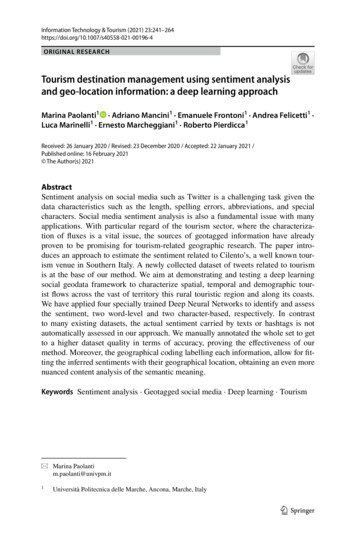
8/16/2012Michigan Travel Spending by Purpose 2006-2011 14.0 12.0 10.0Billion 8.0 6.0 4.0 2.0 -200620072008200920102011Business 5.5 5.4 4.4 4.0 4.6 4.6Leisure 13.3 12.8 11.9 11.1 12.6 13.1TOP SEVEN COUNTIES FOR SPENDING (2010)1.2.3.4.5.6.7.Grand Traverse 4.0%Saginaw Genesee 6.8%Kent 5.8%Ingham 3.7%Washtenaw 3.5%Wayne ( 4,408m, 25.6%)Kent ( 1,004m, 5.8%)Saginaw ( 804m, 4.7%)Oakland ( 716m, 4.2%)Grand Traverse ( 693m, 4.0%)Ingham ( 639m, 3.7%)Washtenaw ( 595m, 3.5%)Wayne Oakland Macomb 29.4%Preparing the next Michigan Tourism Strategic PlanState Tax Revenues Generated by theMichigan Tourism Industry 2001-2010 1,200.0 1,000.0Million s 800.0 600.0 400.0 200.0 State Tax Revenue2001200220032004200520062007200820092010 839.9 854.0 919.5 1,012.0 1,012.0 1,081.8 1,043.7 938.7 849.9 964.22
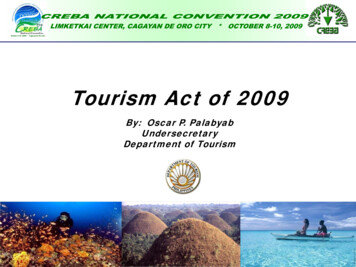
8/16/2012NEWS FROM TRAVEL MICHIGAN'S DIRECTOR, GEORGE ZIMMERMANNWEDS JUNE 27, 2012“Results for 2012 continue to be positive as wehead into the 4th of July.According to Smith Travel Research, MI’s hotel occupancy rate throughMay of this year is 50.7%, up 3.5% from the same period in 2011. Theaverage daily rate (ADR) for Michigan hotels is 79.18 through May, up3.3% from 2011. And revenue per available hotel room (RevPAR)through May is 40.14, up 6.9% over the first five months of 2011.”The Pure MI CampaignWEDS JULY 25, 2012“Key hotel data continues to improve in Michigan, according to SmithTravel Research. Through June, Michigan's hotel occupancy rate was53.4%, up 4% from the same period last year. Revenue per availablehotel room (RevPAR) was 43.01 through June, up 7.9% over the first sixmonths of 2011.”Preparing the next Michigan Tourism Strategic PlanAwareness of 2010 Pure MichiganCampaignRegional Market*Saw at least one adAwareness of 2011 Pure MichiganCampaignRegional Market*Saw at least one adNational MarketSource: Longwoods InternationalImpact of 2011 Pure Michigan Ads onState’s National ImageNational MarketSource: Longwoods International* Saw at least one adSource: Longwoods International3
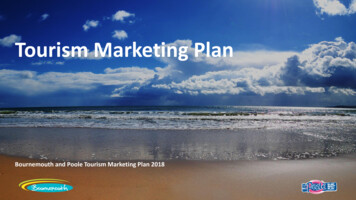
8/16/2012Pure Michigan Accolades Best State Tourism Advertising Campaign: 2007 Best State Tourism Television Advertising: 2007, 2010 Best State Tourism Radio Advertising: 2008-2011 Best State Tourism Niche Advertising: 20092011 David Ogilvy Award forExcellence in Advertising Research Presented by Advertising Research Foundation “Celebrate the extraordinary and/or creative useof research in the advertising developmentprocess” Best State Tourism Welcome Centers: 2010 Best State Tourism Partnership Program: 2010“Mercury Awards” presented by the United States Travel AssociationForbes (2009): All-time Ten BestTourism Promotion Campaigns1. Las Vegas (“what happens here, stays here”)2. Incredible India3. New Zealand4. Australia (Paul Hogan, 1980s)5. Jamaica6. Pure Michigan7. Alaska (B4UDIE billboards, 2005)8. Canada9. Oregon10. Virginia (is for Lovers)2011 State of the State Address“In our budgetrecommendations,we will include thefunding of Pure Michiganat an annual rate of 25 million .It’spositive for our image and it’s a positive returnon our tax dollars .I ask the legislature torecognize that return on investment andlend its full support.”Governor Rick Snyder, January 19, 2011Pure Michigan ROI 20112012 Advertising PartnersThe Wilds ofMichiganMarquetteThe Great Waters 14.25 million in out-of-state spring/summer advertising Motivated 3.2 million trips to MI 2 million from the region (IL, IN, OH, WI, MO, Ontario) 1.2 million from outside the regionSault Ste MarieSt. IgnaceStatewide PartnershipsHarbor SpringsMichigan SnowsportsIndustry AssociationMichigan Wine CouncilMichigan Ag Council CadillacSilver Lake Sand DunesLudingtonTullymore Golf ResortBig Rapids spent 1 billion at MI businesses paid 70 million in MI sales taxMuskegonAlpenaGaylordSunrise CoastGreat Lakes Bay RegionFrankenmuthBlue Water AreaMichigan AdventureROI 4.90 for each dollar spent on Pure MIspring/summer advertising in 2011Flint & GeneseeCountyMt. PleasantBeachtownsLansingGrand RapidsKalamazooKalamazoo Air ZooColdwater CountryJacksonSource: Longwoods InternationalMackinac IslandThunder Bay ResortTraverse CityMichigan AppleCommittee Those visitorsCharlevoixDetroitAnn ArborThe Henry FordMonroeROI was 2.23 in 20094
8/16/2012Michael Finneymichigan.orgPure MI Brand Promotion/PartnershipsMost popular state tourism web site in US in 2011(for fifth year in a FloridaHawaiiColoradoTexasNorth CarolinaUtah8,646,540 web 04,391,0593,957,6673,360,181Source: Experian HitwiseMichigan Travel Ideas14,168 listingsas of June 2012facebook.com/puremichigan.org1,000,000 printed650,000 polybaggedwith March/AprilMidwest LivingMost Facebook fans/likes of any state tourism Facebook siteHowever Pure Michigan MerchandiseMI ranked 28th in terms of desire tovisit US states in 2010 Portrait of theAmerican Traveler ReportPreparing the next Michigan Tourism Strategic Plan5
8/16/2012State and USComparisonsPreparing the next Michigan Tourism Strategic Plan2010 Leisure Visitor VolumePure Michigan Budget vs. Other States(for 2012)1.2.3.4.5.6. MI ranked 11th in leisure visitor-days inthe US in 2010 (2.6% of market, from 8th [3.0%] inHawaii -- 75 millionCalifornia -- 61 millionIllinois -- 55 millionFlorida -- 38 millionTexas -- 36 millionMichigan -- 25 million2009) Average spend per person per day 81( from 75 in 2009 – US average 105)Average 14.5 millionMI ranked34th in 2005Source: D.K. Shifflett2009-2011 Leisure Visitor Opinion2010 Leisure Visitor Spending2010 Leisure(inVisitorSpending (in billions)billions)1) Florida2) California3) Texas4) Nevada5) New York6) Pennsylvania7) Ohio8) N. Carolina9) Illinois10) Arizona14) MichiganSource: D.K. Shifflett 57.7 57.5 28.1 25.4 22.2 16.9 15.8 15.4 14.7 13.5 8.38.47.78.08.2MI7.58.48.57.38.28.4Note: on a 10-point scale, 10 highestSource: D.K. Shifflett, 2010, 20116
8/16/2012Great Lakes USAThe InternationalDimension Markets the Great Lakes region in Europe Co-funded/managed by MI, OH, IL, WI andMN tourism offices Rep firms in UK Germany State-level inboundint’nal statsvery poorPreparing the next Michigan Tourism Strategic PlanChange in Top 15 Inbound Markets (US, 2011 vs. zilFranceSouth Korea 5%0%0%-4% 6% 26% 12% 3%9. China (ex. HK)10. Australia11. Italy12. Spain13. India14. Netherlands15. Venezuela 36% 15% 6% 9% 2% 5% 14%Source: U.S. Office of Travel and Tourism Industries ws2012/20120307 2011 International Visitation.htmlGROWTH IN TRAVEL SPENDING WILL BE LED BY EMERGING MARKETSEstimated growth in outbound international travel expenditures in 2012 ChinaBrazilIndiaRussia 38% 32% 32% 21%Source: UNWTO s/pdf/unwto barom12 01 january en excerpt.pdfPreparing the next Michigan Tourism Strategic PlanInitial focus on: Canada, UK, Japan, Brazil and South Korea7
2010 8.0 8.2 2011 8.2 8.4 Note: on a 10-point scale, 10 highest . 8/16/2012 7 The International Dimension Preparing the next Michigan Tourism Strategic Plan Great Lakes USA Markets the Great Lakes region in Europe Co-funded/managed by MI, OH, IL, WI and MN tourism offices