Transcription
Final Report: Analysis of Actuarial Values and Plan Funding Using Plans from the National CompensationSurveyCompiled for Office of Policy and Research (OPR), Employee Benefits Security Administration (EBSA),Department of Labor (DOL) by Actuarial Research Corporation (ARC)May 12, 2017
Final Report: Analysis of Actuarial Values and Plan FundingContract DOLJ139335155Order Number DOL‐OPS‐15‐T‐00170Deliverable 2dContentsIntroduction . 3Overview of the Process . 3Data Description . 4Data Concerns: Self‐Insured Variable in NCS . 6Methodology. 6AV Findings. 8Regression Analysis . 13Limitations. 18Conclusions . 18Acknowledgments. 19Page 2
Final Report: Analysis of Actuarial Values and Plan FundingContract DOLJ139335155Order Number DOL‐OPS‐15‐T‐00170Deliverable 2dIntroductionActuarial Research Corporation (ARC) performed an analysis of actuarial value (AV) by plan funding(whether a plan is self‐insured or purchased) for the Department of Labor’s (DOL) Employee BenefitsSecurity Administration (EBSA). The goal of the project was to support the Office of Policy and Research(OPR) in its efforts to measure the level of coverage offered by employer‐sponsored insurance plans byestimating actuarial value by plan funding type. The project uses the National Compensation Survey(NCS) data—produced by the Bureau of Labor Statistics (BLS)—and compares the estimates to the AVcalculated using the Minimum Value Calculator (MVC) from the Center for Consumer Information andOversight (CCIIO). Finally, the project includes a regression analysis of the effects of plan funding onactuarial value.While the goal of this study was to determine whether health insurance plans vary in the richness oftheir benefits by their funding methodology, the work done in support of this goal has additionalapplications. In particular, the distributions of actuarial value produced in this study can also be usefulfor EBSA in their Auxiliary Data,1 an annual report and dataset published by EBSA which generatesestimates of insurance coverage for individuals and statistics on various aspects of employer‐sponsoredinsurance including the value of the coverage.Overview of the ProcessUnder a Memorandum of Understanding (MOU) between EBSA and BLS, ARC worked onsite at BLS toextract relevant data from the most recent four years of the NCS, recode the data and calculate actuarialvalues2 for the plans. Actuarial values for the NCS employer sponsored health plans were first calculatedwith ARC’s own internal methodology (ARC ratebook), and then compared to actuarial values calculatedusing the MVC from CCIIO. Once the AVs were calculated, employee‐weighted distributional tables byplan type and funding were created, as well as basic tables which profile the underlying populationcovered by the NCS. The final step was to use statistical analysis to estimate the effects of plan fundingon the actuarial values.Data extractions from the NCS datasets were performed at BLS, in conversation with BLS staff, usingsoftware available on the BLS computers. The ARC rating methodology is a Unix‐based C program thatevaluates plans by means of a “claims repayment” routine at the person level. All plans were evaluatedon each person record in the database that underlies the ARC model, and the output is at the plan level.The ARC programs (and underlying data) were uploaded to BLS computers, and compiled and run usingBLS resources so that no NCS plan data left the BLS facility. The MVC, from CCIIO, was used to evaluatethe NCS plans using Excel based macros. ARC automated the MVC calculation process for running largenumbers of plans, without change to the calculation routines themselves. The MVC Excel sheet was alsouploaded to, and run at, BLS.Once a set of initial actuarial values were calculated from the raw data for each of the NCS datasets, aset of imputation algorithms was used to fill in for missing values and/or missing questions. After s/data/auxiliary‐dataActuarial value, or AV, is defined as the ratio of average benefits paid to a uniform covered service package, when calculatedover a standard population. Actuarial value calculations, in general and in this work, do not take into account items such astype of plan, the richness of an insurance plan’s network, the impact of cost‐sharing on utilization (induced demand), how highthe insurance plans “recognized charge” (fee) schedules are, or differences in employer contributions for the coverage.2Page 3
Final Report: Analysis of Actuarial Values and Plan FundingContract DOLJ139335155Order Number DOL‐OPS‐15‐T‐00170Deliverable 2dimputations were performed, actuarial values were then recalculated using both ARC’s ratebook and theMVC. Output was created from each of the sets and methodologies run.For the regression analysis, matching and statistical analysis were performed at BLS, using SAS statisticalsoftware which was available on the BLS computer system. Plan output was matched back to eachapplicable plan / occupation group record in order to perform the statistical analysis of size, industry,plan type, geographic location, average wage, and funding.Data DescriptionThe annual NCS, produced by BLS, covers the incidence and detailed provisions of selected employeebenefit plans in private establishments.3 In the area of health insurance, the NCS provides detailedinformation on private employers and their health insurance plans. The NCS provides this informationannually, taken from a combination of detailed Summary Plan Descriptions, short summaries andcomparison charts that are provided by responding employers.4 The detailed plan provisions extractedfrom these documents allow for the examination of how coverage richness in the employer market maybe influenced by various employer, employee and plan characteristics.The NCS includes employer and employee characteristics in addition to health insurance planparameters. Employer characteristics include size, industry, and geographic location, with workforcecharacteristics such as part‐time vs. full‐time and union participation. Plan parameters on the NCSinclude overall cost‐sharing as well as service specific details including those for inpatient hospital,physician office visits, mental health and substance abuse treatment, and prescription drugs. These planspecific cost‐sharing parameters (both overall and by service) can be used to estimate the relativerichness of the plans, using a measure known as the plan’s actuarial value.ARC’s evaluation of the health insurance plans in the NCS began with the NCS survey data itself, whichwas accessed with assistance from BLS staff specifically in the areas of determining the appropriatevariables and methods for extracting, and forming a plan level data set to be evaluated. Table 1, below,shows the four NCS datasets that were accessed, their collection months, and the depth of variables (ifthere was anything beyond core variables available). The four datasets were chosen based on being themost recently available with at least half having non‐core variables available and all years being able tohave the self‐insured variable appended to the data.5Table 1. NCS Data and Variable AvailabilityInitiation collectionNCS Dataset #months110June 2011 – July 2012111June 2012 – July 2013112June 2013 – July 2014113June 2014 – July 2015Medical Non‐CoreVariables Collected?NYNYSelf‐insured ary.htmFrom the Introduction of “Selected Medical Benefits: A Report from the Department of Labor to the Department of Healthand Human Services”, April 2011. Accessed at f.5 The self‐insured variable was not part of the NCS datasets but was appended by BLS personnel.4Page 4
Final Report: Analysis of Actuarial Values and Plan FundingContract DOLJ139335155Order Number DOL‐OPS‐15‐T‐00170Deliverable 2dEach NCS survey analyzed by ARC contains “core” information on medical and prescription drugcoverage as well as overall plan limits. Additionally, NCS 111 and NCS 113 contain “non‐core” medicalvariables that describe specific services.The “Medical Non‐Core” variables include coverage and copay information about specific medicalservices (hospital, physician office visits, etc.). In the years when these variables are not collected, thesurvey provides only overall plan information (such as deductible, out‐of‐pocket (OOP) max), andprescription drug information. Self‐insured status is not provided by plans on the main NCS dataset, butrather through a quarterly update dataset. BLS was able to link plans across the datasets, in order toappend the variable to the datasets. NCS observations contain an occupational weight and aparticipation percentage for the plan in question. ARC determined plan participation weights using theproduct of these two values for each observation. Analysis was performed using these plan participationweights.Once plan records existed, the NCS variables were recoded into those used by the ARC ratebook andMVC in order to calculate the actuarial values. The overall limit data (those cost‐sharing variables thatapplied to all services) was used to determine plan deductibles, coinsurance levels, and OOP maximums.When available, separate individual and family deductibles and OOP maximums were used. Medicalcore variables provide information about networks, prepayment vs indemnity coverage, presence of aprimary care physician, coverage of out‐of‐ network emergency services, and whether the plan is pairedwith a health savings account. ARC used these variables—in conjunction with some overall limit data—to determine plan type (HMO, PPO, POS, fee‐for‐service, high‐deductible). ARC used prescription drugvariables to determine the presence of drug coverage and coverage parameters for three drug tiers.Coverage information for several services used in the ARC ratebook (hospital copay per day, emergencyroom, outpatient, and specialist) were not directly available in any NCS data. In addition, detailed dataon hospital coverage per admission and primary care office visits were not collected in the NCS 110 andNCS 112 surveys for most records. Furthermore, even when coverage and cost sharing information wascollected as part of an NCS survey, data for some records were ambiguous and/or partially completesuch that specific coverage parameters could not be determined. For example, some records showedpresence of a copay for primary care coverage but indicated that the copay amount was “unspecified.”In all of these cases, ARC assigned default values to plan parameters where complete cost sharinginformation was unavailable. In general, services for which specific cost sharing information wasunavailable were assumed to be covered under the overall plan deductible and coinsurance limits.6While first pass actuarial values were calculated using these default values, they were then calculatedusing a set of imputed values. These imputed values relied on probability distributions derived fromplan parameters found in the Kaiser Family Foundation/Health Research & Education Trust (KFF/HRET)Employer Health Benefits Surveys for the relevant year. Due to the slightly more limited scope of theNCS 110 and 112 datasets (where only core questions were asked), more fields were imputed to thesedatasets than to the NCS 111 and 113 datasets. Table 2, below, summarizes the extent of imputationfor various parameters across NCS datasets.6Records with indeterminable deductible and/or coinsurance levels were excluded from analysis.Page 5
Final Report: Analysis of Actuarial Values and Plan FundingContract DOLJ139335155Order Number DOL‐OPS‐15‐T‐00170Deliverable 2dTable 2. NCS Plan Parameters Imputations by DatasetNCS Dataset #Plan Parameter110111112113OOP Max2%2%3%3%7IP 00%100%100%% ofRecords Primary x Tier 110%8%10%10%Rx Tier 217%19%20%24%Rx Tier 317%21%21%21%Further details on the imputation process are found in Appendix A, Technical Appendix.Data Concerns: Self‐Insured Variable in NCSARC found that the incidence of self‐insurance (as opposed to purchased insurance) among plans in theNCS datasets was much lower than in other data sources that capture plan funding. Across the NCS 110‐113 datasets, roughly 30% of (weighted)9 participants are covered by plans identified as self‐insured.KFF/HRET Employer Health Benefits Surveys from the same time period imply nearly twice the incidenceof self‐insurance, with about 60% of participants covered by plans identified as self‐insured. Similarly,large discrepancies exist across plan types and employer sizes. Custom tabulations provided by AHRQfrom the Medicare Expenditure Panel Survey – Insurance Component (MEPS‐IC) for a separate projectwith DOL/EBSA also imply large differences in self‐insured incidence from NCS data.10In practice, the manner in which a plan is labeled “self‐insured” varies widely, so the differing shares ofparticipants in self‐insured plans may result from different methods for determining plan funding statusacross the data sources. Additionally, for many records in the NCS datasets, the value of the self‐insuredvariable was imputed rather than collected directly from the establishment. This could also explainsome of the differences across data sources.MethodologyARC conducted initial actuarial value calculations by inputting the raw NCS plan data, with default valuesas described above, into the ARC ratebook and the MVC, for each of the four datasets. The first ratingmethodology, the ARC ratebook, is based on three years of demographic, spending and utilization datafrom the Medical Expenditure Panel Survey, Household Component (MEPS‐HC) and is a “claims‐repayment” model. The model uses person level records along with a program that simulates healthspending under various health insurance plans under consideration. For each plan, the ratio of claims7The NCS 113 had additional variables on inpatient hospital, which resulted in fewer records needing any imputation comparedto earlier years.8 Emergency room cost‐sharing was only available in the KFF/HRET Employer Health Benefits Survey for 2012 and thus was onlyimputed to the NCS 111 dataset.9 42%‐45% (unweighted)10 These data are not for public release, so ARC cannot comment on the exact magnitude of discrepancies.Page 6
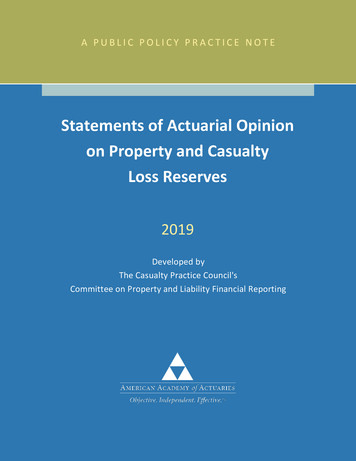
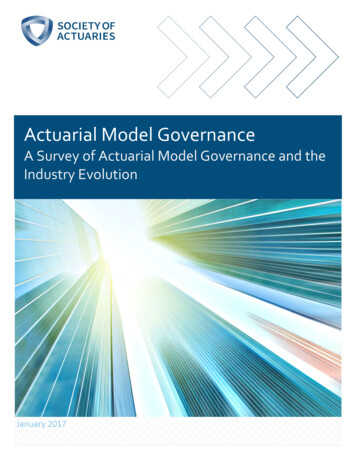
Final Report: Analysis of Actuarial Values and Plan FundingContract DOLJ139335155Order Number DOL‐OPS‐15‐T‐00170Deliverable 2dpaid to the underlying covered expenses, for the entire standardized population (in this case ESI under65) is the actuarial value. The use of the MEPS‐HC data has been restricted to those persons under age65 with employer sponsored insurance (ESI) and then controlled to be consistent, in both populationand spending, with the subset of estimates from the National Health Accounts that detail employersponsored insurance, for the plan year in question.The second rating methodology, the MVC from CCIIO, uses tables from claims data at the overall andservice level to estimate the value of each service’s coverage and contribution to the overall actuarialvalue. The data underlying the MVC is from the MarketScan Commercial Claims and EncountersDatabase and adjusted by CCIIO staff.11While both methodologies are explained in more detail in the Technical Appendix (Appendix A), theactuarial values calculated from each appear to maintain a small but consistent differential. Whenlooking at the values using the unimputed data (those that rely more on overall rather than servicespecific cost‐sharing), the AVs differ a bit more than those calculated using the more detailed, butimputed specifications. Table 3.1., below, shows the distribution of actuarial values from the two ratingmethodologies pre‐imputation. The linear relationship between the two sets of values was best fit to aline denoted by y 1.157x ‐ 0.1527 with an R‐squared of 0.982.Table 3.1. Comparison of Pre‐Imputed ActuarialValues (ARC Ratebook vs. MVC), NCS Group 113Mean AV5%10%20%30%40%50%60%70%80%90%95%ARC .960.97Table 3.2., below, shows the post‐imputation actuarial values for both the ARC ratebook and the MVC.The two sets of values fit a line slightly closer to y x: y 1.057x ‐ 0.0669 with an R‐squared of �methodology.pdfPage 7
Final Report: Analysis of Actuarial Values and Plan FundingContract DOLJ139335155Order Number DOL‐OPS‐15‐T‐00170Deliverable 2dTable 3.2. Comparison of Post‐Imputed ActuarialValues (ARC Ratebook vs. MVC), NCS Group 113Mean AV5%10%20%30%40%50%60%70%80%90%95%ARC .930.95Given the small differential between the two methodologies, plus the flexibility of the ARC ratebook tomodel at the person level as well as to be set to a specific underlying covered expense amount and timeperiod (and so different values for each NCS dataset), ARC chose to focus on the results from the ARCratebook and use those as the basis for the self‐insured regression analysis.AV FindingsAnalysis of the NCS has produced tabulations that look at the average actuarial values for plans based onplan, employer and employee characteristics. A subset of these tables from the NCS 113 dataset, andlabelled Table 4.1. through 4.5., are shown below. Participation, as shown below, is within fundingstatus (so that each column adds to 100%).The full set of tables which includes earlier years and additional tables, are presented in Appendix B.While the tables below only show results from the ARC ratebook post‐imputation, the actuarial valuesincluded in the full set have been calculated using both the ARC ratebook and the MVC (afterimputations for missing values).Page 8
Final Report: Analysis of Actuarial Values and Plan FundingContract DOLJ139335155Order Number DOL‐OPS‐15‐T‐00170Deliverable 2dTable 4.1. Participants and Average AV by Plan Type and Funding, NCS Group 113TotalSelf‐InsuredPurchasedPlan TypeHMOPOSPPOFFSHDHP12% ofParticipantsAverageAV% ofParticipantsAverageAV% %0.890.870.850.860.80As seen in Table 4.1, above, most plans in the dataset are PPO plans, which use a network but allow forout‐of‐network usage at higher levels of cost‐sharing. While a feature of PPO plans, the out of networkcost sharing parameters were not evaluated as part of this project.As shown below, the majority of self‐insured plans are found in employers of size 100 or greater. Whilein the initial tables, funding does not appear to make an appreciable difference in actuarial value, thiswill be further examined by ARC in the final step of the full analysis.Table 4.2. Participants and Average AV by Employer Size and Funding, NCS Group 0‐99100‐499500 % 6% 5% 712High deductible health plans were not directly categorized as such in the NCS data. Rather, they were determined by ARC,based on year‐specific characteristics. For the NCS 113 dataset, high deductible plans had either A) an individual deductible atleast 1300 and OOP max no more than 6450 that cover all services with no service‐specific copays (beyond 0 forpreventive), or B) a deductible at least 1000 and the presence of a health savings account.Page 9
Final Report: Analysis of Actuarial Values and Plan FundingContract DOLJ139335155Order Number DOL‐OPS‐15‐T‐00170Deliverable 2dTable 4.3. Participants and Average AV by Average Hourly Wage and Funding, NCS Group 11313TotalSelf‐InsuredPurchasedAvg. HourlyWage 15 15‐ 30 30 % ofParticipants28%42%30%AverageAV0.840.850.85% ofParticipantsAverageAV29%40%31%0.820.840.85% ofParticipantsAverageAV27%43%30%0.850.850.85Table 4.4. Participants and Average AV by Union Status of Covered Workers and Funding, NCSGroup nNon‐Union% ofParticipants14%86%AverageAV0.890.84% ofParticipantsAverageAV15%85%0.890.83% ofParticipantsAverageAV13%87%0.890.85Table 4.5. Participants and Average AV by Full or Part‐time Status of Covered Workers andFunding, NCS Group 113TotalFull/PartTime StatusFull TimePart Time% Purchased% ofParticipantsAverageAV% n addition to the above summary tables which look at average actuarial values, ARC also producedtables that look at the distribution of actuarial values by plan type and funding. A subset of these tables,from the NCS 113 dataset, calculated using ARC’s methodology, is shown below. The full set of tablesare included in Appendix C. All distributional tables are based on weighted counts of plan participants.Table 5.1., below, shows the distribution of average actuarial values for all plans by type of funding (self‐insured or purchased). When looking at the dataset containing all plans, the mean AV is very close to themedian (or 50th percentile) value.13It should be noted, however, that if a single employer plan spanned multiple rows it was weighted relative to the proportionof covered workers by wage group.Page 10
Final Report: Analysis of Actuarial Values and Plan FundingContract DOLJ139335155Order Number DOL‐OPS‐15‐T‐00170Deliverable 2dTable 5.1. All Plans ‐ AV by Funding, NCS Group 113(weighted participants)Self‐TotalPurchasedInsuredMean .9560.9510.957Table 5.2., below, displays the distribution of actuarial values for HMO plans. For these plans, the meanis less than the median, and in general closer to the 40th percentile. Since the mean is less than themedian, while there are generally more employees in plans with higher AVs, it is the smaller number inthe much lower value plans that brings the average down.Table 5.2. HMO Plans ‐ AV by Funding, NCS Group113 (weighted participants)Self‐TotalPurchasedInsuredMean .9660.9770.965Table 5.3., below, displays the distribution for point‐of‐service (POS) plans.Page 11
Final Report: Analysis of Actuarial Values and Plan FundingContract DOLJ139335155Order Number DOL‐OPS‐15‐T‐00170Deliverable 2dTable 5.3. POS Plans ‐ AV by Funding, NCS Group 113(weighted participants)Self‐TotalPurchasedInsuredMean .9640.9670.956Table 5.4., below, displays the distribution for preferred provider (PPO) plans.Table 5.4. PPO Plans ‐ AV by Funding, NCS Group 113(weighted participants)Self‐TotalPurchasedInsuredMean .9570.9490.963Finally, Table 5.5., below displays the distribution for high deductible plans by funding. By nature, theseplans offer less generous cost‐sharing to the average enrollee. NCS data supports this expectation, ashigh deductible plans exhibit lower mean and median AVs than other plan types and no plans with AV of0.90 or above (as calculated by the ARC ratebook).Page 12
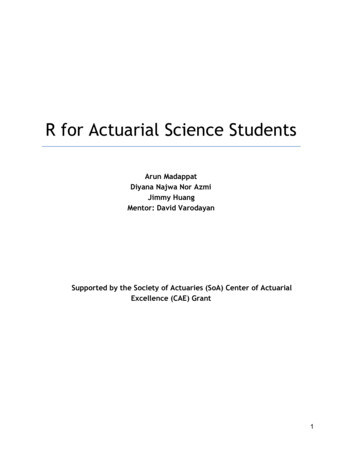
Final Report: Analysis of Actuarial Values and Plan FundingContract DOLJ139335155Order Number DOL‐OPS‐15‐T‐00170Deliverable 2dTable 5.5. High Deductible Plans ‐ AV by Funding,NCS Group 113 (weighted participants)Self‐TotalPurchasedInsuredMean .8570.8500.863The distribution of fee‐for‐service (FFS) plans by funding type is not shown, as there were very few plansof this type in the NCS (as well as very few employer plans of this type remaining).Regression AnalysisARC conducted regression analyses using NCS data to test whether plan funding (whether a plan is self‐insured or purchased) has a significant effect on actuarial value. Separate analyses were conducted foreach NCS dataset as well as a combined dataset containing pooled data from all available datasets (NCS110 ‐ NCS 113).14For many records in the raw NCS data, plan funding status was imputed by BLS staff. ARC conducted asensitivity analysis to examine whether the inclusion of imputed records impacted the results. ARCperformed separate analyses including and excluding these records in order to assess—and if necessary,control for—the impact of the imputations of plan funding status on the regression results.Summary statistics for variables used in the regression analyses of pooled data are shown in the tablebelow:14 The impact of funding on actuarial value was found to be statistically significant in some NCS datasets, when running themodel separately for each year; however the magnitude, significance, and direction of this impact are inconsistent across thedatasets. Results for the regression analyses conducted separately for each NCS data set can be found Appendix D.Page 13
Final Report: Analysis of Actuarial Values and Plan FundingContract DOLJ139335155Order Number DOL‐OPS‐15‐T‐00170Deliverable 2dTable 6.1. Summary Statistics of NCS Pooled Data, NCS 110‐113 (unweighted)VariableMean# Observations (approx.)Self‐insuredEmployer SizeAverage Hourly WageFull‐TimePlan re, nformationFinance/Real EstateProfessional andBusiness ServicesEducation and HealthServicesOther ServicesCensus DivisionNew EnglandMiddle AtlanticEast South CentralSouth AtlanticEast North CentralWest North CentralWest South CentralMountainPacificExcl. records with imputed'Self‐insured' variableAll DataStd. Dev73,600MeanStd. Dev58,8000.4172,250 30.370.9310.4934,312 22.650.25370.4522,350 30.740.92680.4984,423 1Page 14
Final Report: Analysis of Actuarial Values and Plan FundingContract DOLJ139335155Order Number DOL‐OPS‐15‐T‐00170Deliverable 2dARC used a multivariable OLS regression model to estimate the impact of plan funding on actuarialvalue, controlling for various other factors. For each plan in a given establishment in each dataset, ARCestimated the following equation:AVp,t β0 β1Self‐Insuredp,t βiXp,twhere AV is the outcome variable denoting the plan’s Actuarial Value (as calculated by the ARCratebook) and Self‐Insured is the independent variable of interest. Self‐insured is a binary variable forplan funding where 1 Self‐Insured and 0 Purchased. In the equation above, X represents theindependent binary15 control variables of employer and employee characteristics such as employer size,average hourly wage, plan type, full vs part time status, industry, and geographic region. Year fixedeffects16 were also included in the model.The NCS samples at the establishment level and tracks plans offered to various groups of workers withinan establishment. In a given year, an establishment can offer multiple plans. An establishment can alsobe surveyed in multiple years. Due to this structure, ARC clustered the data by establishment and plan.In addition to the regression analyses, ARC tested correlation and covariance of the independentvariables (i.e. self‐insured and the control variables) and found that all coefficients were relatively closeto zero. ARC also tested the correlation of the dependen
the NCS plans using Excel based macros. ARC automated the MVC calculation process for running large numbers of plans, without change to the calculation routines themselves. . For the regression analysis, matching and statistical analysis were performed at BLS, using SAS statistical software which was available on the BLS computer system. .