Transcription
Overview of the 2010 Haiti EarthquakeReginald DesRoches,a) M.EERI, Mary Comerio,b) M.EERI,Marc Eberhard,c) M.EERI, Walter Mooney,d) M.EERI,and Glenn J. Rix,a) M.EERIThe 12 January 2010 Mw 7.0 earthquake in the Republic of Haiti caused anestimated 300,000 deaths, displaced more than a million people, and damagednearly half of all structures in the epicentral area. We provide an overview of thehistorical, seismological, geotechnical, structural, lifeline-related, and socioeconomic factors that contributed to the catastrophe. We also describe some ofthe many challenges that must be overcome to enable Haiti to recover from thisevent. Detailed analyses of these issues are presented in other papers in thisvolume. [DOI: 10.1193/1.3630129]INTRODUCTIONOn 12 January 2010, at 4:53 p.m. local time, a magnitude 7.0 earthquake struck theRepublic of Haiti, with an epicenter located approximately 25 km south and west of the capital city of Port-au-Prince. Near the epicenter of the earthquake, in the city of Léogâne, it isestimated that 80%–90% of the buildings were critically damaged or destroyed. The metropolitan Port-au-Prince region, which includes the cities of Carrefour, Pétion-Ville, Delmas,Tabarre, Cite Soleil, and Kenscoff, was also severely affected. According to the Government of Haiti, the earthquake left more than 316,000 dead or missing, 300,0001 injured, andover 1.3 million homeless (GOH 2010). According to the Inter-American DevelopmentBank (IDB) the earthquake was the most destructive event any country has experienced inmodern times when measured in terms of the number of people killed as a percentage of thecountry’s population (Cavallo et al. 2010).The Republic of Haiti occupies the western third (27,750 km2) of the island of Hispaniola, located in the northeast Caribbean between Puerto Rico to the east and Jamaica andCuba to the west (Figure 1), and had a population of approximately 9.6 million prior to theearthquake. The metropolitan area surrounding its largest city, Port-au-Prince, has an estimated population of 3 million. Haiti has been impacted by other natural disasters in recentyears. In 2008, more than 800 people were killed by a series of four hurricanes and tropicalstorms that struck Haiti during a two-month period.a)Georgia Institute of Technology, School of Civil and Environmental Engineering, 790 Atlantic Dr., Atlanta GA30332-0355b)University of California Berkeley, Department of Architecture, 232 Wurster Hall, Berkeley, CA 74720-1800c)University of Washington, Department of Civil and Environmental Engineering, 233 More Hall, Seattle, WA98195-2700d)Earthquake Science Center, US Geological Survey, MS977, 345 Middlefield Rd., Menlo Park, CA 940251The number of casualties is a highly debated issue, with estimates ranging from 70,000 to 316,000. At the timeof this publication, the official number from the Government of Haiti is 316,000.S1C 2011, Earthquake Engineering Research InstituteEarthquake Spectra, Volume 27, No. S1, pages S1–S21, October 2011; V
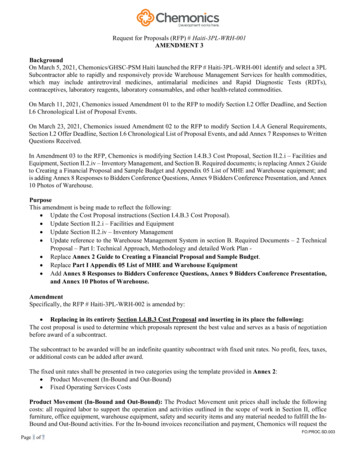
S2DESROCHES ET AL.Figure 1. Geographic and tectonic setting of the island of Hispaniola, of which Haiti occupiesthe western third. The 2010 earthquake occurred on or near the Enriquillo-Plantain Garden faultzone and was preceded by earthquakes in southern Haiti in 1751 (two events, in October andNovember), 1770, and 1860. The location of the main shock of 12 January 2010 and aftershocksare shown in Figure 2.The damage to the infrastructure from the earthquake in Haiti was staggering. Morethan 300,000 homes collapsed or were critically damaged. It is estimated that 60% of thenation’s administrative and economic infrastructure was lost, and 80% of the schools andmore than 50% of the hospitals were destroyed or damaged (GOH 2010). More than 180government buildings and 13 out of 15 key government offices collapsed, including thepresidential palace and parliament. The partial destruction of the main port of Port-au-Princeand blockage of roads from debris hampered the response and recovery for many months after the earthquake. Even nine months after the earthquake, the destruction continued to disrupt the lives of many Haitians. The Interim Haitian Reconstruction Commission estimatedthat as of 12 October, 1.3 million people were still displaced—either in one of the morethan 1,300 camps and other settlements registered by the International Organization forMigration (IOM) or in temporary housing situations in both the quake-affected zone and innon-affected regions (IHRC 2010).Overall losses and damages from the earthquake are estimated to be between US 7 billion and US 14 billion (approximately 100%–200% of Haiti’s gross domestic product),making this the most costly earthquake event in terms of the percentage of a country’s grossdomestic product (Cavallo et al. 2010).PRE-EARTHQUAKE HAITI: SETTING THE CONTEXTIt is difficult to quantify the impact of pre-earthquake conditions on the devastationresulting from the earthquake in Haiti. However, there is no doubt that the dire socioeconomic conditions that existed prior to the earthquake were a major contributor to the
OVERVIEW OF THE 2010 HAITI EARTHQUAKES3resulting damage. Following a slave rebellion in 1804, Haiti became the first free blacknation in the world. It was subsequently forced to pay France a massive indemnity for properties lost in that rebellion, and was ostracized socially and economically by countries allaround the world. Haiti subsequently became entrapped in a cycle of poverty and misgovernment from which it has never emerged (Heinl 1996).Haiti is the poorest country in the Western Hemisphere, ranking 145 out of 169 on theUN Human Development Index (UNDP 2010). Less than 10% of the population has accessto potable tap water and less than one-third has access to electricity, even intermittently(UNSD 2010), which are the lowest respective percentages in the Western Hemisphere.More than half of Haiti’s population lives on less than US 1 per day, and more than threequarters live on less than US 2 per day. Haiti has the highest rate of mortality amonginfants, children under 5, and during maternity of any country in the Western Hemisphere(UNSD 2010). Haiti’s exports are small: 10% of the gross domestic product. Haiti’s pooreconomic performance is, in part, the result of the decline of its agricultural sector, which inturn is due in large part to the degradation of the environment. Haiti ranks 155 out of 163countries when it comes to general environmental degradation. For years, Haitians have cutdown trees to use as cooking fuel, resulting in less than 3% of Haiti being covered by forest,a stark contrast to the lush forests of its neighbor, the Dominican Republic. The environmental degradation only increases Haiti’s vulnerability to natural hazards.In addition to its poor socioeconomic standing, Haiti’s limited recent history of largeearthquakes (Figure 1) left it unprepared for the 12 January 2010, earthquake. Haiti had fewseismologists and no seismic network in the country. It only had one seismic hazard map,which was outdated and lacked sufficient detail to be useful. The best geological map datedto 1987 (Lambert et al. 1987). The building code was outdated, rarely used, and notenforced (CUBiC 1985). There was no earthquake preparedness program and no contingency plan for earthquakes. The typical university curriculum did not include seismicdesign, seismology, or the geosciences.SEISMOLOGICAL ASPECTSGEOLOGY AND TECTONICSThe geologic evolution of Hispaniola can be traced to the Mesozoic breakup of Pangeaand the creation of the Atlantic Ocean. This process resulted in the formation of the Caribbean microplate, with subduction zones forming around the margins (Garcia-Casco et al.2008). The geology of Hispaniola, including Haiti, consists of igneous rocks formed withina volcanic island arc, as well as abundant marine sedimentary rocks that have accreted atthe oceanic subduction margin (Woodring et al. 1924, Maurrasse 1982).The 12 January 2010 earthquake occurred on or near the Enriquillo-Plantain GardenFault, a prominent strike-slip fault that is clearly evident in high-resolution relief maps ofthe Southern Peninsula of Haiti. Field studies confirmed that the mapped Enriquillo-PlantainGarden Fault in the epicentral region separates basaltic rocks south of the fault from marinesedimentary rocks (chalk, sandstone, and limestone) to the north. Thus, the fault can be easily discerned by its morphology and geology. However, detailed field and geophysical studies indicate that the fault rupture was a complex event that involved slip on more than just
S4DESROCHES ET AL.the Enriquillo-Plantain Garden Fault (Nettles and Hjörleifsdóttir 2010, Prentice et al. 2010,Calais et al. 2010, Hayes et al. 2010).SEISMICITYFor several decades prior to the 12 January 2010 earthquake, seismic activity within theisland of Hispaniola had been heavily concentrated in the eastern two-thirds of the island inthe Dominican Republic, and Haiti had been relatively seismically quiescent. Indeed, sincethe establishment of a modern global seismic network in 1964, the Port-au-Prince region ofsouthern Haiti has experienced only one earthquake of magnitude greater than 4.0, with several additional events occurring 100 km to the west. However, studies of historical seismicity have established that large (magnitude 7.0 or greater) earthquakes have struck the Portau-Prince region in the historic past. These earthquakes are all attributed to movement onthe east–west oriented Enriquillo Fault (Figure 2). The largest earthquakes occurred in 1751(two events), 1770, and 1860 (O’Loughlin and Lander 2003). One of the two earthquakesof 1751 occurred near the longitude of Port-au-Prince and destroyed buildings throughoutthe city (modified Mercalli intensity [MMI] of X). The 1770 earthquake occurred anFigure 2. Topographic map of the Southern Peninsula of Haiti: (a) Port-au-Prince, (b) Léogâne,and (c) Port Royal. The east–west oriented Enriquillo Fault (red line) passes the main shock epicenter (single larger focal mechanism SE of Léogâne). The Enriquillo Fault is a left-lateral faultthat accommodates 7þ 2 mm yr of strain (Manaker et al. 2008). Aftershocks (yellow circles)are concentrated to the west of the main shock, and their focal mechanisms (orange) indicatereverse faulting. Panels centered on Léogâne indicate the extent and magnitude of fault slip onthree rupture planes (Figure 3).
OVERVIEW OF THE 2010 HAITI EARTHQUAKES5estimated 30–50 km further to the west on the Enriquillo Fault, and once again resulted inthe widespread destruction of buildings in Port-au-Prince and Léogâne (O’Loughlin andLander 2003). The 1860 earthquake was located still further to the west of Port-au-Princeand was observed to cause uplift of the sea floor. This uplift is significant because it indicates that crustal strain accommodation and release is partitioned between pure strike-slipand reverse-faulting structures (Nettles and Hjörleifsdóttir 2010, Hayes et al. 2010, Calaiset al. 2010).THE MAIN SHOCK AND AFTERSHOCKSThe 12 January 2010 event occurred at 04:53:10 p.m. local time. The U.S. GeologicalSurvey (USGS) located the epicenter at 18.44 N, 72.57 W, which placed the event 25 kmWSW of Port-au-Prince, on or near the Enriquillo Fault. The estimated depth was 13 km,but the lack of local seismic data made the precise depth uncertain. The USGS assigned ahorizontal uncertainty of þ 3.4 km. The first-motion focal mechanism (ref) for the mainshock indicated left-lateral oblique-slip on an east–west oriented fault. However, there wasclear evidence of coastal uplift north of the Enriquillo Fault (Hayes et al. 2010) as well asvertical ground deformation imaged by interferometric synthetic aperture radar (InSAR)data. These observations require significant slip on a nearby reverse fault (Figure 2). The finite fault model by Hayes et al. (2010) showed slip on three fault planes and satisfies seismologic, geodetic, and geological observations. This model showed a maximum slip of 3.5m on the reverse fault (Figure 3). The earthquake source zone (i.e., the surface area of thefault that slipped) was quite compact, with a down-dip dimension of approximately 15 kmand an along-strike dimension of close to 40 km. This source dimension is about two-thirdsthe size of a typical Mw 7.0 earthquake. The earthquake rupture was very abrupt and sharp;maximum moment release occurred in the first 4–8 seconds of the fault slip, and 80% of themoment release occurred in 12–14 seconds (Hayes et al. 2010).The main shock was followed within 20 minutes by two large aftershocks with momentmagnitudes of 6.0 and 5.7, respectively. Eight days after the main shock, on 20 January2010, a Mw 5.9 aftershock occurred. Overall, the early aftershock sequence from this earthquake was three times more productive than a typical aftershock sequence in California.SEISMOLOGICAL AND GEODETIC FIELD ACTIVITIES DURING 2010The first accelerometer to measure aftershocks was installed on the grounds of the U.S.Embassy in Port-au-Prince on the evening of 27 January 2010 (Eberhard et al. 2010). InMarch 2010, additional temporary seismographs were deployed by the USGS and Frenchand Canadian research groups and these data were being interpreted at the time of this writing. GPS and InSar data have been collected (Calais et al. 2010, and references therein),and Coulomb stress changes imparted by the 12 January 2010 event have been calculated(Lin et al. 2010). These data and additional analytical models will be used to guide the nextgeneration of seismic hazard maps (Frankel et al. 2010).GEOTECHNICALThe earthquake-affected region is a physiographically diverse area with a complex geologic history. The topography within the study area is relatively rugged, with steep mountain
S6DESROCHES ET AL.Figure 3. Geometry of fault ruptures for the January 2010 Haiti earthquake. Fault plane A (redoutline) contains the earthquake hypocenter (locus of slip initiation; red star) and is a steeplydipping (70 ) left-lateral strike-slip fault. Fault plane B (blue outline, top) is a blind thrust fault(55 dip), shows the largest slip displacement (up to ca. 350 cm) and is responsible for approx.80% of the seismic moment released during the earthquake. Fault plane C (black outline, bottom) is a reverse fault with a modest amount (ca. 100–200 cm) of slip (from Hayes et al. 2010).ranges and hillfronts, deeply incised streams and narrow intermountain stream valleys, andbroad coastal delta fans and valleys. Quaternary deposits in the epicentral zone include Holocene to late Pleistocene fluvial alluvium (channel, terrace, floodplain overbank deposits) deposited in the Port-au-Prince valley and interior incised river valleys, alluvial fan and colluvial wedge deposits along the margins of larger valleys, coastal delta fan complexes wherelarger streams discharge into the sea along the coast, localized organic sediments withinmarshes and swamps, and beach sands along protected portions of the coast. Port-au-Princespans a broad region from the relatively level floor of a large alluvial valley underlain byHolocene to Pleistocene deposits, southward to low hills underlain by Mio-Pliocene deposits.Léogâne and Carrefour are located on large delta fans and are underlain by Holocene toPleistocene alluvium. Coastal areas adjacent to Port-au-Prince are mostly composed of artificial fill placed during westward expansions of the city during the past 200 years. Post-earthquake reconnaissance visits to Haiti have provided opportunities to acquire detailed information on geologic and geotechnical conditions throughout the affected area (Cox et al. 2011,Green et al. 2011, Rathje et al. 2011, Hough et al. 2011, Lekkas and Carydis 2011).
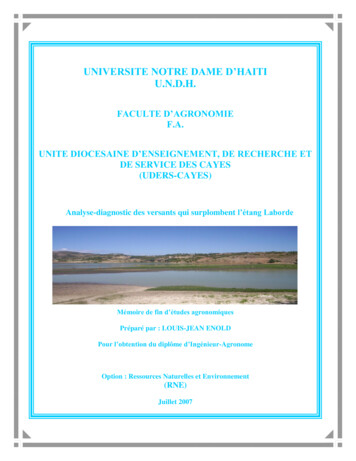
OVERVIEW OF THE 2010 HAITI EARTHQUAKES7The observed structural damage from the earthquake correlates well with these geologicconditions. Ground-motion amplification was a primary factor in alluvial soils in the northcentral and coastal region of Port-au-Prince, Carrefour, and Léogâne. Hough et al. (2010)used weak-motion data from aftershock recordings at seismograph stations deployed following the earthquake to determine that the mean amplification ratio of peak ground acceleration (PGA) for stations on alluvium was 1.78 þ 0.58 compared to a reference stationon hard rock. Rathje et al. (2011) documented that the largest concentrations of damageoccurred in areas underlain by Holocene alluvium with average shear wave velocities in theupper 30 m (VS30) of approximately 350 m s, which corresponds to National EarthquakeHazards Reduction Program (NEHRP) Site Class D.Large concentrated zones of damage also occurred in the southern portion of Port-auPrince that extends into the hills underlain by Mio-Pliocene, weakly cemented deposits. Inthese areas, both topographic amplification and site effects contributed to higher levels ofshaking. Hough et al. (2010) compared weak-motion recordings at sites located in the foothills of Port-au-Prince with a hard-rock reference station and found that the PGA was amplified by a factor of 2.94 þ 1.06; amplification ratios as high as 5 were calculated for frequencies of several Hertz. Rathje et al. (2011) and Hough et al. (2011) have used digitalelevation models to correlate observed damage patters with topographic features in the area.Artificial fill in the port areas of Port-au-Prince and Carrefour experienced extensiveliquefaction, lateral spreading, and settlement damage. At the Port de Port-au-Prince, liquefaction-induced lateral spreading (Figure 4) resulted in the collapse of the pile-supportedNorth Wharf, damage to two steel-frame warehouses, and other port facilities (Green et al.2011, Werner et al. 2011). Geotechnical site investigations performed after the earthquakeincludes soil borings with standard penetration tests (SPT), dynamic cone penetration tests(DCPT), and surface wave (MASW and SASW) tests (Green et al. 2011). Grain size analyses indicated that the coarse-grained soils were well-graded mixtures of sands and gravelsFigure 4. Liquefaction-induced lateral spreading leading to the collapse of the North Wharf atthe Port de Port-au-Prince.
S8DESROCHES ET AL.with median grain sizes ranging from 0.2 mm to 10 mm. The calcium carbonate (CaCO3)content of the materials was 80%–90% and is attributed to the marine origin of the fill materials. Level-ground liquefaction analyses performed using the SPT and DCPT data indicatedthat the liquefaction potential of the soils is very high, which is consistent with the extentand severity of liquefaction-induced ground failures at the port. Green et al. (2011) alsocompare observed values of permanent deformation with estimates obtained from variousempirical methods and found that the observed values generally exceed the estimated values. Ground-motion amplification in the soft fill soils was likely a contributing factor to thepartial collapse of and extensive damage to the remaining portion of the South Pier at thePort de Port-au-Prince (Werner et al. 2011).Many of the road failures observed along the coast west of Carrefour occurred wherethe road crosses marshy ground and the distal ends of small alluvial valleys. Settlement andlocalized creep slumping of sediments underlying the roadbed appear to be responsible formany of the road failures, rather than lateral spread failure, because cracking typically wasconfined to the roadbeds and fill and did not extend through natural soils shoreward of theroadways. Localized liquefaction of loose, saturated sediments in these areas may have contributed to the road failures, but was not the major factor.Numerous landslides and rockfalls occurred within the Mio-Pliocene and older limestone bedrock in steep slopes and roadcuts within the epicentral zone. In some cases thesefailures appear to have been restricted to colluvial soil and fractured dilated rock within aweathered zone that extends about 1–3 m deep into the slopes. However, some deeperseated slumps and debris avalanche/slide failures occurred in less-weathered, deeper bedrock in steep mountainous slopes. These failures appear in part to be influenced or controlled by bedrock joints or weak zones. In places, developments on steep slopes appear tohave been impacted by slope raveling or foundation sliding slumping. Additional analysesof landslides in the epicentral zone are described in Liu et al. (2011).PERFORMANCE OF BUILDINGSThe earthquake caused extensive damage to buildings throughout the Port-au-Princemetropolitan area, and in the rural areas and towns to the west and south of the city. Nearlyall of the severe damage and collapses appeared to occur in buildings that were constructedwithout considering the effects of earthquakes. The majority of buildings that were designedfor earthquakes and that were well constructed did not collapse in the earthquake.BUILDING INVENTORYA nationwide census conducted in 2003 documented many characteristics of Haitian society, including the frequency of common building types, as well as the materials used toconstruct the walls, roofs, and floors. The percentage of each type of building is reported forurban and rural areas in Table 1, which was compiled with data from the Haitian Ministryof Statistics and Informatics (IHSI). Within urban areas, 78% of the buildings were classified as one-story houses and another 14% were classified as multistory houses or apartments(IHSI 2010). The remaining 8% of the buildings consisted of slum housing or traditionalforms of construction (two common types are kay atè, buildings with a combined roof andwalls, and ajoupas, rural homes with thatch, straw, or palm leaf roofs). Within rural areas,
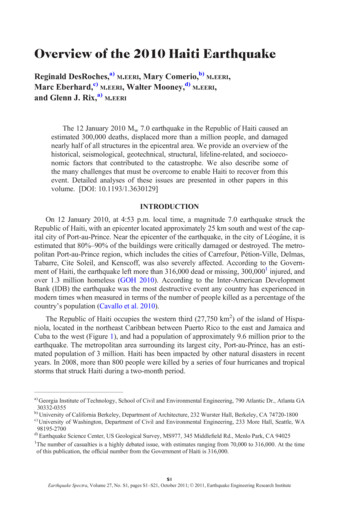
OVERVIEW OF THE 2010 HAITI EARTHQUAKES9Table 1. Distribution of building types in urban and rural areas (IHSI 2010)LocationType of BuildingKay atè (combined roof and walls)Taudis (slum housing)Ajoupas (rural home with roof madeof thatch, straw, or palm leaves)One-Story HouseMultistory House ApartmentOthersUrban Areas (%)Rural Areas (%)Combined 0.372.55.40.4ordinary one-story houses were again most common (69%), multistory structures were rare( 1 percent), and ajoupas made up 25% of the building inventory.The wall materials for each building type in urban areas are summarized in Table 2,which was also developed from the IHSI data. In urban areas, concrete block walls predominated (79%), particularly in multistory houses and apartments (97%). In rural areas, themost common wall material was earth (33%), followed by concrete block (22%), and clissage (19%), consisting of intertwined sticks, twigs, and branches. Considering all buildingtypes and regions, approximately two-thirds (69%) of the structures had metal roofs, but formultistory houses and apartments, 89% had roofs made of concrete (IHSI 2010).Typical reinforced concrete frame buildings with concrete block infill had numerousvulnerabilities known to cause seismic damage. Figure 5 shows a typical low-rise reinforcedconcrete frame building with infill concrete block walls that was under construction at thetime of the earthquake. Columns were slender with depths in the range of 200 mm to 250mm. Such columns were often reinforced with 4 #4 bars, sometimes deformed and sometimes smooth. Column and joint transverse reinforcement was minimal (e.g., #2 smoothties) and spaced at a distance roughly equal to the column depth. Concrete and mortarTable 2. Distribution of wall materials for each building type in urban areas (IHSI 2010)Wall MaterialType of BuildingKay atè (combined roof and walls)Taudis (slum housing)Ajoupas (rural home with roof madeof thatch, straw, or palm leaves)One-Story HouseMultistory House ApartmentOthersAllConcreteBlock (%)Earth(%)Wood/Planks 72.90.66.23.23.00.00.73.78.01.925.78.8
S10DESROCHES ET AL.Figure 5. Residential concrete block slab construction.quality appeared to vary significantly. In the building shown Figure 5, concrete blocks wereplaced outside the frame lines. More typically, the concrete block walls were used as infill.In some structures, column steel splices were placed directly above the elevation of thefloors.BUILDING PERFORMANCEDamage to residences and commercial buildings was widespread. According to Figure11 (USAID 2010), approximately 40%–50% of buildings were “destroyed” in Carrefourand Gressier, communes near Port-au-Prince. In downtown Port-au-Prince, Eberhard et al.(2010) found that 28% of the 107 buildings surveyed had collapsed partially or totally, andan additional 33% were damaged enough to require repairs. The damage was even higher inLéogâne, the city nearest the epicenter. According to Figure 11, 80%–90% of buildingsthere were destroyed.Two adjacent structures in downtown Port-au-Prince illustrate the consequences of poorseismic proportioning and detailing. Figure 6 shows the collapse of the multistory TurgeauHospital, constructed in 2008. The building’s lateral-force resistance was provided by a reinforced concrete frame with masonry infill. As with the residence shown in Figure 5, thecolumns were slender, and the columns and joints had little transverse reinforcement. Incontrast, the Digicel building (Figure 7) across the street had only minor structural damage,consisting mainly of concrete spalling at the base of the columns. The building had beendesigned to resist earthquakes; it had much larger columns with closely spaced ties andincluded shear walls.It appears that some buildings performed better than their neighbors because of theirlow mass. For example, the wood-frame building shown in Figure 8a was adjacent to a collapsed reinforced concrete structure. Similarly, the one-story church shown in Figure 8bhad a light-metal roof supported by masonry walls. Although it appeared to be constructedwith materials of poorer quality than those used in a neighboring concrete bearing-wallhouse, the masonry church structure suffered less damage.
OVERVIEW OF THE 2010 HAITI EARTHQUAKES11Figure 6. Turgeau hospital in downtown Port-au-Prince: (a) Before the earthquake (SimonYoung CaribRM), and (b) collapsed structure after the earthquake.PERFORMANCE OF LIFELINESBRIDGESThere are very few bridges in Haiti, and most are short, single-span bridges or culverts.We did not learn of any bridge collapses attributable to the earthquake. Within Port-auPrince, most of the crossings over streams were accommodated by box culverts, which didnot appear to be damaged. Along the Route Nationale No. 2, small streams were alsospanned by culverts. The culverts themselves were not damaged, but in at least one case,the approaches to the culvert settled relative to the culvert itself.The main river crossings on Nationale No. 2 were spanned by bridges with precast girders resting on cast-in-place reinforced concrete bents and supporting a cast-in-place deck.We observed damage to two such bridges. The bridge over the Momance River had minorpounding damage at one of the intermediate supports. In the Carrefour section of Port-auPrince the external shear keys (Figure 9) of a similar bridge were damaged at both intermediate supports. This failure was apparently caused by the lack of hook anchorage at the endof the top beam reinforcement.WATER AND WASTEWATERThe main public water system in Port-au-Prince is supplied by a series of springslocated in the nearby mountains. The water is chlorinated in the spring boxes and sent to thedistribution system, which serves 1,000,000 people (Edwards 2010). Prior to the earthquake, this supply was unreliable, and the water was not drinkable without further treatment. There were relatively few water main breaks, which is unusual for a system this large.Most of the breaks were repaired within one to two weeks of the earthquake.There were no working wastewater treatment plants in Haiti. In the metropolitan areas,wastewater was discharged in open drainage channels and directed to Port-au-Prince Bay.Many of the drainage channels were blocked by debris and trash.
S12DESROCHES ET AL.Figure 7. Damage to two structures across the street from one another in Port-au-Prince: (a)Reinforced concrete frame with masonry infill, and (b) new Digicel building under constructionappears to be nearly undamaged.
OVERVIEW OF THE 2010 HAITI EARTHQUAKES13Figure 8. Light buildings that were damaged but did not collapse: (a) Wood-frame building,and (b) church with masonry walls and light-metal roof.Figure 9. Damage to shear key at intermediate support.
S14DESROCHES ET AL.TELECOMMUNICATION SYSTEMSThe telecommunication system in Haiti is comprised of a single wireline carrier (Teleco), and three wireless mobile vendors (Edwards 2010). Teleco is a wireless-based utilityproviding service through a network similar to those operators throughout the United States.The earthquake caused the collapse of the Teleco building in Port-au-Prince. At severallocations throughout the Port-au-Prince metropolitan region, the placement of COWS (Cellson Wheels or Mobile Cellular System and Telescoping Antenna Array) outside of severaltelephone central offices was a temporary solution to enable inter-exchange traffic.Digicel, one of Haiti’s largest wireless cellular providers, had significant damage due tothe collapse of buildings onto antennas. According to Digicel officials, it was estimated that20% of the company’s network was damaged beyond repair and unable to return to service.By 27 January 2010, the company had restored 92% of radio frequency capability with theregulator’s grant of additional spectrum for a period of 12 months.SOCIOECONOMIC IMPACTResearchers distinguish between emergencies, disasters, and catastrophes (Comerio 1998,Teirney 2008), and by all measures, the earthquake in Haiti can certainly be classified as amajor catastrophe—perhaps the worst in modern history. Not only
UN Human Development Index (UNDP 2010). Less than 10% of the population has access to potable tap water and less than one-third has access to electricity, even intermittently (UNSD 2010), which are the lowest respective percentages in the Western Hemisphere. More than half of Haiti's population lives on less than US 1 per day, and more than .