Transcription
2018 BRINGING ADMINISTRATORS TOGETHER CONFERENCEHow to Get Startedwith Tableau &Sample DashboardsApril 5, 20181:45 PM – 2:45 PMConference Sponsors: The Office of the Chancellor, Budget & Financial Administration / Human Resources, the Office ofthe Provost and Vice Chancellor for Academic Affairs, the Office of the Vice Chancellor for Research, and the Office ofBusiness and Financial Services
2018 BRINGING ADMINISTRATORS TOGETHER CONFERENCEWorkshop Presenter(s) Marissa KingAssociate Director, Budget & Finance, Collegeof Pharmacymlking2@uic.edu Dimuthu TilakaratneAssistant Vice President for Decision Support,Administrative Information TechnologyServicesdpt@uillinois.edu2
2018 BRINGING ADMINISTRATORS TOGETHER CONFERENCEPlease Turn off cell phones. Avoid side conversations. Raise your hand with questions at any timethroughout the presentation. There will alsobe extra time for questions at the end. Sign the attendance roster. Complete the evaluation at the end of theworkshop.3
2018 BRINGING ADMINISTRATORS TOGETHER CONFERENCEWorkshop Objectives Understand how to get Tableau and whereyou can find training resources Learn how Tableau can benefit your college orunit Demonstrate how to create basicvisualizations and dashboards and publishthem to Tableau server Generate visualization ideas based on sampledashboards4
2018 BRINGING ADMINISTRATORS TOGETHER CONFERENCETopics CostTrainingPreparing & Importing DataCreating Simple VisualizationsCreating DashboardsPublishing DashboardsExample Projects5
2018 BRINGING ADMINISTRATORS TOGETHER CONFERENCECost Regular license– 1200 per license for Tableau DesktopProfessional– 300 per year for maintenance (to upgradeversion, etc.) Subscription– 70 user/month (Billed Annually) Free 14-day trial available at:https://www.tableau.com/products/desktop6
2018 BRINGING ADMINISTRATORS TOGETHER CONFERENCETraining Free training videos are available at:https://www.tableau.com/learn/training Set up your free UIC Lynda account(http://go.uic.edu/Lynda) to access Tableau trainingand tutorials 048-0.html) The Illinois Higher Education Tableau User Group (ledby AITS) has quarterly meetings available via webinarand an online seducation-tableau-user-group7
2018 BRINGING ADMINISTRATORS TOGETHER CONFERENCEPreparing & Importing Data Tableau can connect to manydifferent file and server typesthat contain data (includingdirectly to the EDW). However, Excel data is themost common and easiest towork with so that is what wewill focus on here.8
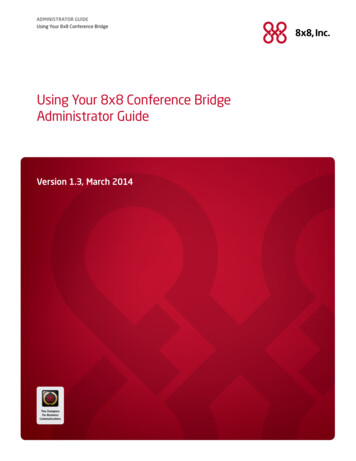
2018 BRINGING ADMINISTRATORS TOGETHER CONFERENCEPreparing & Importing Data The easiest data to work with in Tableau isunformatted, row-oriented data without extraheaders, spacing, or text.Tuition Comparison, 2017-18InstitutionYearAmountTuition TypeChicago State2017 23,616In-StateChicago State2017 35,400Out-of-StateChicago State2018 23,616In-StateChicago State2018 35,400Out-of-StateUIC2017 24,920In-StateUIC2017 40,360Out-of-StateUIC2018 24,920In-StateUIC2018 f-State In-StateOut-of-StateChicago State 23,616 35,400 23,616 35,400UIC40,360 24,920 40,360 24,920 #!/vizhome/Pharm D TuitionTrends/TuitionData9
2018 BRINGING ADMINISTRATORS TOGETHER CONFERENCEPreparing & Importing Data We have found it easiest to prepare our data in Excelso that it is formatted correctly for Tableau. However, Tableau has a “Data Interpreter” that canattempt to clean up your data if it contains extraheaders, spacing, or text, or multiple tables in onesheet. You can also pivot your data within Tableau so thatcolumn-oriented data is manipulated into roworiented data.10
2018 BRINGING ADMINISTRATORS TOGETHER CONFERENCEPreparing & Importing Data At this step, you can also changedata types (for example, from astring or text value to a number),join multiple data sources together,or filter your data sources. /enus/joining tables.html /enus/filtering datasource.html11
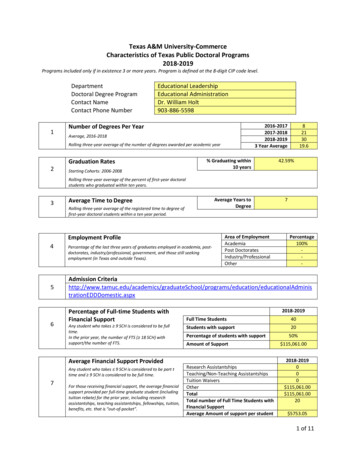
2018 BRINGING ADMINISTRATORS TOGETHER CONFERENCECreating Simple Visualizations Now that your data has been imported,creating your first visualization is as simple asdrag-and-drop. Columns from your data are divided byTableau into dimensions (year, category,school, etc.) and measures (price, sales,tuition amount, number of students, etc.) You can also create calculated fields based onyour existing columns.12
2018 BRINGING ADMINISTRATORS TOGETHER CONFERENCECreating Simple Visualizations13
2018 BRINGING ADMINISTRATORS TOGETHER CONFERENCECreating Simple Visualizations14
2018 BRINGING ADMINISTRATORS TOGETHER CONFERENCECreating Simple Visualizations15
2018 BRINGING ADMINISTRATORS TOGETHER CONFERENCECreating Simple Visualizations Tableau will automatically suggest charttypes based on the data types you havedragged into the view. Click one tochange your data table into the selectedgraph type.16
2018 BRINGING ADMINISTRATORS TOGETHER CONFERENCECreating Simple Visualizations You can also change the charttype via the marks card, aswell as change colors, size,shape, add text labels, or addtooltips.17
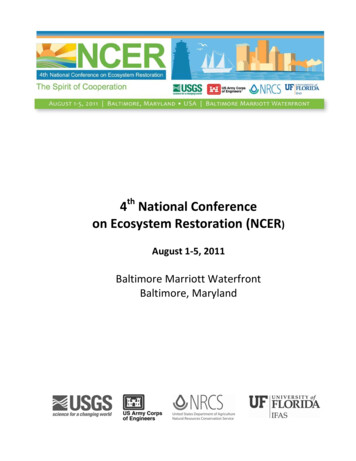
2018 BRINGING ADMINISTRATORS TOGETHER CONFERENCECreating Dashboards Dashboards can contain multiplevisualizations, plus text and images. Again, you can simply drag & drop each itemonto the dashboard.18
2018 BRINGING ADMINISTRATORS TOGETHER CONFERENCECreating Dashboards19
2018 BRINGING ADMINISTRATORS TOGETHER CONFERENCEPublishing Dashboards20
2018 BRINGING ADMINISTRATORS TOGETHER CONFERENCEPublishing Dashboards21
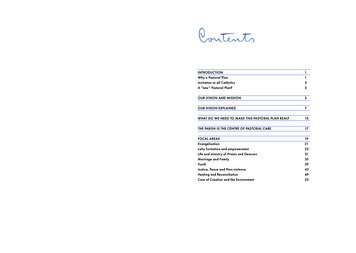
2018 BRINGING ADMINISTRATORS TOGETHER CONFERENCEExample Dashboards22
2018 BRINGING ADMINISTRATORS TOGETHER CONFERENCEExample Dashboards23
2018 BRINGING ADMINISTRATORS TOGETHER CONFERENCEExample Dashboards24
2018 BRINGING ADMINISTRATORS TOGETHER CONFERENCEExample Dashboards25
2018 BRINGING ADMINISTRATORS TOGETHER CONFERENCEExample Dashboards26
2018 BRINGING ADMINISTRATORS TOGETHER CONFERENCEExample Dashboards27
2018 BRINGING ADMINISTRATORS TOGETHER CONFERENCETableau Server - orts and data/Tableau Server service28
2018 BRINGING ADMINISTRATORS TOGETHER CONFERENCETableau Server - Environments Two servers– PRODUCTION tableau.admin.uillinois.edu– Make visualizations available to your clients or public– QA/TEST tableau-test.admin.uillinois.edu– Test your visualization in a server environment (sharing,embedding, etc.)29
2018 BRINGING ADMINISTRATORS TOGETHER CONFERENCETableau Server – Requesting aProject30
2018 BRINGING ADMINISTRATORS TOGETHER CONFERENCETableau Server – Requesting aProjectFields currently in the form. *requiredRequesting Unit's Campus:*Requesting Unit's Name:*Project Name:*Project Description:Publishers Active Directory Group(s):*Viewers Active Directory Group(s):Request non-default viewer permissionsAdditional notes:31
2018 BRINGING ADMINISTRATORS TOGETHER CONFERENCETableau Server – Security/AccessViewers can view workbooks/sheets in the projectPublishers can publish, edit and view workbooks/sheets in the project Accepts responsibility that any workbooks/sheets published to this project will notshare confidential and sensitive information with anyone, including colleagues, unlessthere is a business reason and they are an authorized viewer of the data.32
2018 BRINGING ADMINISTRATORS TOGETHER CONFERENCEMore Resources and ?q tableau33
2018 BRINGING ADMINISTRATORS TOGETHER CONFERENCEAccessibilityFor accessible dashboards, please pay attention to colors, alternatetext and make data available in an alternate form.34
2018 BRINGING ADMINISTRATORS TOGETHER CONFERENCEWorkshop Summary Tableau is an intuitive drag-and-drop datavisualization tool that can provide new andinnovative ways to explore and share yourfinancial, HR, alumni, student, or researchdata. We hope after this workshop you have aframework to quickly get started with Tableauand some ideas on how to visualize and shareyour data.35
2018 BRINGING ADMINISTRATORS TOGETHER CONFERENCEThank you Any Questions?36
How to Get Started with Tableau & Sample Dashboards April 5, 2018 1:45 PM -2:45 PM 2018 BRINGING ADMINISTRATORS TOGETHER CONFERENCE Conference Sponsors: The Office of the Chancellor, Budget & Financial Administration / Human Resources, the Office of the Provost and Vice Chancellor for Academic Affairs, the Office of the Vice Chancellor for Research, and the Office of