Transcription
Rolling Stock:Locomotives andRail CarsIndustry & TradeSummaryOffice of IndustriesPublication ITS-08March 2011Control No. 2011001
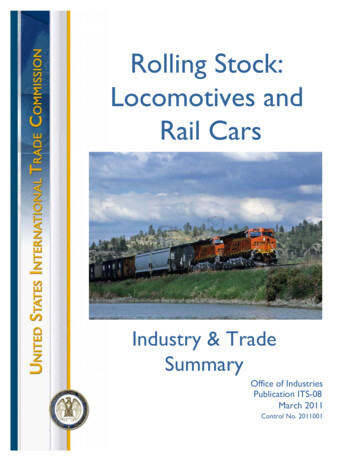
UNITED STATES INTERNATIONAL TRADE COMMISSIONKaren LaneyActing Director of OperationsMichael AndersonActing Director, Office of IndustriesThis report was principally prepared by:Peder Andersen, Office of Industriespeder.andersen@usitc.govWith supporting assistance from:Monica Reed, Office of IndustriesWanda Tolson, Office of IndustriesUnder the direction of:Deborah McNay, Acting ChiefAdvanced Technology and Machinery DivisionCover photo: Courtesy of BNSF Railway Co.Address all communication toSecretary to the CommissionUnited States International Trade CommissionWashington, DC 20436www.usitc.gov
PrefaceThe United States International Trade Commission (USITC) has initiated its currentIndustry and Trade Summary series of reports to provide information on the rapidlyevolving trade and competitive situation of the thousands of products imported into andexported from the United States. Over the past 20 years, U.S. international trade in goodsand services has risen by almost 350 percent, compared to an increase of 180 percent inthe U.S. gross domestic product (GDP), before falling sharply in late 2008 and 2009 dueto the economic downturn. During the same two decades, international supply chainshave become more global and competition has increased.Each Industry and Trade Summary addresses a different commodity or industry andcontains information on trends in consumption, production, and trade, as well as ananalysis of factors affecting industry trends and competitiveness in domestic and foreignmarkets. This report on the railway rolling stock industry primarily covers the periodfrom 2004 to 2009, and includes data for 2010 where available.Papers in this series reflect ongoing research by USITC international trade analysts. The work doesnot represent the views of the USITC or any of its individual Commissioners. This paper should becited as the work of the author only, not as an official Commission document.i
CONTENTSPagePreface .Acronyms .Key points .Introduction .U.S. industry .Trends .Industry structure .Locomotives .Freight rail cars .Passenger rail cars .Production process .Industry innovations .OEM supply chain .Employment.Geographic distribution of employers .U.S. market.Locomotives .Freight rail cars .Passenger rail cars .Factors influencing demand for railway rolling stock .Marketing methods .Consumers characteristics .Growth in demand for freight transportation .U.S. government regulatory issues .Competition between foreign and U.S. producers .U.S. trade .Overview .U.S. imports.U.S. exports .U.S. and foreign trade measures .U.S. tariff and nontariff measures.U.S. government trade-related investigations .Foreign tariff and nontariff measures .Foreign industry profiles.Canada .Mexico .China.Russia 53738404040414245464747
CONTENTS —ContinuedPageForeign market profiles.Canada .Mexico .China .Russia .4849525559Tariffs, nontariff measures and government programs .Bibliography .Appendices62ABCRailway rolling stock.Harmonized Tariff Schedules numbers .Locomotives and freight car data .758793Amtrak .2463Box1Figures123456789101112A typically configured diesel-electric locomotive .Common freight rail car varieties.Railway rolling stock production process .U.S. railway rolling stock industry: Total employment, average number of productionworkers, average yearly wages, 2002–09 .Locomotive purchases (new and rebuilt) by Class 1 railroads, total fleet as ofJanuary 1, 2001–10 .U.S. Class I railroads locomotive fleet: Locomotive build dates, percentage of fleet asof December 2009 .Orders, deliveries, and backlog for U.S. freight rail cars, 2000–09 .Ownership of U.S. freight rail cars in service, 2004–09 .Rolling stock: Age distribution and percentage of Amtrak rail car fleet, December 2009 .U.S. railway rolling stock shipments, imports, exports, and consumption, 2004–09 .Top five countries exporting diesel-electric locomotives, 2004–09 .Top six countries exporting freight rail cars, 2004–09 .5920232526272830374344Tables123456789U.S. locomotive manufacturers .Types of freight rail cars, goods typically transported, and number and share of theU.S. fleet, January 1, 2009 .Domestic operations of U.S. freight rail car manufacturers, 2010 .Commuter, light- and heavy-rail manufacturers and products used in the United States .Foreign subsidiaries of U.S. rail car manufacturers, 2010 .Composition of U.S. freight rail car fleet as of January 1, 2005–10 .Passenger car rail fleet, excluding Amtrak, 2004–08.U.S. Class I railroads: Operating revenues, locomotive and freight cars in service yearend 2009, and ton miles traveled, 2009 .Class I railroads: Freight traffic in the United States, 2004–09 .iv7816182228293233
.2A.3A.4A.5A.6A.7A.8A.9Class I railroads: Carloads transported, by commodity, 2004–09 .Railway rolling stock: U.S. exports of domestic merchandise, imports for consumption,and merchandise trade balance, 2004–10 .U.S. railway rolling stock imports: Top three products, 2004–10 .U.S. railway rolling stock exports: Top three products, 2004–10 .Railway rolling stock: MFN import duty rates, top three trading partners, 2010 .Global exports of diesel-electric locomotives, HS 8602.10, 2004B09 .Global exports of freight rail cars, 2004–09 .Railway rolling stock industry: A comparison of key metrics in selected foreignmarkets, 2009 .Class I railroads and VIA rail in Canada, 2009 .Locomotive fleet in Canada, 2004–09 .Freight and intercity rail car fleet in Canada, 2004–08 .Composition of active freight car fleet in Canada, 2004–07 .Tonnage carried by Canadian railroads, 2004–08 .Commodities transported in Canada, by weight, 2004–09 .Locomotive fleet in Mexico, 2004–09 .Freight traffic in Mexico, 2004–09 .Active rail car fleet in Mexico, 2004–09.Composition of active (owned and rented) freight rail car fleet in Mexico, 2004–09 .Carloads transported by commodity in Mexico, 2004–09 .Locomotive fleet in China, 2004–09 .Rail car fleet in China, 2004–09.Composition of China’s freight rail car fleet, 2004–09.Railway freight traffic in China, 2004–09 .Commodities transported by rail in China, by weight, 2004–09.Western companies in joint ventures with China’s railway rolling stock manufacturers .JSCo Russian railways locomotive fleet, 2004–09 .Composition of Russian freight rail car fleet, 2004–09 .Railway rolling stock: U.S. exports, imports for consumption, and merchandise tradebalance, by selected countries and country groups, 2004–09 .China’s top 15 railway rolling stock imports, 2000–09 .Value of China’s railway rolling stock imports: Top 15 countries, 2000–09 .China’s railway rolling stock exports: Top 15 commodities, 2000–09 .China’s railway rolling stock exports: Top 15 countries, 2000–09 .Russia’s railway rolling stock imports: Top 15 commodities, 2000–09 .Russian railway rolling stock imports: Top 15 countries, 2000–09 .Russia’s railway rolling stock exports: Top 15 commodities, 2000–09 .Russia’s railway rolling stock exports: Top 15 countries, 2000–09 586061777980818283848586
C.17C.18C.19C.20C.21C.22C.23Harmonized tariff schedule number, column 1 duty rate, special duty rate, U.S. exportsand imports, 2010 .Locomotive purchases, new and rebuilt, by U.S. Class 1 railroads, total fleet as ofJanuary 1, 2001–10 .Composition of U.S. freight rail car fleet, as of January 1, 2001–10 .Ownership of U.S. rail car fleet, as of January 1, 2001–10.Passenger car rail fleet, excluding Amtrak, 1999–2008.Global exports of HS 8602.10, diesel-electric locomotives,2000–09 .Global exports of freight cars, 2000–2009 .Railway rolling stock: Top three U.S. imports, 2000–10 .Top three U.S. exports of rolling stock, 2000–10 .Locomotive fleet in Canada, 2000–09 .Freight and intercity rail car fleet in Canada, 1999–2008 .Composition of active freight rail car fleet in Canada, mainline fleet, 2003–07 .Tonnage carried by Canadian railroads, 1999–2008 .Commodities transported in Canada, by weight, 2000–09 .Locomotive fleet in Mexico, 2000–09 .Freight traffic originating in Mexico, 2000–09 .Active rail car fleet in Mexico, 2000–2009.Composition of active (owned and rented) Mexico’s freight car fleet, 2000–09 .Carloads transported by commodity in Mexico, 2000–09 .Locomotive fleet owned by China national railways, by power source, 2000–09.Rail car fleet in China, 2000–09.Composition of freight rail fleet in China, 2000–09 .Railway freight tonnage transported in China, 2000–09.Commodities transported by rail in China, 2000–09 1112113114115116117
AcronymsDBADoing business as.DMUDiesel multiple unit: A diesel-powered rail car designed for operation in conjunction withother similar cars. Used where railway has not been electrified.EMUElectrical multiple unit: an electrically-powered rail car designed for operation inconjunction with other similar cars, powered from an external source of electricity.Examples include subway and Metro cars.EPAThe United States Environmental Protection AgencyFRAFederal Railroad Administration, U.S. Department of TransportationNESOInot elsewhere specified or indicatedOEMoriginal equipment manufacturerSASACState-owned Assets Supervision and Administration CommissionSTBSurface Transportation Board, U.S. Department of Transportationvii
Key PointsThis report addresses trade and industry conditions for railway rolling stock primarily forthe period 2004 through 2009, and includes data for 2010 where available. The railway rolling stock industry consists principally of manufacturers producinglocomotives, rail cars, electric multiple units, parts for these vehicles, and multimodalshipping containers. There are seven principal locomotive manufacturers and five major rail car (“car”)manufacturers in the United States. While the locomotive manufacturers focus onmarket niches, car manufacturers typically supply a range of cars. During 2004–09, the primary market for locomotives was freight railroads, while theprimary markets for cars were individual rail car lessors, shipping companies thatmoved their goods by rail, and freight railroads. The primary market for parts wereoriginal equipment manufacturers and enterprises that routinely rebuild railwayrolling stock. U.S. railroads moved 1.7 billion tons of freight over 169,082 miles of track in theUnited States during 2009. U.S. demand to move freight by rail increased during 2004–08, driving up thedemand for railway rolling stock. In particular, freight from Asia landing on the U.S.West Coast grew significantly, spurring the demand for both road and railtransportation. The U.S. locomotive fleet grew during the period, from 20,774 to 24,443 dieselelectric locomotives in service in 2009, while the freight car fleet remained relativelystatic at 1.4 million cars in service. In 2009, shipments of U.S. railway rolling stocktotaled 11.0 billion, with 8.9 billion (80.9 percent) sold to the domestic market.During this period, imports as a share of U.S. consumption declined, from19.1 percent to 12.4 percent. The top three nations supplying U.S. imports wereCanada, China, and Japan in 2009, while the top three markets for U.S. exports of allrailway rolling stock products were Canada, China, and Australia. The United States has had a trade surplus in railway rolling stock since 2004. Thesurplus peaked at 1.1 billion in 2008, an increase of 764 million (207.6 percent)over 2004, fell to 888 million in 2009, and then improved to 1 billion in 2010. U.S. producers of railway rolling stock compete in foreign markets principally on thebasis of technology. Asian and eastern European companies are increasinglyinterested in partnering with certain U.S. manufacturers. U.S. firms face competitiveobstacles in countries with state-run manufacturers. During 2004–08, global exports of diesel-electric locomotives more than doubled,before falling to pre-2001 levels in 2009. Principal exporting nations were the UnitedStates ( 403.8 million), Canada ( 182.1 million), Spain ( 133.4 million), Ukraine1
( 51.1 million), and China ( 42.4 million). 1 Of this group, only Spain’s exports grewin 2008–09. The United States was in the top five nations exporting rail cars during 2004–07. In2008, China, not a historically major supplier of rail cars, surged past the UnitedStates into the ranks of the top five exporting countries, as its rail car exports grew by196.5 percent (or by 176.8 million) over 2007. China maintained its lead over theUnited States in rail car exports in 2009. Current trends in the U.S. railway rolling stock industry include research into kineticenergy regeneration as well as development of freight cars capable of carrying largerloads and diesel-electric locomotives that produce fewer air pollutants.1Note: Schedule B does not differentiate between new and used locomotives.2
IntroductionThe U.S. railway rolling stock manufacturing industry is the principal equipment supplierto U.S. freight railroads. 2 It produces over-the-road and yard (switching) locomotives,freight and passenger rail cars, subway and metro cars, parts for these vehicles, andmultimodal shipping containers. This report focuses on freight locomotives and rail cars,two of the largest segments of the U.S. railway rolling stock industry, and brieflydiscusses commuter rail and metro cars. It analyzes railway rolling stock manufacturingduring 2004–09, including industry trends and demand factors, as well as trade patternsin both traditional and emerging foreign markets. The industry does not include railroads.This report does not discuss two significant industry components—multimodal shippingcontainer and parts manufacturers—in depth because of data limitations.The U.S. industry consists of three over-the-road locomotive producers, several yardlocomotive producers, five major rail car producers, and hundreds of parts suppliers. Ithas made significant investments in research and development (R&D) since 2000; as aresult, today’s new locomotives are more fuel-efficient and create fewer pollutants thanthose produced a decade ago.The industry is capital-intensive, with high financial barriers to entry. It is alsoconcentrated, with only a few major companies making rolling stock for each productniche, which limits market choices for their customers. 3 In 2009, shipments of U.S.railway rolling stock totaled 11.0 billion, with 8.9 billion (80.9 percent) sold to thedomestic market. 4The U.S. trade surplus in railway rolling stock goods grew each year, peaking at 1.1 billion in 2008 (an increase of 764 million, or 207.6 percent) before declining in2009 to 888 million (table A.1). In 2010, the U.S. trade surplus rebounded to 1.0 billion. In 2010, the largest total U.S. railway rolling stock trading partners (U.S.imports plus exports) were Canada, China, and Mexico. The United States had a 638 million trade surplus with Canada, a 62 million deficit with China, and a 204 million surplus with Mexico.This report analyzes railway rolling stock manufacturing and trade during 2004–09,including industry trends and demand factors, and trade patterns in both traditional andemerging foreign markets. It includes 2010 data where available.2AskOxford.com defines railway rolling stock as “locomotives, carriages, or other vehicles used on arailway.” As presented in this report, railway rolling stock data also cover railway or tramway track fixturesand fittings. Over-the-road locomotives are those used outside of switching yards for point-to-point service.Yard locomotives, also known as “switcher” or “shunter” locomotives, work primarily in rail yards, movingcars around to make up a train for over-the-road locomotives to deliver. The term “rail cars” refers to bothfreight and passenger rail cars. The corresponding NAICS code, 336510, captures railroad railway rollingstock manufacturing, while two more NAICS codes, 331511 and 331513, capture the casting of iron and steelwheel blanks, respectively. After wheels are cast, the blanks are forged—found under NAICS code 332111,iron and steel forging. Other NAICS numbers that pertain to this industry include 332312, for steel railroadcar racks manufacturing, as a part of fabricated structural metal manufacturing; 333613, for railroad carjournal bearings, plain, as a part of mechanical power transmission equipment manufacturing; and 336321,locomotive and railroad car light fixtures manufacturing, as a part of vehicular lighting equipmentmanufacturing.3DataMonitor, Road and Rail in the United States, December 2008, 13.4The figure for U.S. domestic market sales value is estimated by subtracting exports from shipments.3
U.S. IndustryTrendsIndustry trends during the report period were driven both by market demand for greaterefficiency and by the U.S. government’s new emission standards for new locomotiveengines. 5 Shipping companies sought to reduce their shipping costs, and carmanufacturers responded with improved designs with larger capacities, allowing moregoods to be transported per car. By the end of the period, new freight rail cars transportedmore tonnage per carload than those offered a decade earlier. 6 This increased capacityallowed owners to ship more weight or volume per carload than before, lowering costsper ton of freight transported. It also may be one reason railroad companies purchasedhigher-horsepower locomotives than those used previously.U.S. railroads continued to find it less beneficial to own rail cars than provide the serviceof moving them; hence, their share of car ownership continued to decline. U.S. railroadsowned less than one-half of all freight rail cars in the United States during the period,with shippers and leasing companies owning the majority. In 2009, U.S. railroads owned69,529 (11.3 percent) fewer cars than in 2004. 7 At the same time, freight rail carownership by suppliers and shippers increased from 634,500 to 839,020 (a 32.2 percentincrease). Railroads typically will charge a shipper lower fees if the shipper provides itsown freight cars, which has been an incentive for shipping companies to purchase railcars. 8Locomotive manufacturers are continuing to invest in cleaner, more efficient ways togenerate energy. One avenue being developed is kinetic energy recovery systems, atechnology that collects the energy created when a locomotive applies its brakes whilepushing or pulling rail cars and stores it for motive use when the engineer demands it.This system will allow locomotives to transport more weight through mountainousregions without requiring significant increases in engine horsepower.In addition to more horsepower, new locomotive engines produce less pollution, theresult of re-engineering several key systems. 9 New air-to-air heat exchangers reduceengine oil operating temperatures, which lowers emissions. Air-cooled inverters nolonger need chemical coolants, eliminating a potential source of toxic spills, andadvances in fuel injection technologies meter fuel more precisely to lower consumption5Locomotive engines are subject to the Environmental Protection Agency (EPA) schedule for exhaustemissions reduction. Tier 3 standards were phased in during 2009, while the more restrictive Tier 4 standardswill be phased in during 2015. EPA, “New Clean Diesel Rule Major Step,” May 11, 2004, and, “EPAFinalizes More Stringent Emission Standards,” March 2008.6AAR, Railroad Fact Book 2010, 53.7Ibid., 51.8Industry official, interview by USITC staff, March 2010.9EPA, “New Clean Diesel Rule Major Step,” and “EPA Finalizes More Stringent Emission Standards.”The move to newly designed engines was driven in large part by the EPA’s issuance of standards found in theClean Air Nonroad Diesel Rule for the sulphur content in diesel fuel in 2004 and air pollutant standards in2008. The EPA mandated a stepped approach to the reduction of air pollutants, culminating in its Tier 4regulations, which are pr
Rolling Stock: Locomotives and Rail Cars - USITC . Trends . 4
