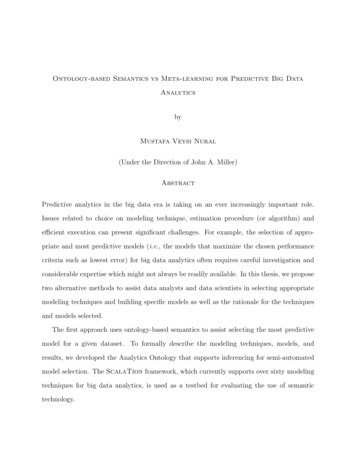
Transcription
Predictive Analytics for Big Datawith Native Spark ModelingPriti Mulchandani, Andreas ForsterSeptember 2016
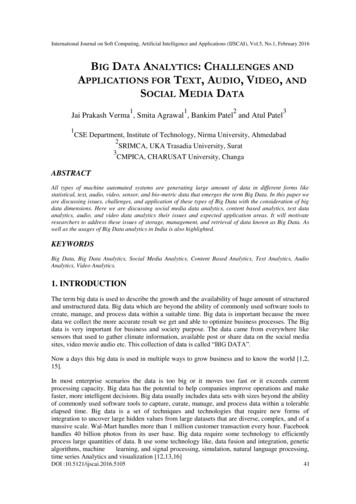
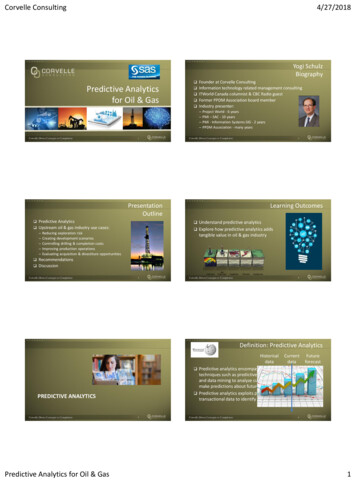
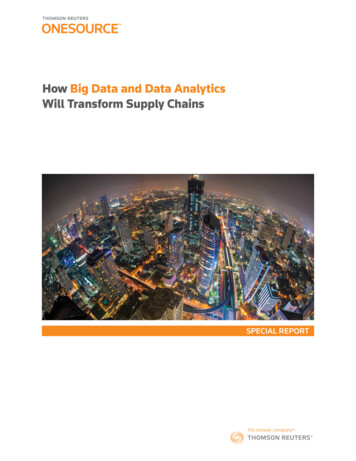
Trends in Data Science111MassiveAmount of DataConversationsAnalyticalSkill GapEver FasterDecision Cycle“Demand for deepanalytical talent in the UScould be 50 to 60%greater than its projectedsupply by 2018”McKinsey Global InstituteTransactionsMachines 2016 SAP SE or an SAP affiliate company. All rights reserved.Gartner2
So how does Automated Analytics help?You are a Data Scientist Automate the recurringtasks and save time Get inspiration on whichdirection to investigatemanually Help structure your datasets for manual approach Deploy models intoproduction with ease Have additionalfunctionality in yourportfolio to tackle day today challengesSupport Productivity 2016 SAP SE or an SAP affiliate company. All rights reserved.You are an AnalystYou are a Company Get access to the world ofPredictive Analytics /Machine Learning Deliver new benefits byproviding PredictiveModels in addition toBusiness Intelligence Build on existing analyticalskillset Find a new carreer path Benefit from PredictiveInsight where needed inbusiness processes Scale the use of predictivemodels without manualbottlenecks Accelerate your path to adigital businessEnable UsersScale3
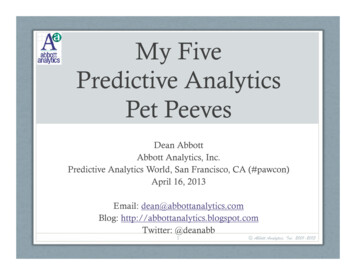
But I am a Data Scientist, and I am efficient «by hand»A logistic regression only takes a few lines of code in MLlib.Split dataTrain one modelApply the model on new dataEvaluate model qualitySource: ethods.html 2016 SAP SE or an SAP affiliate company. All rights reserved.4
However, most projects are more complexThe Cross Industry Standard Process for Data Mining taPreparationThe previous code onlycreates 1 model. Theremaining aspects arenot addressed yet.DeploymentDataModelingEvaluationSource: https://en.wikipedia.org/wiki/Cross Industry Standard Process for Data Mining 2016 SAP SE or an SAP affiliate company. All rights reserved.5
Automated Predictive AnalyticsThe Cross Industry Standard Process for Data Mining (CRISP-DM) Mass-produce suchbest-performing modelsBusinessUnderstandingDataUnderstanding Monitor these models ontheir predictive quality Retrain if needed Calculate new scoresand write back or intobusiness applicationsDataPreparationExplorative / Agile BI frontend Derive new variables in graphicalinterface that describe the subject Handle missing values and outliers Create robust groupsDeploymentDataEvaluationModelingCalculate many different models Evaluate models on unseen data andselect the best-performing Interpret model and discuss insight withthe business departmentSource: https://en.wikipedia.org/wiki/Cross Industry Standard Process for Data Mining 2016 SAP SE or an SAP affiliate company. All rights reserved.6
Automated AnalyticsHow? 2016 SAP SE or an SAP affiliate company. All rights reserved.7
The Principles The technology used in the Automated Mode of SAP Predictive Analytics is an implementation of the theory ofstatistical learning from Vladimir Vapnik. SAP obtained this technology with the acquisition of a company calledKXEN in 2013. Some principles are key: No hypothesis whatsoever, no testing of them No required distribution of the predictors Ability to handle large number of predictors No assumption on relationships between predictors The user has control of the processThe process is 2 steps: Preparation of the data for further processing / encoding AlgorithmicsIt relies on Structured Risk Minimization (SRM) which is implemented in the encoding but also in all steps ofmodel building. The algorithmics is Ridge Regression. 2016 SAP SE or an SAP affiliate company. All rights reserved.8
Automated Predictive AnalyticsThe Cross Industry Standard Process for Data Mining (CRISP-DM) Mass-produce suchbest-performing modelsBusinessUnderstandingDataUnderstanding Monitor these models ontheir predictive quality Retrain if needed Calculate new scoresand write back or intobusiness applicationsDataPreparationExplorative / Agile BI frontend Derive new variables in graphicalinterface that describe the subject Handle missing values and outliers Create robust groupsDeploymentDataEvaluationModelingCalculate many different models Evaluate models on unseen data andselect the best-performing Interpret model and discuss insight withthe business departmentSource: https://en.wikipedia.org/wiki/Cross Industry Standard Process for Data Mining 2016 SAP SE or an SAP affiliate company. All rights reserved.9
Data PreparationTurning raw data into wide descriptive datasetsCreating a semantic layer. The structure does not have to be persistet.TablesJoinsAggregatesWith understanding of time 2016 SAP SE or an SAP affiliate company. All rights reserved.10
Data PreparationTurning raw data into wide descriptive datasetsCreating a semantic layer. The structure does not have to be persistet.Tables Name Maximum Account Balance -1 Quarter Age Maximum Account Balance -2 Quarters Martial status Maximum Account Balance -3 Quarters Account Balance today Differences in Max Account Balance in Euro Average Account Balance -1 Quarter Differences in Max Account Balance in % Average Account Balance -2 Quarters Maximum Account Balance -1 Year Average Account Balance -3 Quarters Maximum Account Balance -2 Years Differences in Avg Account Balance in Euro Maximum Account Balance -3 Years Differences in Avg Account Balance in % Differences in Max Account Balance in Euro Average Account Balance -1 Year Differences in Max Account Balance in % Average Account Balance -2 Years Average Account Balance -3 Years Differences in Avg Account Balance in Euro and thousands of further columns Differences in Avg Account Balance in %Wide descriptive datasets 2016 SAP SE or an SAP affiliate company. All rights reserved.11
Big Data is not just bigWide, or deep, or both 2016 SAP SE or an SAP affiliate company. All rights reserved.12
Why Big Data for Predictive?Lift with Simple Aggregates20 Variables Demographics / Account Information Simple Aggregates (e.g. Account Balance, Total Usage) 2016 SAP SE or an SAP affiliate company. All rights reserved.13
Why Big Data for Predictive?Lift with Complex Aggregates100 Variables Pivoting Transactions (e.g. Calls by Type) Time-Sensitive Aggregates (e.g. Calls by Week) 2016 SAP SE or an SAP affiliate company. All rights reserved.14
Why Big Data for Predictive?Lift with Social Network Analysis200 Variables Social Network Analysis (e.g. Calls in First Circle) Community Detection (e.g. Community Churn Rate) 2016 SAP SE or an SAP affiliate company. All rights reserved.15
Data PreparationEncoding the columns, Nominal and Ordinal columnsExample: Let’s consider a Variable V1 with 4 categories A, B, C and D and some missing values.Category / LevelPercent of targetvariable inEstimationPercent of targetvariable inValidationAssigned valuein .1DE0.350.15KxOtherNULL0.20.2KxMissingCategories with low frequency (outliers) are put together in a noise category called KxOther. It contains as wellcategories that are not robust i.e. that don’t have the same target rate between Estimation and Validation (testedwith a Chi Square Test of Independence). 2016 SAP SE or an SAP affiliate company. All rights reserved.16
Data PreparationBinning to obtain robust groups Grouping can help to increase robustness. Categories are grouped depending on the target encoding.Category / LevelPercent of targetvariable in EstimationPercent of targetvariable in ValidationAssigned value inencoded rNULL0.20.2KxMissingB;KxMissingFrom the encoding we can expect that A and D could be regrouped as well as B and NULL (as they have similar .This is done iteratively: by calculating KI KR for the non-regrouped categories and the regrouped ones If KI KR doesn’t decrease (with a tolerance), the group is kept Further grouping is tried to the point where KI KR decreases 2016 SAP SE or an SAP affiliate company. All rights reserved.17
Automated Predictive AnalyticsThe Cross Industry Standard Process for Data Mining (CRISP-DM) Mass-produce suchbest-performing modelsBusinessUnderstandingDataUnderstanding Monitor these models ontheir predictive quality Retrain if needed Calculate new scoresand write back or intobusiness applicationsDataPreparationExplorative / Agile BI frontend Derive new variables in graphicalinterface that describe the subject Handle missing values and outliers Create robust groupsDeploymentDataEvaluationModelingCalculate many different models Evaluate models on unseen data andselect the best-performing Interpret model and discuss insight withthe business departmentSource: https://en.wikipedia.org/wiki/Cross Industry Standard Process for Data Mining 2016 SAP SE or an SAP affiliate company. All rights reserved.18
ModelingRidge RegressionThe Ridge Regression penalizes the size of the coefficients by minimizing this extended term:𝑝: number of parameters𝜆: Ridge ParameterThe coefficients that minimize that error are estimated with:Source: 4-F11/notes/9-1.pdf 2016 SAP SE or an SAP affiliate company. All rights reserved.20
ModelingSelecting the best model By playing with 𝜆, more or less constraint is applied on the coefficients of the regression. If a lot of constraint is applied, the Training error (𝜀𝑡 ) is high but the Generalization error (𝜀𝑔 ) is low Inversely, if little constraint is applied, the Training error (𝜀𝑡 ) is low but the Generalization (𝜀𝑔 ) is is highBestModelErrorTrainingErrorSimple Models 2016 SAP SE or an SAP affiliate company. All rights reserved.Total ErrorModels are “Overtrained” or “Over fitted”GeneralisationErrorModel ComplexityComplex Models22
Automated Predictive AnalyticsThe Cross Industry Standard Process for Data Mining (CRISP-DM) Mass-produce suchbest-performing modelsBusinessUnderstandingDataUnderstanding Monitor these models ontheir predictive quality Retrain if needed Calculate new scoresand write back or intobusiness applicationsDataPreparationExplorative / Agile BI frontend Derive new variables in graphicalinterface that describe the subject Handle missing values and outliers Create robust groupsDeploymentDataEvaluationModelingCalculate many different models Evaluate models on unseen data andselect the best-performing Interpret model and discuss insight withthe business departmentSource: https://en.wikipedia.org/wiki/Cross Industry Standard Process for Data Mining 2016 SAP SE or an SAP affiliate company. All rights reserved.23
Closed LoopAutomtically Retrain and Apply Models Maintain large number of models Automatically retrain modelswhen needed Automatically apply models andpersist scores to source systemsor business applications 2016 SAP SE or an SAP affiliate company. All rights reserved.24
Automated Predictive AnalyticsThe Cross Industry Standard Process for Data Mining (CRISP-DM) Mass-produce suchbest-performing modelsBusinessUnderstandingDataUnderstanding Monitor these models ontheir predictive quality Retrain if needed Calculate new scoresand write back or intobusiness applicationsDataPreparationExplorative / Agile BI frontend Derive new variables in graphicalinterface that describe the subject Handle missing values and outliers Create robust groupsDeploymentDataEvaluationModelingCalculate many different models Evaluate models on unseen data andselect the best-performing Interpret model and discuss insight withthe business departmentSource: https://en.wikipedia.org/wiki/Cross Industry Standard Process for Data Mining 2016 SAP SE or an SAP affiliate company. All rights reserved.25
Big Data in HadoopFeaturesMapReduceNo SQL /SQL SparkHive HDFS 2016 SAP SE or an SAP affiliate company. All rights reserved.CustomerCommodity Hardware ( 1500/ TB)Open Source Stack ( No Licensing fee)Elastic scalingscales linearly with # of nodesEasy to add 1000s of (cheap) nodesCode executes close to the data26
Hadoop Perspective for 2016Big dataworkloads inproductionjumped by nearly30% from 2014to 2015Adoption interestfor Spark has55% userstopped inwant to leverageHadoop forBusiness usersand Advanceduse casesHadoop eco-system2016‘s #1 trend:Apache Sparkwill move fromtalking point intodeploymentSource: http://www.syncsort.com/ 2016 SAP SE or an SAP affiliate company. All rights reserved.Customer27
Modeling for Big DataTraditional Tiered Architecture vs. Native Spark Modeling Full dataset brought to application for processing Data processing beside data Limited Performance, Scalability Performance and scalability built-inLimited Data Processing on asingle server1000s of Nodes designed for costeffective Data ProcessingSAP PredictiveAnalytics - AutomatedPredictive AnalyticsAutomated toolsNo Data TransferJSONStatsNative Spark ModelingFULL Data TransferSQL 2016 SAP SE or an SAP affiliate company. All rights reserved.Database28
Native Spark Modeling - Architecture 2016 SAP SE or an SAP affiliate company. All rights reserved.29
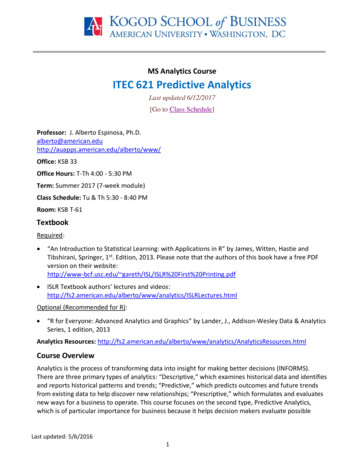
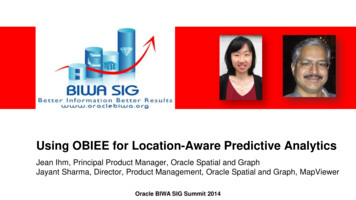
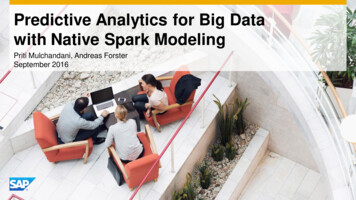
Performance and ScalabilityWith and Without Native Spark ModelingSummaryResponse time in mins1,80014 times faster for 15K vardataset 10 times faster for 2K vardataset 1,5811,6001,4001,2001,000850800 Native Spark Modelling performance isbetter with bigger and wider datasets Scalability quadratic O(n2) of matrixoperations60040017520018021251634Bank ADS 150 X 1.5 Continuous 2K X 500K Cateogrial 1200 Xmil500KSAP PA without Native Spark 2016 SAP SE or an SAP affiliate company. All rights reserved.11224Orange 15K X 50KOrange 15K X 500KSAP PA with Native SparkCustomer30
SummaryMore about Automated Analytics and Big Data Tutorials and blog Trial version download 2016 SAP SE or an SAP affiliate company. All rights reserved.31
Thank youContact information:Priti MulchandaniProduct Manager for Big Data Analyticsp.mulchandani@sap.com d.Andreas ForsterGlobal Center of Excellenceandreas.forster@sap.com6
Modeling Evaluation Deployment Data Mass-produce such best-performing models Monitor these models on their predictive quality Retrain if needed Calculate new scores and write back or into business applications Explorative / Agile BI frontend Derive new variables in graphical interface that describe the subject