Transcription
My FivePredictive AnalyticsPet PeevesDean AbbottAbbott Analytics, Inc.Predictive Analytics World, San Francisco, CA (#pawcon)April 16, 2013Email: dean@abbottanalytics.comBlog: http://abbottanalytics.blogspot.comTwitter: @deanabb1 Abbott Analytics, Inc. 2001-2013
Topics Why Pet Peeves? A call for humility for Predictive Modelers The Five Pet Peeves1.2.3.4.5.Machine Learning Skills Domain ExpertiseJust Build the Most Accurate Model!Significance? What do you mean by Significance?My Algorithm is better than Your AlgorithmMy classifier calls everything 0 time to resample!2 Abbott Analytics, Inc. 2001-2013
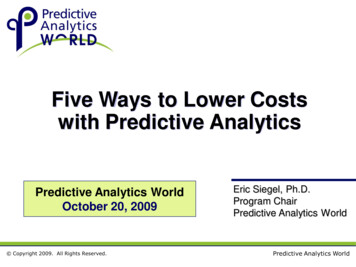
Peeve 1Which is Better: Machine LearningExpertise or Domain Expertise? Question: who is more important in the process ofbuilding predictive models: The Data Scientist / Predictive Modeler / Data Miner The Domain Expert / Business Stakeholder?Photo fromhttp://despair.com/superioritee.html3 Abbott Analytics, Inc. 2001-2013
Which is Better:2012 Strata Conference Debate?From Strata e-learning-expertise-googleanalytics.html“I thinkcomm you can geton sense, ma pretty far wbasic iithybnabout formation y e Google-in someaou neeg thed to kintuiti domain, annod a loton”of stat wistical4 Abbott Analytics, Inc. 2001-2013
Formula for Success?5 Abbott Analytics, Inc. 2001-2013
Conclusion:Frame the Problem First Mark Driscoll: Moderator of Strata Debate “could you currently prepare your data for a Kagglecompetition? If so, then hire a machine learner. If not,hire a data scientist who has the domain expertise andthe data hacking skills to get you there.” science-debate-domain-expertise-or-machine But even this may not work, which brings me to thesecond pet peeve 6 Abbott Analytics, Inc. 2001-2013
Peeve 2Just Build Accurate Models The Problems with Model Accuracy:1. There’s More to Success than “Accuracy”2. Which Accuracy?7 Abbott Analytics, Inc. 2001-2013
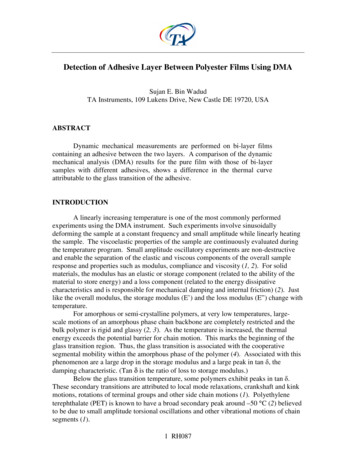
The Winner is Best Accuracyhttp://www.netflixprize.com/leaderboard8 Abbott Analytics, Inc. 2001-2013
Why Model Accuracy is Not Enough:Netflix ecommendations-beyond-5-stars.html9 Abbott Analytics, Inc. 2001-2013
Why Data Science is Not Enough:Netflix ecommendations-beyond-5-stars.htmlThere’s more to a solution than accuracy—you have to be able to use it!10 Abbott Analytics, Inc. 2001-2013
Peeve 3The Best Model Wins We select the “winning model”, but is there a significantdifference in model performance?12 Abbott Analytics, Inc. 2001-2013
KDD Cup 98 ResultsCalculator fromhttp://www.answersresearch.com/means.php13 Abbott Analytics, Inc. 2001-2013
Example: Statistical Significance withoutPractical SignificanceMeasureNumber MailedResponse Rateoutside margin of error?i.e., statisticall significant?expected respondersactual respondersdifferenceControlCampaign(based on model)5,000,0001%50,00050,0000Revenue Per ResponderTotal Revenue ExpectedTotal Revenue ActualDifference Revenue4,000,0001.011%yesyes40,00040,440440 100 4,000,000 4,044,000 44,000Significance basedon z 2 (95.45%confidence) Cost per contact: negligible (email) Cost for analysts to build model: 80,00014 Abbott Analytics, Inc. 2001-2013
Peeve 4My Algorithm is Better than Your AlgorithmFrom 2011RexerAnalyticsData er-SurveyResults-2011.html15 Abbott Analytics, Inc. 2001-2013
Every Algorithm Has its DayElder, IV, J. F., and Lee, S. S. (1997), “Bundling Heterogeneous Classi ers withAdvisor Perceptrons,” Technical Report, University of Idaho, October, 14.16 Abbott Analytics, Inc. 2001-2013
PAKDD Cup 2007 Results:Look at all them Algorithms! 18 Different Algorithms Used in Top 20 Solutions;AUCROC)Modeling)Par6cipant)Par6cipant) (TrapezoiModeling)Technique)/ )Implementa6on)/ ) Affilia6on)Loca6on))Affilia6on)Type) dal)Rule))TreeNet& &Logis-c&Regression&Salford&Systems& Mainland&China&Prac--oner& 70.01%&Probit&Regression&SAS&USA&Prac--oner& 69.99%&MLP& &nHTuple&Classifier&Brazil&Prac--oner& 69.62%&TreeNet&Salford&Systems&USA&Prac--oner& 69.61%&TreeNet&Salford&Systems& Mainland&China&Prac--oner& 69.42%&Ridge&Regression&Rank&Belgium&Prac--oner& 69.28%&2HLayer&Linear&Regression&USA&Prac--oner& 69.14%&Log&Regr &Decision&Stump& &AdaBoost& & r& 68.58%&Decision&Tree& &Neural&Network& Addi-ve&Model&Xeno&USA&Prac--oner& ression&Tree& &RankBoost& -c&Regression&SAS& &Salford&India&Prac--oner& 67.58%&J48& al&Network& &General&Addi-ve&Model&Tiberius&USA&Prac--oner& 67.54%&Decision&Tree& ision&Tree& &Neural&Network& p)Decile)(Trapezoidal)Top)Decile) Response)Rule))Rank)) Response)Rat) htm17 Abbott Analytics, Inc. 2001-2013
Peeve 5You Must Stratify Datato Balance the Target Class For example, 93% non-responders (N), 7% responders (R) What’s the Problem? (The justification for resampling) “Sample is biased toward responders” “Models will learn non-responders better” “Most algorithms will generate models that say ‘calleverything a non-responder’ and get 93% correctclassification!” (I used to say this too) Most common solution: Stratify the sample to get 50%/50% (some will argue that oneonly needs 20-30% responders)18 Abbott Analytics, Inc. 2001-2013
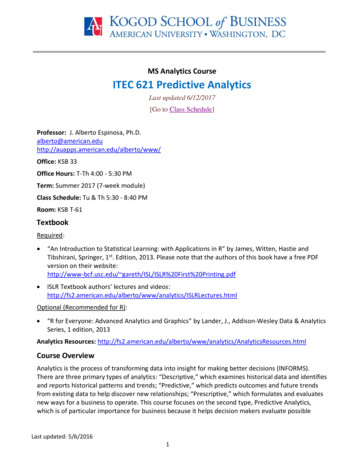
Neural Network Results onSame DataDistribution of TargetNOTE: all models built using JMP 10,SAS Institute, Inc.19 Abbott Analytics, Inc. 2001-2013
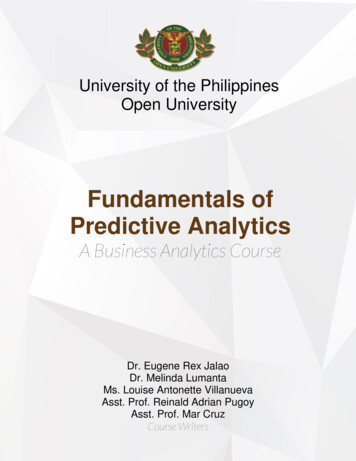
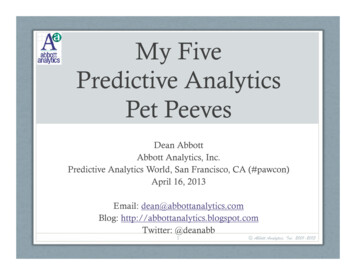
Sample Decision Tree Built onImbalanced PopulationDistribution of TargetBut .ROC Curve Looks like this1.000.900.800.70All RowsAVG DON 12.6AVG DON 12.6CountG 2 LogWorth2462 1906.1388 16.436964REC DON AMT 22REC DON AMT 22CountG 2 LogWorth1110 1073.8838 1.0384958RFA 2(L3F, L2F, L3G)CountG 291 115.37798CountG 2 LogWorth1352 772.40299 1.5219174RFA 2(L4G, L2G, L1F, L1G, L1E, L2E,L4F)Count1019G 2 LogWorth947.1647 0.7753319MAX DON DT 9110CountG 232 41.183459Count2926MAX DON DT 9110CountG 2987 900.58503CARDPM12 8CARDPM12 8CountG 226 30.289597CountG 21326 734.00892G 2623.4558LogWorth14.98445REC DON AMT 15REC DON AMT 15CountG 2 LogWorth1256 463.93369 5.3217072MAX DON AMT 21CountG 2155 122.97078MAX DON AMT 21CountG 21101 317.08262CountG 21670 101.41981LogWorth1.739958MAX DON AMT 20CountG 2 LogWorth132 35.849605 1.6609832CARDGIFT LIFE 4CountG 215 15.012073MAX DON AMT 20SensitivityCountG 2 LogWorth5388 2778.7248 114.847910.600.500.40CountG 21538 55.6051380.30CARDGIFT LIFE 4CountG 2117 11.5157760.20Predictions of Target ityWhy do we get a ROC Curve that looks OK, but theconfusion matrix says “everything is N (No)”?20 Abbott Analytics, Inc. 2001-2013
So What Happened? Note: no algorithm predicts decisions (N or R): theyall produce probabilities/likelihoods/confidences Every data mining tool creates decisions (and byextension, forms confusion matrices) by thresholdingthe predicted probability by 0.5 (i.e., assuming equallikelihoods is the baseline) When the imbalance is large, algorithms will notproduce probs/likelihoods 0.5 a score this largeis far too unlikely for an algorithm to be “that sure”21 Abbott Analytics, Inc. 2001-2013
What the Predictions Looks Like22 Abbott Analytics, Inc. 2001-2013
Confusion Matrices For theDecision Tree: Before and AfterDecision Tree:Threshold at 0.5Decision Tree:Threshold at ,798& 2,204& 5,002&R&45&341&386&Total&2,843& 2,545& 5,388&24 Abbott Analytics, Inc. 2001-2013
Conclusions The Rant is Done! The Five Pet Peeves1.Machine Learning Skills Domain Expertise Be humble; we need both data science and domain experts!2.Just Build the Most Accurate Model! Select the model that addresses your metric3.Significance? What do you mean by Significance? Don’t get hung up on “best” when many models will do well Learn from difference in patterns found by these models4.My Algorithm is better than Your Algorithm Don’t stress about the algorithm; learn to use a few very well5.My classifier calls everything 0 time to resample! Don’t throw away 0s needlessly; only do it when there are enough of themthat you won’t miss them.25 Abbott Analytics, Inc. 2001-2013
Predictive Analytics Pet Peeves Dean Abbott Abbott Analytics, Inc. Predictive Analytics World, San Francisco, CA (#pawcon) . The Data Scientist / Predictive Modeler / Data Miner The Domain Expert / Business Stakeholder? . TreeNet& &Logis-c&Regression& Salford&Systems& Mainland&China& Prac--oner& 70.01%& 1& 13.00%& 7&