Transcription
How Big Data and Data AnalyticsWill Transform Supply ChainsSPECIAL REPORT
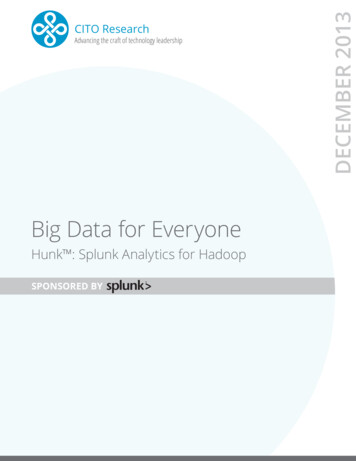
HOW BIG DATA AND DATA ANALYTICS WILL TRANSFORM SUPPLY CHAINS 2While many of us have heard the terms “big data” and “data analytics”, it’s often unclear whatthese trends are all about and how they can benefit global trade compliance professionals.By definition, data analytics are the qualitative and quantitative techniques used to enhanceproductivity and business gains while big data refers to voluminous amounts of structured orunstructured data that organizations can potentially mine and analyze for business gains.If you’re still scratching your head, consider these real-world examples. Your cell phone receivesa text message indicating that import declarations for critical parts required in your Chinafactory missed today’s deadline for filing with your customs broker. The manager of logisticsreceives an alert that port traffic in Los Angeles may delay the receipt of critical raw materialsby 48 hours, prompting your logistics software to ask you to approve diverting the cargo to LongBeach. The director of trade compliance is notified that there is a 90% chance that a criticalshipment of parts to Sao Paolo may be subject to inspection by Brazilian Customs, delayingreceipt of the parts at your factory by up to two days. Your GTM software recommends shippingthe parts to another port to speed up the entry.What do all three of these scenarios have in common? They each harness the power of applyingdata analytics and big data to improve operational efficiency.As corporations continue to face pressure to increase profit margins and shorten order todelivery cycles, the application of these technologies within multinational organizations iscontinuing to grow. A recent Gartner, Inc. study projected 2017 sales of 18.3 billion in thebusiness intelligence and analytics market1, while sales of prescriptive analytics software isestimated to grow from approximately 415M in 2014 to 1.1B in 20192.So, let’s take a more in-depth look at these technologies and how global trade software canhelp you capitalize on the opportunities they offer.Understanding Big Data and Data AnalyticsBig data is defined by the three Vs:volume, velocity, and variety. Thefirst, volume, relates to the sheermagnitude of data currently availablefor analysis. While we normally thinkof data as text or numbers, data alsoincludes email, tweets, other contentgenerated by social media, images,audio, scans, etc. In fact, data isexpanding at a rate that doubles everytwo years while human and machinegenerated data is growing at 10 timesthe rate of traditional business data.IT World Canada projected that by2020, the sheer volume of the world’sdigital data would fill a stack of iPadAir tablets that would extend from theearth to the moon.3Vs of Big DataVolumeTerabytesRecordsTransactionsTables, FilesVelocityBatchNear TimeReal TimeStreams3Vs ofBig DataStructuredUnstructuredSemi-StructuredAll of the AboveVarietyThe second “V”, velocity, refers to the frequency of change in data. Think of how data velocityhas accelerated in the past 5-10 years driven by the expansion of the Internet and social media.Real-time data is projected to grow ten-fold by 2025. A cousin of real-time data is near-timedata transmissions which include a time delay between the occurrence of an event and thepublication of that data. If you have ever accessed a website which provides stock pricespublished on a 5-minute delay, you have accessed near-time data.Streaming is a term that probably most of us never heard before the advent of consumerservices such as Spotify or Netflix and the widespread adoption of WebEx in the business realm.Driven by the availability of cloud-based solutions, the growth of streaming services will onlyaccelerate as younger generations embrace the technology to access movies, music, videos,
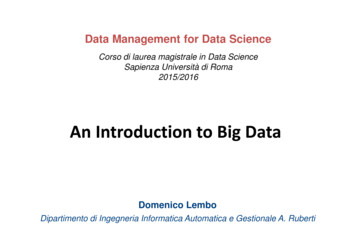
HOW BIG DATA AND DATA ANALYTICS WILL TRANSFORM SUPPLY CHAINS 3and television. A study recently found that 61% of young adults ages 18 – 29 primarily watch TV viastreaming services.The final “V”, variety, can be further defined as structured, semi-structured, or unstructured data.Structured data is data that has been organized into a formatted repository — typically, a database— so that its elements are accessible for processing and analysis (think of Excel spreadsheets).For an understanding of semi-structured data, think of CSV (comma separated value) files. Theyaren’t parts of relational databases, but they are organized in a format that can be easily loadedinto an analytical tool such as Excel for analysis.As the name implies, unstructured data is not contained in a database or some other type of datastructure. It may consist of text, numbers, dates, video, images, etc. Examples of unstructureddata include: Writing — textual analysis of written works such as books and blogsSocial Media — blog posts, tweetsNatural Language — voicePhotographs and VideoCommunications — emailsScanning communications — such as emails to detect spamScience — looking for patterns in interstellar radio messages in order to discover intelligent lifeHealth — x-ray images, scansAnalysis — of x-ray images for signs of diseaseSearch — a search engine that spiders unstructured web pages in order to understand their contentAn estimated 90% of all data is either semi-structured or unstructured. This includes videos,PowerPoint presentations, company records, social media, RSS, documents, and text. However,many organizations are not utilizing this data despite the valuable insights that this data couldyield. The reason for this is simple: the tools needed to analyze such a large scale of data have notexisted. However, advancements in machine learning and data visualization tools are now makinganalysis of semi-structured and unstructured data possible.To better understand how, let’s turn our attention to the five broad categories of analytics:descriptive, diagnostic, predictive, prescriptive, and cognitive or artificial intelligence (AI).The simplest method is descriptive analytics, which shows what is happening with data. A goodexample of descriptive analytics is the information you would capture and display in an Excelspreadsheet which shows historical information, like broker fees.Diagnostic analyticsTypes of Analyticsgoes a step further byDataAnalyticsproviding insight intoDESCRIPTIVEWhat Happened?potential problems oropportunities as evidencedDIAGNOSTICWhy did it happen?by the data. For example,PREDICTIVEyour analytical tool mightWhat will happen?identify a duty savingsopportunity and thePRESCRIPTIVEprojected annual savingsWhat should I do?that could accrue fromadopting this change.COGNITIVE/ARTIFICIAL INTELLIGENCEHuman JudgmentDecisionActionDECISION SUPPORTDECISION AUTOMATIONWhat are new insights orWhen your analysisDECISION SUPPORTrecommended actions based onnatural language and self learning?provides a prediction ofDECISION AUTOMATIONthe future (e.g., here’sthe data, here’s what itmeans, and here’s a look at the future based on the past), you are applying predictive analysis tothe situation. A predictive model will not only identify duty savings but will also forecast your futureduty payments based on projected sales volumes.
HOW BIG DATA AND DATA ANALYTICS WILL TRANSFORM SUPPLY CHAINS 4According to data analytics experts, the three biggest benefits for using big data within supplychains are traceability, relationship management (e.g., better customer service), and forecasting/predictability. The benefits of traceability are fairly obvious. Knowing where your goods are locatedat any point of the supply chain, being able to predict or be notified of supply chain disruptionsand having contingency plans to address these issues have an enormous impact on profitability,resource planning, and customer satisfaction.A recent article from the Journal of Commerce indicated that shippers, forwarders, and carriers arelooking at artificial intelligence to gather and analyze data to address “issues such as how to pickthe best alternative port when the original destination is blocked, better estimating the arrival timeof a ship so that logistical resources can be ready. AI is also being tapped to forecast whether ashipper will cancel a booking or its container will get rolled by the carrier and left on the dock.”3Prescriptive analytics is where progressive companies are focusing investment as it goes a stepfurther by suggesting how you should address the future opportunities or problems identified bypredictive analytics. Analyzing current data sets for patterns, prescriptive analytics evaluate thepossible outcomes of the multiple courses of action. This not only provides decision-makers withmultiple options on how to address the issue but also the hypothetical impact of each option.Although only 10% of organizations currently use some form of prescriptive analytics, Gartnerpredicts that the use of prescriptive analytics will grow to 35% in organizations by 2020.Finally, and most importantly, when you combine advanced technology, such as artificialintelligence or machine learning with data analysis, you uncover new opportunities to improvesupply chain efficiency, planning and forecasting.Gartner’s 2017 Market Guide for Supply Chain Analytics Technology Report predicts thattechnology advances will transform the supply chain of the future. “Machine learning will becomemore prevalent in areas like demand forecasting, dynamic pricing and asset maintenance.Prescriptive capabilities, spanning optimization, heuristics, and decision analysis will become moredynamic, accounting for more constraints, variables, complex objectives and fast response timerequirements. Cognitive analytics capabilities will be offered more broadly in cognitive and artificialintelligence platforms as well as embedded analytics in supply chain and enterprise applications.Cognitive capabilities will be further leveraged by organizations either as an advisor to businessusers for augmenting their decision-making capabilities or to automate more dynamic supply chainprocesses like order configuration or price.”The data analytics top trends in 2017 would support this statement in that:1. Unstructured data was expected to dominate the analytics landscape42. Embedded analytics is poised to take off43. Prescriptive, not predictive, analytics will rule the day, and4. Big data and analytics are in the top three most popular technology trends (KPMG TechnologyTrends Index)One would concur that the benefits of utilizing data analytics to improve supply chain efficiency areextremely varied. For example, data analytics can facilitate: Data validation/error checkingDetecting anomalies in your supply chainBenchmarking your operations versus internal or external normsMobile reporting of opportunities or problemsGlobal logistics visibilityReal-time route optimizationImproved demand forecastImproved inventory managementImproved responses to government audits
HOW BIG DATA AND DATA ANALYTICS WILL TRANSFORM SUPPLY CHAINS 5For Global Trade Management software providers, the availability of customer dashboards withinGTM solutions, known as embedded analytics, will become pervasive. If it doesn’t already, yourGTM application will not only monitor your trade compliance efforts versus internal KPIs but alsoprovide you with many of the analytical tools discussed previously on a single dashboard tied to theuser’s specific compliance tasks.How Customs Authorities are Using Big Data and Data AnalyticsThe power of data analytics and big data has not gone unnoticed by customs authorities — adevelopment that suggests both opportunities and risk.The WCO recently published a paper authored by a member of their research staff, YotaroOkazaki, entitled “Implications of big data for Customs — How It Can Support Risk ManagementCapabilities.” The paper discusses the implications of big data use by Customs, particularly interms of risk management. To ensure that better informed and smarter decisions are taken, someCustoms administrations have already embarked on big data initiatives, leveraging the powerof analytics, ensuring the quality of data (regarding cargos, shipments, and conveyances), andwidening the scope of data they could use for analytical purposes.The CPB’s (Customs and Border Protection) Performance and Accountability Report outlinestheir objective for each calendar year. In their 2016 report, under the objective “StrengthenComprehensive Trade Enforcement Trade Analytics,” CBP specifically outlined their big datastrategy. “CBP pursues opportunities with the academic community to take advantage of innovativeand creative models to analyze the unprecedented information windfall known as ‘big data.’”With the movement to e-filing and single windows, information can be processed and sharedbetween government agencies more efficiently, which should reduce error rates and potentiallyshorten time of entry. Other potential benefits include improved tax fraud detection, threatprevention, and better need assessments for heightened security. However, these benefits need tobe balanced with privacy protection and data security.Faster, deeper insight into customs filings though the application of data analytics could alsoincrease the likelihood and volume of customs audits. Companies who do not have the sameanalytical tools as Customs at their disposal may find themselves at a disadvantage whenresponding to customs audits.Making the Most of Big Data and Data Analytics in Global Trade ManagementInvesting in a global trade management solution provides the added benefit of capturing supplychain data in a central, standardized data format. Your GTM solution offers a repository for numericand trade compliance documentation that makes the introduction of data analytics somewhateasier. In the end, data analytics has the potential to benefit your organization through cost savingsand operational efficiency. Equally important is the fact that data analytics will benefit tradecompliance experts professionally. With the proper analytical tools, you can reduce mundane,manual tasks and become a trusted advisor as you increase your focus on strategic planning.When it comes to big data, organizations can take advantage of large-scale opportunities, as bothstructured and unstructured data can be consolidated and analyzed from multiple perspectives.These perspectives reveal insights that guide companies to scale their programs by combining dataanalytics with other applications, therefore embedding intelligence in every process.As rapid advances in technology provide companies with the resources needed to manage theirsupply chains in real-time, trade compliance professionals have an opportunity to grow salesinternationally while delivering products more efficiently. Organizations that openly embrace newtechnology and have firm commitments to automate the supply chain functions will clearly havea competitive edge over their peers. Access to data in a unified and organized manner, along withthe ability to quickly utilize this information for supply chain decisions, is no longer an option formultinational organizations, but an essential supply chain strategy required to compete in today’sglobal economy.
Thomson Reuters Thomson Reuters is the world’s leading source of news andinformation for professional markets. Our customers rely on usto deliver the intelligence, technology and expertise they need tofind trusted answers. The business has operated in more than 100countries for more than 100 years. Thomson Reuters shares arelisted on the Toronto and New York Stock Exchanges (symbol: TRI).For more information, visit tr.com.Thomson Reuters ONESOURCE Thomson Reuters ONESOURCE is the industry’s leadingcorporate tax technology platform. ONESOURCE enables globaltax compliance and accounting decision-making. In over 180countries, ONESOURCE helps companies stay in compliance, avoidpenalties and audits, save time and increase efficiency throughevery step of the tax lifecycle, including corporate income tax,indirect tax, property tax, trust tax, tax information reporting,transfer pricing, data management and internal processes. Formore information, visit tax.tr.com/onesource.Contact us today800.865.5257tax.tr.com/onesourceReferences:1 Gartner Says Worldwide Business Intelligence and Analytics Market to Reach 18.3 Billion in 2017, Gartner press release, February 17, 20172 Gartner Forecast Snapshot: Prescriptive Analytics, Worldwide, 2016, February 5, 20163 Journal of Commerce, “Artificial intelligence promises smarter container shipping” Hugh R. Morley, Senior Editor, June 20, 20174 Innovation Analytics, September 6, 2017TA516941
The data analytics top trends in 2017 would support this statement in that: 1. Unstructured data was expected to dominate the analytics landscape4 2. Embedded analytics is poised to take off4 3. Prescriptive, not predictive, analytics will rule the day, and 4. Big data and analytics are in the top three most popular technology trends (KPMG .