Transcription
ARTICLE IN PRESSQuaternary Science Reviews xxx (2010) 1–22Contents lists available at ScienceDirectQuaternary Science Reviewsjournal homepage: www.elsevier.com/locate/quascirevHistory of sea ice in the ArcticLeonid Polyak a, *, Richard B. Alley b, John T. Andrews c, Julie Brigham-Grette d, Thomas M. Cronin e,Dennis A. Darby f, Arthur S. Dyke g, Joan J. Fitzpatrick h, Svend Funder i, Marika Holland j,Anne E. Jennings c, Gifford H. Miller c, Matt O’Regan k, James Savelle l, Mark Serreze j,Kristen St. John m, James W.C. White c, Eric Wolff naByrd Polar Research Center, Ohio State University, Columbus, OH 43210, United StatesPenn State University, University Park, PA, United StatesUniversity of Colorado, Boulder, CO, United StatesdUniversity of Massachusetts, Amherst, MA, United StateseU.S. Geological Survey, Reston, VA, United StatesfOld Dominion University, Norfolk, VA, United StatesgGeological Survey of Canada, Ottawa, Ontario, CanadahU.S. Geological Survey, Denver, CO, United StatesiUniversity of Copenhagen, Copenhagen, DenmarkjCooperative Institute for Research in Environmental Sciences, University of Colorado, Boulder, CO, United StateskStockholm University, Stockholm, SwedenlMcGill University, Montreal, Quebec, CanadamJames Madison University, Harrisonburg, VA, United StatesnBritish Antarctic Survey, Cambridge, United Kingdombca r t i c l e i n f oa b s t r a c tArticle history:Received 2 May 2009Received in revised form3 January 2010Accepted 3 February 2010Arctic sea-ice extent and volume are declining rapidly. Several studies project that the Arctic Ocean maybecome seasonally ice-free by the year 2040 or even earlier. Putting this into perspective requires information on the history of Arctic sea-ice conditions through the geologic past. This information can be providedby proxy records from the Arctic Ocean floor and from the surrounding coasts. Although existing records arefar from complete, they indicate that sea ice became a feature of the Arctic by 47 Ma, following a pronounceddecline in atmospheric pCO2 after the Paleocene–Eocene Thermal Optimum, and consistently covered atleast part of the Arctic Ocean for no less than the last 13–14 million years. Ice was apparently most widespread during the last 2–3 million years, in accordance with Earth’s overall cooler climate. Nevertheless,episodes of considerably reduced sea ice or even seasonally ice-free conditions occurred during warmerperiods linked to orbital variations. The last low-ice event related to orbital forcing (high insolation) was inthe early Holocene, after which the northern high latitudes cooled overall, with some superimposed shorterterm (multidecadal to millennial-scale) and lower-magnitude variability. The current reduction in Arctic icecover started in the late 19th century, consistent with the rapidly warming climate, and became verypronounced over the last three decades. This ice loss appears to be unmatched over at least the last fewthousand years and unexplainable by any of the known natural variabilities.Ó 2010 Elsevier Ltd. All rights reserved.1. IntroductionThe most defining feature of the surface of the Arctic Oceanand adjacent seas is its ice cover (Fig. 1), which waxes and waneswith the seasons, and changes in extent and thickness on interannual and longer time scales. These changes, while driven byclimate, themselves affect atmospheric and hydrographic* Corresponding author. Fax: þ1 614 292 4697.E-mail address: polyak.1@osu.edu (L. Polyak).conditions in high latitudes on various time scales (e.g., Smithet al., 2003; Kinnard et al., 2008; Steele et al., 2008; Milleret al., this issue). Observations during the past several decadesdocument substantial, accelerating retreat and thinning of theArctic sea-ice cover (e.g., Comiso et al., 2008; Stroeve et al., 2008).Based on climate simulations, the Arctic Ocean may becomeseasonally ice-free as early as around 2040 (Holland et al., 2006a;Wang and Overland, 2009).A reduction in sea-ice extent will promote strong Arctic warmingthrough the ice-albedo feedback mechanism and may influenceweather systems beyond the Arctic (e.g., Francis et al., 2009). Changes0277-3791/ – see front matter Ó 2010 Elsevier Ltd. All rights reserved.doi:10.1016/j.quascirev.2010.02.010Please cite this article in press as: Polyak, L., et al., History of sea ice in the Arctic, Quaternary Science Reviews (2010), doi:10.1016/j.quascirev.2010.02.010
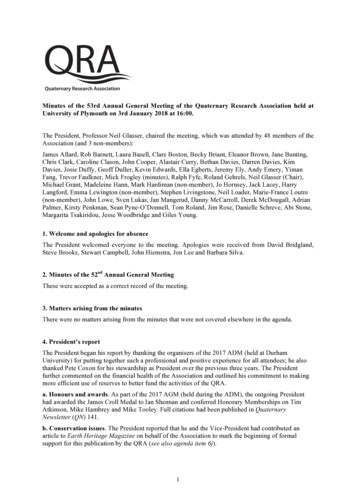
ARTICLE IN PRESS2L. Polyak et al. / Quaternary Science Reviews xxx (2010) 1–22direction of paleoclimate research, a considerable amount of relevant data appeared recently, and some of the paleo-recordsgenerated earlier can be re-evaluated from the sea-ice perspective. This paper provides an overview of the Arctic sea-ice historyspanning multiple climate regimes, from the early Cenozoic topresent.2. Background on Arctic sea-ice cover2.1. Ice extent, thickness, drift, and durationFig. 1. Overview map of the Arctic and adjacent regions showing the extent of sea ice:magenta and blue lines – March and September medians for 1979–2000, respectively;white field – September 2007 extent (courtesy National Snow and Ice Data Center,Boulder, Colorado). Major circulation systems are schematically shown by greenarrows. BG – Beaufort Gyre, TPD – Transpolar Drift, BS – Bering Strait, FS – Fram Strait.(For interpretation of the references to color in this figure legend, the reader is referredto the web version of this article.).in ice cover and freshwater flux out of the Arctic Ocean may also affectcirculation in the North Atlantic, which has profound influence onclimate in Europe and North America (Seager et al., 2002; Hollandet al., 2006b). Continued ice retreat will accelerate coastal erosionowing to increased wave action (Jones et al., 2009) and will havecascading effects on the Arctic Ocean food web including top predators, such as polar bears and seals (e.g., Derocher et al., 2004; Durneret al., 2009). This will affect indigenous human populations thatharvest ice-dependent species. Recent years have already witnessedan intrusion of exotic planktonic biota into the high Arctic (Hegsethand Sundfjord, 2008), while some Pacific plankters penetrated viathe Arctic into the North Atlantic for the first time since ca 800 ka(Reid et al., 2007). Another consequence of reduced ice is enhancedmarine access to the Arctic Ocean. While providing opportunities forcommercial shipping and natural-resource exploitation, this raisesa broad set of environmental concerns such as contamination andinfringement on natural habitats (e.g., ACIA, 2005).Interpreting observed recent changes and modeling futurechanges in the sea-ice cover require a longer-term perspective,from which we can better understand the Arctic’s natural variability and response to external forcing over time. Although thetargeted investigation of paleo-sea-ice conditions is a fairly newArctic sea-ice cover attains its maximum seasonal extent inMarch and shrinks through spring and summer to a minimumextent in September. For the period of reliable satellite observations(1979 onwards), extremes in Northern Hemisphere ice extent,defined as the ocean region with at least 15% ice cover, are16.44 106 km2 for March 1979 and 4.28 106 km2 for September2007 (Fetterer and Knowles, 2002, updated; Stroeve et al., 2008). Theice cover can be broadly divided into a perennial ice zone, where iceis present throughout the year, and a seasonal ice zone, where ice ispresent only seasonally (Fig. 1; Weeks and Ackley, 1986; Wadhams,2000). A considerable fraction of Arctic sea ice is perennial, whichdiffers strongly from Antarctic sea ice, which is nearly all seasonal.Ice concentrations in the perennial ice zone typically exceed 97% inwinter but fall to 85–95% in summer. Sea-ice concentrations in theseasonal ice zone are highly variable, and in general (but not always)decrease toward the southern sea-ice margin.The thickness of sea ice, which varies markedly in both spaceand time, can be described by a probability distribution. For theArctic Ocean as a whole, the peak of this distribution has beentypically cited at about 3 m (Williams et al., 1975; Wadhams, 1980),but there is growing evidence (discussed below) that shrinking iceextent over recent decades has been attended by substantial thinning. Although many different types of sea ice can be defined, thetwo basic categories are: (1) first-year ice, which represents a singleyear’s growth, and (2) multi-year ice, which has survived one ormore melt seasons (Weeks and Ackley, 1986). New ice forms duringautumn in seasonally open water, mostly over continental shelves,and is then transported into the central Arctic basin, and canthicken through bottom growth. Undeformed first-year ice canreach as much as 1.5–2 m in thickness. Although multi-year ice isgenerally thicker, first-year ice that undergoes convergence and/orshear can produce ridges as thick as 20–30 m.Under the influence of winds and ocean currents, the Arcticsea-ice cover is in nearly constant motion. The large-scale circulation principally consists of the Beaufort Gyre, a mean annualclockwise motion in the western Arctic Ocean with a drift speed of1–3 cm s 1, and the Transpolar Drift, the movement of ice from thecoast of Siberia eastward across the pole and into the NorthAtlantic by way of Fram Strait (Fig. 1). Ice velocities in the Transpolar Drift increase toward Fram Strait, where the mean driftspeed is 5–20 cm s 1 (Thorndike, 1986; Gow and Tucker, 1987).About 20% of the total ice area of the Arctic Ocean and nearly all ofthe annual ice export is discharged each year through Fram Strait,the majority of which is multi-year ice. This ice subsequentlymelts in the northern North Atlantic, and since the ice is relativelyfresh compared with sea water, this melting adds freshwater tothe ocean in those regions.2.2. Recent changes and projections for the futureThe composite historical record of Arctic ice margins showsa general retreat of seasonal ice since about 1900, and acceleratedretreat of both seasonal and annual ice during the last five decades(Fig. 2a) (Kinnard et al., 2008). The most reliable observations arePlease cite this article in press as: Polyak, L., et al., History of sea ice in the Arctic, Quaternary Science Reviews (2010), doi:10.1016/j.quascirev.2010.02.010
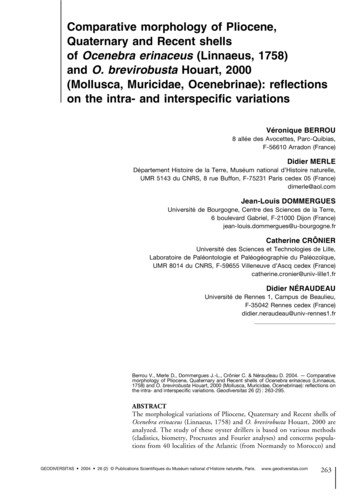
ARTICLE IN PRESSL. Polyak et al. / Quaternary Science Reviews xxx (2010) 1–22Min ice extent (106 km2)1710169158b7106 km218Max ice extent (106 km2)a3658September ice extent741880 1900 1920 1940 1960 1980 2000YearKinnard et al., 20081980 1985 1990 1995 2000 2005 2100YearNational Snow and Ice Data CenterFig. 2. (a) Maximal (winter) and minimal (summer) Arctic sea-ice extent time series, 1870–2003 (from Kinnard et al., 2008). Smooth lines are robust spline functions that highlightlow-frequency changes. Vertical dotted lines separate the three periods for which data sources changed fundamentally: earliest, 1870–1952, observations of differing accuracy andavailability; intermediate, 1953–1971, generally accurate hemispheric observations; most recent, 1972–2003, satellite period, best accuracy and coverage. Shaded area highlights theperiod of summer ice extent observations shown in 2b. (b) Extent of Arctic sea ice (15% concentration) in September, 1979–2009 (National Snow and Ice Data Center, Boulder,Colorado). The 30-yr linear trend shows a decline of 11% per decade. Note different methods of ice area estimate in (a) and (b) resulting in slightly higher values in (a) (details inKinnard et al., 2008).from 1979 onwards, corresponding to the modern satellite era.Patterns of ice-margin retreat may differ between different periodsand regions of the Arctic, but the overall retreat trend is clearlylarger than decadal-scale variability, consistent with observationsand modeling of the 20th-century ice concentrations and watertemperatures (Polyakov et al., 2005; Kauker et al., 2008; Steeleet al., 2008). The severity of present ice loss can be highlighted bythe breakup of ice shelves at the northern coast of Ellesmere Island(Mueller et al., 2008), which have been stable until recently for atleast several thousand years based on geological data (Englandet al., 2008). On the basis of satellite records, negative trends insea-ice extent encompass all months, with the strongest trend inSeptember. As assessed by the U.S. National Snow and Ice DataCenter, the September trend over the period 1979–2009 is 11% perdecade (Fig. 2b; http://nsidc.org/data/seaice index). Conditions in2007 serve as an exclamation point on this ice loss (Comiso et al.,2008; Stroeve et al., 2008). The average September ice extent in2007 of 4.28 million km2 was the lowest in the satellite record and23% lower than the previous September 2005 record low of5.56 million km2. On the basis of an extended sea-ice record, itappears that the September 2007 ice extent is only half of thatestimated for the period 1950–1970 based on the Hadley Center seaice and sea-surface temperature data set (HadlSST) (Rayner et al.,2003). While the ice extent rebounded slightly in September2008 and 2009, these months rank second and third lowest in thesatellite record, respectively.Many factors may have contributed to this ice loss (Serreze et al.,2007a), such as general Arctic warming (Rothrock and Zhang,2005), extended summer melt season (Stroeve et al., 2006), andeffects of the changing phase of large-scale atmospheric patternssuch as the Northern Annular Mode and the Dipole Anomaly (Wanget al., 2009). These atmospheric forcings have flushed some thickermulti-year ice out of the Arctic and left thinner first-year ice that ismore easily melted out in summer (e.g., Rigor and Wallace, 2004;Rothrock and Zhang, 2005; Maslanik et al., 2007a), changedocean heat transport (Polyakov et al., 2005; Shimada et al., 2006),and increased recent spring cloud cover that augments the longwave radiation flux to the surface (Francis and Hunter, 2006).Strong evidence for a thinning ice cover comes from an ice-trackingalgorithm applied to satellite and buoy data, which suggests thatthe amount of the oldest and thickest ice within the multi-yearpack has declined significantly (Maslanik et al., 2007b). The areaof the Arctic Ocean covered by predominantly older ice (5 or moreyears old) decreased by 56% between 1982 and 2007. Within thecentral Arctic Ocean, the coverage of old ice has declined by 88%,and ice that is at least 9 years old (ice that tends to be sequesteredin the Beaufort Gyre) has essentially disappeared. Examination ofthe distribution of ice of various thicknesses suggests that this lossof older ice translates to a decrease in mean thickness for the Arcticfrom 2.6 m in March 1987–2.0 m in 2007 (Maslanik et al., 2007b).The role of greenhouse gas forcing on the observed sea-ice areatrends finds strong support from the study of Zhang and Walsh(2006). These authors showed that for the period 1979–1999, themulti-model mean trend projected by the Coupled Model Intercomparison Project, version 3 (CMIP3; IPCC, 2007) is downward, asare trends from most individual simulations. However, Stroeveet al. (2007) found that few or none (depending on the timeperiod of analysis) of the September trends from the CMIP3 runsare as large as that observed in satellite data. If the multi-modelmean sea-ice trend is assumed to be a reasonable representationof change forced by increased concentrations of greenhouse gases,then 33–38% of the observed September trend from 1953 to 2006 isexternally forced, and that percentage increases to 47–57% from1979 to 2006, when both the model mean and observed trend arelarger. Although this analysis argues that natural variability hasstrongly contributed to the observed trend, Stroeve et al. (2007)concluded that, as a group, the models underestimate the sensitivity of sea-ice cover to forcing by greenhouse gases. Overly thickice simulated by several of the models appears to provide at leasta partial explanation for the disparity between model results andobserved trends.About half of the CMIP3 models driven with the middle-rangeSRES A1B emissions scenario (which reaches 720 ppm CO2 levelsby 2100) simulate complete or nearly complete loss (less than1 106 km2) of September sea ice, with some of them obtainingnear ice-free September conditions as early as 2040 (Arzel et al.,2006). These simulations retain winter sea ice throughout the21st century, although this thins considerably compared to late20th century conditions. As discussed by Holland et al. (2009), theintermodel scatter in changing sea-ice mass budgets over the 21stcentury is considerable, with changes in downwelling longwaveand net shortwave fluxes in the future Arctic climate being uncertain. This in turn suggests that uncertainties in evolving cloud andsurface albedo conditions are important players in the range offuture sea-ice loss simulated by current climate models. Nevertheless, as discussed above, these models as a group may be tooPlease cite this article in press as: Polyak, L., et al., History of sea ice in the Arctic, Quaternary Science Reviews (2010), doi:10.1016/j.quascirev.2010.02.010
ARTICLE IN PRESS4L. Polyak et al. / Quaternary Science Reviews xxx (2010) 1–22conservative, and predict a later rather than earlier date, for whenthe Arctic Ocean will be ice-free in summer.Recent modeling studies have discussed the possibility of rapidchange in future Arctic summer ice conditions. Simulations basedon the Community Climate System Model, version 3 (CCSM3)(Holland et al., 2006a) indicate that the end-of-summer ice extentis sensitive to ice thickness in spring. If the ice thins to a morevulnerable state, a ‘‘kick’’ associated with natural climate variabilitycan result in rapid summer ice loss enhanced by the ice-albedofeedback. In the CCSM3 events, anomalous ocean heat transportacts as this trigger. In one ensemble member, the area of Septemberice decreases from about 6 106 km2 to 2 106 km2 in 10 years,resulting in a nearly ice-free September by 2040. This result is notjust an artifact of CCSM3, as a number of other climate models showsimilar rapid ice loss. Additionally, the broad similarities of thesemodel results to the large ice loss event of 2007 provide furthersupport that instances of rapid summer ice loss may well occur ina near-future Arctic system.2.3. Influences of sea-ice loss on the climate systemSeasonal changes in the net surface heat flux associated with seaice processes modulate atmospheric energy transports andexchange. The albedo of sea-ice ranges from over 80% when it isfreshly snow-covered to around 50% during the summer meltseason, and can be lower in areas of water ponded on ice (e.g.,Perovich et al., 2002). This high reflectivity contrasts with the darkocean surface, which has an albedo of less than 10%. The high albedoand large surface area of Arctic sea ice, coupled with the solar energyused to melt ice and to increase the sensible heat content of theocean, keep the Arctic atmosphere cool during summer. This coolerpolar atmosphere helps to maintain a steady atmospheric polewardheat transport from lower latitudes into the Arctic. During autumnand winter, energy derived from incoming solar radiation is small ornonexistent in polar areas. However, heat loss from the surface addsheat to the atmosphere, reducing the requirements for atmosphericheat to be transported poleward into the Arctic (Serreze et al.,2007b).Model experiments have addressed potential changes in theregional and large-scale aspects of atmospheric circulation thatmay result from a loss of sea ice. Magnusdottir et al. (2004) foundthat a reduced area of winter sea ice in the North Atlantic promoteda negative phase of the North Atlantic Oscillation in the model, withstorm tracks weaker and shifted southward. Many observationsshow that sea ice in this region affects the development of mid- andhigh-latitude cyclones because of the strong horizontal temperature gradients along the ice margin (e.g., Tsukernik et al., 2007).Singarayer et al. (2006) forced an atmospheric model by combiningthe area of sea ice in 1980–2000 and projected reductions in sea iceuntil 2100. In one simulation, mid-latitude storm tracks wereintensified with increased winter precipitation throughout westernand southern Europe. Sewall and Sloan (2004) found that reducedice cover led to less rainfall in the American west. In summary,although these and other simulations point to the importance ofsea ice on climate outside of the Arctic, different models producedifferent results. Coordinated experiments that use a suite ofmodels are needed to help to reduce uncertainty.Models consistently simulate amplification of Arctic surfacewarming in response to rising CO2 levels (e.g., Manabe and Stouffer,1980; Holland and Bitz, 2003). While a number of processes causethis Arctic amplification, much of the signal can be attributed to theloss of sea ice and surface albedo change. Retreat of the ice marginallows the dark, low-albedo ocean to readily absorb solar energy,increasing the summer heat content in the ocean mixed layer. Iceformation in autumn and winter is delayed. This allows for a largeupward heat transfers from the ocean to the atmosphere (e.g., Hall,2004; Winton, 2006; Graversen and Wang, 2009; Serreze et al.,2009). However, the magnitude of Arctic amplification does varyconsiderably across different climate models. Models with relativelythin initial sea-ice tend to exhibit higher polar amplification (Rindet al., 1995; Holland and Bitz, 2003). Recent observations (Serrezeet al., 2009) suggest that an amplified warming signal is nowemerging in the Arctic, much like that projected by climate models.Climate models also indicate that changes in the melting andexport of sea ice to the North Atlantic can modify large-scale oceancirculation (e.g., Delworth et al., 1997; Mauritzen and Hakkinen,1997; Holland et al., 2001). In particular, exporting more freshwater from the Arctic increases the stability of the upper ocean inthe northern North Atlantic. This may suppress convection, leadingto reduced formation of North Atlantic Deepwater and weakeningof the Atlantic meridional overturning cell (MOC). This suppressionmay have far-reaching climate consequences (Manabe and Stouffer,1999; Clark et al., 2002). The considerable freshening of the NorthAtlantic since the 1960s has an Arctic source (Peterson et al., 2006).Total Arctic freshwater output to the North Atlantic is projected toincrease through the 21st century, and decreases in the export ofsea ice will be more than balanced by the export of liquid freshwater (derived from the melting of Arctic glacial ice, increased netprecipitation, and increased river input). However, the net effect ofthese various changes in freshwater buoyancy forcing for the netMOC response remains uncertain.3. Types of paleoclimate archives and proxies for thesea-ice recordThe past distribution of sea ice is recorded in sedimentspreserved on the seafloor and in deposits along many Arctic coasts.Indirect information on sea-ice extent can also be derived fromterrestrial paleclimate archives such as the coastal vegetation andice cores. Such paleoclimate information provides a context, withinwhich the patterns and effects of current and projected future iceconditions can be evaluated.3.1. Marine sedimentary recordsThe most complete and spatially extensive records of past seaice conditions are provided by seafloor sediments from areas thatare or have been covered by floating ice. Sea ice affects deposition ofsuch sediments directly or indirectly through physical, chemical,and biological processes. These processes, and thus the ice characteristics, can be reconstructed from a number of sedimentproxies outlined below.Sediment cores that represent the long-term history of sea iceembracing millions of years are most likely to be found in the deep,central part of the Arctic Ocean, where the seafloor was not erodedduring periods of lower sea-level and the passage of large ice sheets.On the other hand, rates of sediment deposition in the central ArcticOcean are generally low, on the order of centimeters or even millimeters per thousand years (Backman et al., 2004; Polyak et al.,2009), so that sedimentary records from these areas may notcapture short-term (submillennial or even millennial-scale) variations in paleoenvironments. By contrast, cores from Arctic continental margins sometimes provide high-resolution records thatcapture events on century or even decadal time scales, but thesecores usually cover a relatively short time interval since the LastGlacial Maximum (LGM) and the corresponding low sea-level stand( ca 20 kyr). Furthermore, paleoenvironmental signals in thesecores are often overwhelmed by local freshwater fluxes and redeposition of terrestrial material during the post-LGM flooding of theshallow shelves fed by large rivers, a problem that is especiallyPlease cite this article in press as: Polyak, L., et al., History of sea ice in the Arctic, Quaternary Science Reviews (2010), doi:10.1016/j.quascirev.2010.02.010
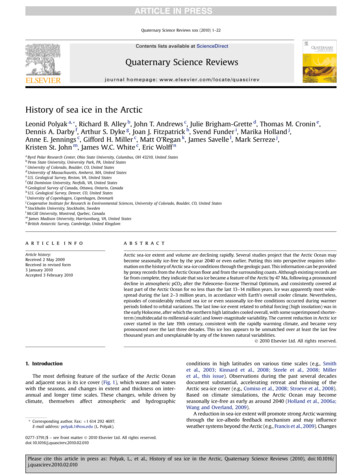
ARTICLE IN PRESSL. Polyak et al. / Quaternary Science Reviews xxx (2010) 1–22common for the Siberian continental margin (e.g., Bauch et al., 2001;Stein et al., 2004). A combination of sediment cores from the centralbasin and from continental margins of the Arctic Ocean is needed tofully characterize sea-ice history and its relation to climate change.Until recently, most cores relevant to the history of sea-ice coverwere collected from low-Arctic marginal seas, such as the BarentsSea and the Nordic Seas. There, restricted ice conditions allow foreasier ship operation, whereas sampling in the central Arctic Oceanrequires the use of heavy icebreakers. Recent advances – notablyseveral icebreaker coring cruises such as the 2005 Trans-ArcticExpedition (HOTRAX: Darby et al., 2005) and the first deep-seadrilling in the central Arctic Ocean (ACEX: Backman et al., 2006)(Fig. 3) d provide new, high-quality material from the Arctic Oceanproper, with which to characterize past variations in ice cover.3.1.1. Ice-rafted sedimentThe most direct proxies for the presence of floating ice arederived from sediment that melts out or drops from ice transportedby wind and surface currents from the sites of sediment entrainment. Ice-rafted debris (IRD), usually defined as the coarse sediment fraction ( 63 mm or sometimes even coarser fractions) iscommonly used as an indicator of deposition from ice, which caninclude both iceberg and sea-ice rafting (Lisitzin, 2002, and references therein). Distinguishing between these two ice-transportprocesses is important, yet challenging, for a correct interpretation of glaciomarine paleoenvironments.Icebergs can carry sediment grains of all sizes, from clay toboulders, as inherited from sediment material entrained in glaciers.Although in some cases this material can be relatively fine grained,typically iceberg-rafted sediment has a high content of coarse IRD,exceeding 10–20% 63 mm (e.g., Clark and Hanson, 1983;Dowdeswell et al., 1994; Andrews, 2000). During glacial periodssedimentation in the Arctic is interpreted to be predominantlyiceberg-derived due to low sea levels, and thus exposure of shallowcontinental shelves, and huge ice-sheet fronts surrounding the ArcticOcean. This inference is consistent with greater IRD abundances inglacial and deglacial intervals in sediment cores (e.g., Phillips andGrantz, 2001; Adler et al., 2009; Polyak et al., 2009). During interglacials, exemplified by the modern conditions, contribution oficebergs to sediment transport and deposition in the Arctic is limitedand plays a significant role only in areas proximal to calving glacierssuch as around Greenland and the eastern Canadian Arctic (e.g.,Andrews et al., 1997; Lisitzin, 2002). In contrast, the role of sea iceduring interglacials is greatly enhanced in the Arctic by the availability of broad and shallow continental shelves, the major sites ofsea ice formation.Sediment entrainment in sea ice occurs mostly during periods ofice-freeze-up (frazil-ice formation) on the shallow shelves and islargely restricted to fine silt and clay-size sediments available in thesuspension (e.g., Kempema et al., 1989; Nürnberg et al., 1994;Lisitzin, 2002; Darby, 2003), although the relative contribution ofthese grain-size fractions may vary geographically (Hebbeln, 2000;Lisitzin, 2002). While sea-ice transported sediment is dominantlyfine-grained, there are conditions in which sea ice can containcoarser grains. Coarse sediment shed from coastal cliffs can betransported by landfast ice, but its distribution is mostly limited tonear-coastal areas. Anchor ice, which forms on the seafloor insuper-cooled conditions, can entrain any sediment available on theshallow shelves (Reimnitz et al., 1987); however, the relativecontribution of anchor ice to the overall Arctic ice cover is not fullyunderstood. Studies of sediment in modern sea-ice samples showthe amount of 63 mm grains as less than 5–10% (e.g., Clark andHanson, 1983; Pfirman et al., 1990; Nürnberg et al., 1994; Darby,2003; Darby et al., 2009), and these numbers are probably biasedtowards higher values due to preferential sampling of easily5identifiable patches of sandy ice. Overall it can be concluded thatsediment in the Arctic Ocean with IRD abundances exceeding theabove numbers is indicative of iceberg deposition, whereas lowIRD numbers can be produced by both iceberg and sea ice affectedenvironment. We note that in some subarctic seas, such as in thenorthwest Pacific, sea-ice sediment may have higher IRD contentthan in the Arctic due to different sedimentary environments in thecoastal zone (Lisitzin, 2002).Detailed grain-size analyses show that both sea ice and seafloorHolocene deposits in the Arctic Ocean contain sediments withmodes in clay or fine silt fractions, but also with a bimodal distribution, where the second mode is in coarser silt to sand fractions(Darby et al., 2009). The fine-grained types are likely relate
2 L. Polyak et al. / Quaternary Science Reviews xxx (2010) 1-22 ARTICLE IN PRESS Please cite this article in press as: Polyak, L., et al., History of sea ice in the Arctic, Quaternary Science Reviews (2010), doi:10.1016/ j.quascirev.2010.02.010. from 1979 onwards, corresponding to the modern satellite era.