Transcription
Distributed Generation Cost AnalysisINTRODUCTIONDEEP is committed to promoting the deployment of clean energy resources cost-effectively.Distributed generation provides many benefits to the electric grid, including but not limited toreducing system line losses, potentially delaying the need for transmission and distributioninfrastructure, reducing electric bills for participating customers, increasing resiliency and energysecurity, contributing to economic development, and potentially encouraging positive land-use.However, current compensation and incentive structures for distributed generation that are tiedto the retail electricity rate (e.g. net energy billing) present uncertainty for developers andcustomers, and an overall growing cost. DEEP evaluated six scenarios on how to cap the costs ofthese programs: These scenarios included:1. A Business as Usual approach, in which the RSIP and LREC/ZREC programs areexpanded through 2030 and net energy billing continues indefinitely.2. A MW cap resulting in 2.5 percent of the load served by distributed generation by 2030(i.e., 0.25 percent per year, as suggested in the draft CES in July 2017).3. A MW cap resulting in 5 percent of the load served by distributed generation by 2030(i.e., 0.5 percent per year).4. A spending cap of 25 million per year.5. A spending cap of 30 million per year.6. A spending cap of 35 million per yearThis document details the assumptions and calculations used to estimate the direct costs andbenefits of these resources to Connecticut’s electric ratepayers. .It does not attempt to quantifythe indirect or non-energy benefits of any grid scale or distributed energy resources, and doesanalyze the value of distributed generationNet MeteringNet metering began in Connecticut in the 1980’s as a program for small combined heat and powersystems fueled by natural gas. In 2000, net energy billing was modified to allow Class I resourcesto be eligible for net metering. Since then, net metering has been a key incentive in promotingthe installation and deployment of Class I distributed generation in Connecticut. In accordancewith section 16-243h of the General Statutes, net metering allows customers to offset allvolumetric charges from their electricity bill. EDCs are required to “credit” customers for electricitygenerated by a customer from a Class I renewable energy source facility that has a nameplatecapacity of 2 megawatts or less. These credits offset kilowatt hours supplied by the EDC. Suchcredits are allowed to be rolled over into the following month if production is in excess ofconsumption. This allows customers to net more generation at the retail rate than under monthlyPage 1
netting. Any excess credits at the end of the year are compensated at the avoided cost ofwholesale power.1 There is currently no cap on the amount of Class I net metering in Connecticut.The level of compensation a participating customer receives under net metering is a direct resultof retail electricity rates. DEEP calculated the net energy billing rates by only accounting for thevolumetric charges a customer is allowed to offset from their electric bill. For residential customersthis would account for nearly all of the electric charges on a customer’s bill, with the exception ofcustomer service charge.TABLE 1: Historical Residential Net Energy Billing Rates (cents/kwh, nominal )2Standard ServiceGenerationVolumetric EnergyChargesTotal Net EnergyBilling 2.26 7.577.939.189.9918.62 17.7216.4615.3115.1017.035.1016.976.3618.51 17.52 18.03Commercial and industrial (C/I) customers are also allowed to offset all volumetric charges, withthe exception of customer charges and demand based charges. Demand-based charges generallymake up a large portion of the bill. Therefore, C/I electric bills are generally composed mostly ofnon-volumetric charges (e.g. demand charges) and therefore C/I customers are compensated lesson a cents/kWh basis than residential customers.TABLE 2: Historical Commercial and Industrial Net Energy Billing Rates (cents/kwh,nominal )Standard Service GenerationVolumetric Energy ChargesTotal Net Energy Billing 2012.5820169.1491.6210.77Residential Net Metering ForecastDEEP evaluated historical residential net metering rates, from 2008 through 2017 to forecastresidential net metering rates from 2018 through 2049. The residential net metering forecast wasdeveloped by applying trending assumptions for individual rate components of the allowablecharges that a distributed generation customer could offset. Some components, such asTransmission and Generation, were forecasted by using established trending assumptions detailedin the table below. Others, such as the Conservation, CTA, SBC, etc., were kept constant12CGS 16-243HWeighted Average of Eversource and United IlluminatingPage 2
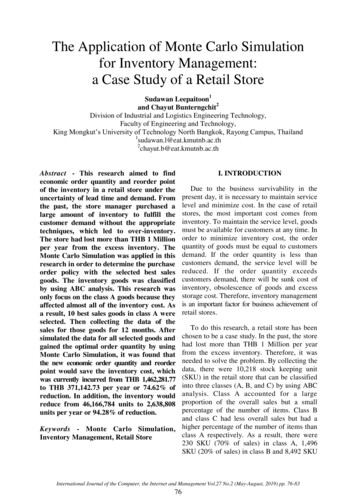
throughout the forecast period because they are relatively small and further assumptions wouldneed to be made with regard to state policy changes in order to change the current rates for thesecomponents (e.g., conservation).TABLE 3: Residential Net Metering Rate Forecast Trending AssumptionsCategoryTrending n 2%EIA 2017 Transmission Cost Forecast 3EIA 2017 Generation Price Forecast 4Inflation tIncreases in distribution costs were assumed to be a result of inflation and additional investmentsthat the EDCs would have to make in their service territories. DEEP further assumed thatdecoupling charges were linked to lost revenues in distribution based charges, and therefore werelinked to distribution costs. DEEP found that on average, the annual increase in distributioncharges has been around 7% (2008 through 2017). However, during some years distributioncharges increased more than 20% due to a recent rate case and in other years such charges didnot increase from the previous year. DEEP determined that using an annual increase of 4%(Inflation of 2% and a 2% adder) would be a reasonable approach in estimating future distributionrates without overestimating ratepayer costs of distribution and decoupling charges.FIGURE 4: Residential Net Metering Forecast (Nominal , 2013-2040, cents/kWh)3Table 55.5 Electric Power Projections by Electricity Market Module Region, Prices by Service Category,Transmission, Nominal Dollars4 Table 55.5 Electric Power Projections by Electricity Market Module Region, Prices by Service Category, Generation,Nominal DollarsPage 3
454035302520151050Commercial and Industrial Net Metering ForecastDEEP evaluated the commercial and industrial net metering rates from 2013 through 2016, or thetime period that the Low and Zero Emissions Renewable Energy Credit (LREC/ZREC) program hasbeen in place. In contrast to the estimation of net energy billing rates for residential customers,DEEP took a more simplified approach in estimating C/I net energy billing rates. Given the complexstructure of C/I rates, the net energy billing rates needed to only reflect volumetric based chargesand exclude any customer charges and demand based charges. Under this approach, DEEP madethe following assumptions:(1) A customer’s maximum demand does not change even with on-site generation beingavailable. This could occur because the customer’s maximum demand occurs outside ofthe time such customer is generating on site power. For example, in the case of PVgeneration, if the customer’s maximum demand occurs at night, then their maximumdemand is completely unaffected by PV generation because the system can only generatepower when the sun is shining.5(2) However, a customer’s maximum demand could occur during the day and be offset byPV generation. For example, if a customer’s maximum demand is 10 kW and they produce2 kW of on-site generation, then their net demand would be 8 kW. Let’s further supposethat the Transmission Demand charge is 6/kW and the Distribution Demand Charge is 12/kW. The cost to the customer (only for transmission and demand charges) based ontheir original demand should have been 180. However, with PV generation they have ineffect lowered their demand charges to 144 because they netted out 2 kW using PVgeneration. In this situation, the customer is paying less towards the grid than what should5This assumes that no on-site storage of any kind is availablePage 4
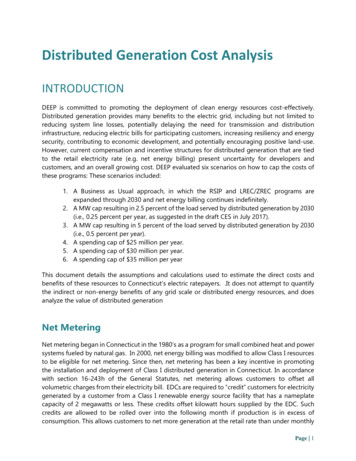
have been paid and there is some cost-shifting to other ratepayers in the short termbecause the distribution investments to serve that customer are already in place. However,as a matter of policy, DEEP believes that customers should be incentivized to reduce theirdemand on the system, whether it be by conservation or on-site generation. In addition,because of the way C/I rates are structured (i.e., incorporating demand based charges)these types of customers are not easily able to offset their entire bill through net energybilling in the same way that residential customer are able to. For these reasons, incalculating the direct cost of C/I net energy billing, only volumetric and standard servicegeneration rates were considered. The volumetric based charges are considered to beshifted costs to non-participating ratepayers, while the standard service generationcharges are considered the direct benefits.DEEP ultimately chose to use the trending assumption in Table 5 for C/I net energy billing rates.Volumetric charges are composed mainly of distribution, transmission, and other combined publicbenefit charges (e.g., NBFMCC, C&LM, etc.), but are generally small overall because the majorityof delivery costs are collected through demand based charges.The EIA 2017 Commercial/Industrial Electricity Price forecast was used as the trending assumptionfor the volumetric charges. Although the EIA 2017 C/I Electricity Price forecast incorporatesgeneration-based charges in prices, DEEP believed that this was the best available trendingforecast for these particular charges and attempting to use a high level analysis. The EIA AEO 2017Generation Price Forecast was used as the trending assumption for Connecticut generation prices.TABLE 5: Commercial/Industrial Net Metering Rate Forecast Trending AssumptionsCategoryTrending AssumptionsVolumetric ChargesEIA AEO 2017 C/I Electricity Prices ForecastEIA AEO 2017 Generation Price Forecast 6Generation6 Table 55.5 Electric Power Projections by Electricity Market Module Region, Prices by Service Category, Generation,Nominal DollarsPage 5
FIGURE 6: Commercial and Industrial Net Metering Forecast (Nominal , 2013-2040,cents/kWh)24222018161412108642-Other Incentives for Renewables GenerationIn addition to net metering, there are numerous other incentives that distributed resourcecustomers can receive for installing clean energy resources and that add to the total cost of theseprograms. For the purposes of this evaluation, DEEP only considered the two largest programs inthe state that promote the installation of distributed resources through monetary incentives thatare being implemented at this time: (1) the Green Bank’s Residential Solar Investment Program(RSIP) and (2) LREC/ZREC.LREC/ZRECPublic Act 11-80 established the LREC and ZREC programs. Launched in the summer of 2012, thisauction-structure provides an additional revenue stream to projects through long-term contractsfor renewable energy certificates (RECs). The LREC program is available to low emission Class Irenewables up to 2 MW. The ZREC program is available to zero emission Class I renewables up to1 MW. Large ZRECs (250-1,000 kW) and Medium ZRECs (100-250 kW) compete in the auction,while Small ZRECs (under 100 kW) are offered a price with an adder based on the Large andMedium ZREC auction results. Under the LREC/ZREC programs, the EDCs purchase only RECs, notenergy or capacity.The ZREC program allowed for 720 million in total spending for renewable energy credits fromzero-emission Class I renewable energy resources such as solar, wind, and small hydro to be spentover six years beginning in 2012. Beginning in 2012, EDCs must enter into 8 million worth oflong-term (15-year) contracts annually for six years. The final competitive auction for this programwas initiated in April 2017 and was completed in June of the same year. However, passage ofPublic Act 17-144 extended the ZREC program for one year for up to 4 million worth of longterm contracts.Page 6
The LREC program allowed for 300 million in total spending for renewable energy credits fromlow-emission Class I resources such as fuel cells, biomass, and landfill gas that meet certainemissions standards over five years beginning in 2012. The LREC program requires the EDCs toenter into 4 million worth of 15-year contracts annually for LRECs for five years, beginning in2012. The LREC program, originally authorized until 2016, was extended for one additional yearby the General Assembly with the passage of Public Act 16-196, which split the 8 million allocatedto the final year of ZREC equally between the LREC and ZREC programs. Public Act 17-144extended the LREC program for an additional year for up to 4 million worth of long-termcontracts.DEEP estimated that through Year 5 of the LREC/ZREC program, the EDCs have committedapproximately 759 million of the 1.02 billion lifetime budget. This would leave about 260million total remaining for LREC/ZREC projects for the term of the 15-year contracts, asdemonstrated in Table 7. In our analysis, DEEP apportioned the remaining funds ( 130 million) toYear 6 of the program. Lastly, for Year 7 in Table 8, DEEP apportioned an additional 120 million,split evenly between LREC and ZREC project, which is the cumulative cost of 15 year contracts withan annual budget of 8 million.TABLE 7: LREC/ZREC Lifetime Budgets and Committed Through Year 6ProgramZRECLRECLifetime Budget 720,000,000 300,000,000Lifetime Committed 473,367,156 285,761,747Lifetime Not YetCommitted forYear 6 130,435,548 130,435,548TABLE 8: Estimated LREC/ZREC Annual and Lifetime Budgets for Year 7ProgramZRECLRECAnnual Budgetfor Year 7 4,000,000 4,000,000Lifetime Budgetfor Year 7 60,000,000 60,000,000DEEP further calculated the weighted average cost of LREC/ZREC projects by only accounting forprojects that are were operational or approved but not yet terminated. REC contracts that wereterminated were not included in any funding or price calculations.Page 7
TABLE 9: Actual and Estimated LREC/ZREC Weighted Average Cost (Years 1-7)Year 1(2012)LREC Prices( /REC)LRECAnnualChange(Percentage)ZREC Prices( /REC)ZRECAnnualChange(Percentage)66.86133.23Year 2 Year 3 Year 4(2013) (2014) (2015)Year 5(2016)Year 6(Projection)(2018)Year %-6%12%For Years 1 through 5, DEEP used the actual bid price information provided by the EDCs. In thisanalysis, the projected price for Year 6 is the average executed contract price for LREC/ZREC bidsin Round 1 of Year 6. An additional round will be conducted for Year 6, but such prices areunknown since they had not yet been submitted to PURA at the time of DEEP’s evaluation.The projected price for Year 7 is assumed to be the same prices of executed bid prices in Round1 of Year 6. LREC/ZREC prices are set entirely by bidders in the reverse auction. Overall, the lowerthe bid the more likely a project will be chosen, so bidders are incentivized to bid low. However,because of the erratic year to year average price changes for LREC/ZREC contracts, it is verydifficult to predict the near term prices for the bids. Moreover, in recent rate cases, rates for C/Icustomers have been restructured to collect more of their costs through demand charges ratherthan volumetric charges. Hence, the net energy billing compensation is lower than it waspreviously. In turn, DEEP assumed that bidders may actually need to compensate for lower netenergy billing subsidies through higher ZREC prices if installed costs do not come down. Ifinstallation costs do come down, DEEP believes that bidders may actually bid at the same levelsto compensate for lower subsidies elsewhere. In addition, in the Round 1 of Year 6 solicitation,the percentage differential between overall bid prices and executed bid prices were generallyhigher than in the previous year, which may indicate that bidders are generally bidding higherthan in recent years. In order to balance all these variables, DEEP assumed that at least in Year 7,LREC/ ZREC prices would likely stay the same. ZREC prices for the most part are generally trendingupward, but historically ZREC and LREC prices have come down since the inception of theprogram.Page 8
TABLE 10: Year 6 – Round 1 Prices ( /REC)Large ZRECExecuted Contract Prices 64.42Medium ZREC 98.76LREC 44.49Overall Bid Prices 74.31 113.74 51.98Percent Above Executed BidPrice15.4%15.2%16.8%LREC/ZREC prices, from 2021 through 2030, were forecasted by applying the trendingassumptions in the REC Market Price Forecast. For the purposes of this analysis, DEEP assumedthat LREC/ZREC prices would change proportionally with forecasted market prices for Class I RECs.The Class I REC market price forecast was thought to be the best assumption, since it takes intoaccount a supply and demand approach for RECs as well as future price trajectories for installedcosts of clean energy and renewable technologies. For example, REC prices are projected toincrease in 2022 due to the expiration and reduction in solar tax incentives for residential and C/Iprojects.TABLE 11: Year 6 – Round 1 Prices ( /REC)Projected LREC/ZREC Prices – Average of All Sizes ( /REC)202120222023202420252026202720282029ZREC 2 50.11LREC 5 24.06Green Bank SubsidiesThe Connecticut Green Bank offers Expected Performance Based Buy-Down (EPBB) andPerformance Based Incentives (PBI) programs.The EPBB incentive is only available to Homeowners choosing to purchase a PV system from anEligible Contractor. The Eligible Contractor must present the EPBB as an upfront cost reduction tothe customer. The Green Bank issues the EPBB payment directly to the Eligible Contractor onbehalf of the homeowner at completion of the installation and upon Green Bank verification ofsubmitted completion documents.The PBI is only available to System Owners under a third-party financing structure (i.e. lease orpower purchase agreement (PPA). Under the PBI, homeowners will contract with EligibleContractors and/or Third Party System Owners to provide a solar PV system. The PBI is paid to theSystem Owner over twenty-four (24) calendar quarters (e.g. 6 year term) following a passing GreenBank inspection and is based on actual production at a per kWh rate specified at the time of RSIPPage 92030
project/incentive approval. System Owners are expected to build the expected total PBI into thelease or PPA rate to the customer.For the existing programs and expected projects to come online (2013 through 2020), DEEP usedthe following incentive rates based on information received from the Green Bank:TABLE 12: Green Bank Expected Performance Based Buy-Down, 2012-202020121,60620131,2212014912EPBB Incentive ( E 13: Green Bank Performance Based Incentives, 2012-2020PBI Incentive (cents/kwh)3/15/14/11/19/11/1 4/11 8/82016 2017 2018 2019 20202012 2012 2013 2014 2016 2015 2015 2015 10kw 30.0 30.0 22.5 18.0 12.58.06.45.44.94.44.03.63.2 20kw6.06.06.0Locational Marginal Price ForecastThe Locational Marginal Prices (LMP) price forecast were used mainly for calculating the directbenefits of grid scale projects. This works by comparing the energy price in the contract betweenthe EDCs and the project developers against the forecasted LMP price. To the extent the contractprice is below the forecasted price, ratepayers will receive a direct benefit. These LMP priceforecast was developed for use in the Public Act 15-107 Procurements and DEEP chose to use thisforecast in its CES analysis.REC Price ForecastThe annual REC price forecast used in the CES analyses were produced by Navigant, for the CleanEnergy RFP, and adopted by LAI for use in the procurement authorized under P.A. 15-107 Section1(b) (2-20 MW renewable resources).The underlying assumption of the REC price forecast model is that the REC revenues representthe additional revenue stream needed to finance and develop a new wind resource, afteraccounting for energy revenues and production tax credits. The revenue requirements modelassumes that the REC market is in equilibrium over the long term: that is, neither a shortfall norsurplus of RECs.The REC price forecast model assumes that the REC supply equals the REC demand in each year.From year to year, the market may fluctuate between an oversupply and an undersupplycondition, for a variety of reasons. For example, renewable resources are “lumpy,” creating aPage 10
temporary oversupply when added to the system; the in-service date of a new project may bedelayed; certain entities may hold a surplus of banked RECs, investor uncertainty regarding theextension of the federal production tax credit; and regulatory or statutory changes in the RPSrequirement or eligibility may change from year to year, changing the supply/demand balance.These short-term fluctuations cannot be predicted over a 20 year forecast. An equilibriumforecast best represents the expected price trajectory over the long term.The REC price forecast was prepared in January 2016 for the Clean Energy RFP when Class I RECsin both Connecticut and Massachusetts were trading in the 50 range. However, during the fourthquarter of 2016 and the first quarter of 2017, Class I RECs were trading in the 20 to 30 range.DEEP chose to use the REC forecast from the Clean Energy RFP for this analysis, despite the recentshort-term market changes at the time of preparing the forecast.In DEEPs analyses, the REC price forecast were used mainly for calculating the cost of RECs tocomply with Connecticut’s RPS requirements and ultimately generate the RPS costs in theRenewable Portfolio Standard Costs section of the Electric Power Chapter, net of RECs alreadygenerated through Connecticut’s behind the meter and grid scale programs. DEEP assumed thatstate sponsored programs that generated Class I RECs would need to be deducted from the totalRPS requirement since ratepayers would be paying for those RECs through ratepayer subsidies(i.e., Green Bank incentives, LREC/ZREC contracts, Utility built projects, or long-term PPAs). Hence,the cost of the REC is already embedded in the direct cost of those programs, even though thetypical practice is for the REC purchasers in the LREC/ZREC and RSIP programs to re-sell them intothe market rather than settle them on behalf of Connecticut ratepayers. For example, if the RPSrequired 20% of load to be met by Class I RECs, then about 5,500,000 RECs would need to be7purchased. If behind the meter programs (e.g., RSIP and LREC/ZREC) produced 1 million RECsand Grid Scale projects (e.g., Section 127, Small Scale Procurement, etc.) also produced 1 millionRECs, then 3.5 million RECs would still need to be purchased elsewhere in the market to meet theRPS requirement. Therefore, if the REC price in that year was 50, then the total ratepayer cost ofClass I market RECs would be 175 million.8Cost Benefit Assumptions for Calculating Net Direct Ratepayer CostsCost and Benefits Used in CES AnalysisDEEP calculated the annual Net Direct Ratepayer Costs by taking the difference between theannual Direct Costs and Direct benefits. Environmental benefits are embedded in the RECs, whichrepresent the environmental attribute associated with the clean generation. This does not takeinto account indirect costs and benefits like health, quality of life, etc.Direct Costs7For hypothetical purposes this assumes a total EDC load of 27,500,000 MWH.8These numbers are for illustrative purposes, they do not reflect the actual costs and REC requirements in DEEP’sanalysis. The 175 million dollar figure is the product of purchasing 3.5 million RECs at 50 in any given year.Page 11
In DEEP’s analysis, the Direct Cost are essentially the subsidies that are paid out byratepayers or subsidies that are received by participants in behind the meter or grid sideprograms.oIn the case of behind the meter programs, participants can receive a REC subsidy,but can also use net energy billing to offset their volumetric charges. Therefore,the Direct Cost for behind the meter programs were assumed to be the annualcosts of REC subsidies and the cost of all net metering credits generated.oWith regard to grid scale programs, the direct costs vary with each program and/orproject. If a project was built directly by a utility the Direct Cost would be the capitaland O&M cost of the project over a 20 year period. However, in most ofConnecticut’s grid scale programs, participants enter into long term contracts (i.e.,power purchase agreements) for energy and/or RECs. If a project was procuredthrough a PPA, the Direct Cost is the fixed contract price for each unit ofgeneration. Generally, most PPAs purchased both the energy and RECs . However,some PPAs only contracted for RECs and not energy. Grid scale programparticipants are generally not allowed to use net energy billing or be a recipient ofany other ratepayer subsidies. In addition, to date grid scale programs haverequired projects to be at least 2 MW in size. However, the Shared Clean EnergyFacilities (SCEF) pilot program allowed developers to submit proposals for projectsless than 2MW, but these participants were not allowed to use net energy billing.9Direct Benefits 9Direct Benefits were defined as the avoided utility costs that pertain to generation.oIn calculating the Direct Benefits of behind the meter programs, the StandardService Generation Rate was considered to be the quantifiable direct benefit ofgeneration. Standard service rates are generally the aggregate cost to procure afirm supply of energy, capacity, ancillary services, RPS compliance, riskmanagement, overheads, etc. DEEP recognizes that there are certain fixed costs(e.g., capacity costs) that are embedded into retail Standard Service Generationrates and that using this rate is perhaps an overestimation of the generationbenefits. However, the majority of the embedded costs in the Standard ServiceRates are composed of energy and capacity costs, the latter of which is avoidablein long run, and the other costs are generally small in comparison. Therefore, forsimplicity, DEEP decided to use the Standard Service Rate, rather than arbitrarilychoosing to only offset a portion of such rates.oIn calculating the Direct Benefits of grid scale programs, DEEP needed to considerwhether each project was purchasing energy and RECs.The Direct Costs and Direct Benefits of the SCEF program were not included in DEEP’s analysis, given that theprojects are relatively small and it is a Pilot Program.Page 12
For projects where the EDCs retained or purchased energy and RECs, theDirect Benefit was considered solely to be the Locational Marginal Price atthe time the generation was produced. For projects, where only RECs were purchased or retained, DEEP did notinclude direct benefits. The RPS compliance framework requires ratepayersto have RECs generated or purchased on their behalf, therefore, the cost togenerate the REC or purchase the REC is fully borne by ratepayers.DEEP only considered the following programs in calculating the Net Direct Ratepayer Cost sincethese programs encompass the majority of ratepayer sponsored programs.TABLE 14: Direct Costs and Benefits Included in Net Direct Ratepayer Cost Based on ProgramProgramEnergy/REC IncentiveOtherRatepayerSubsidiesDirect ons,homeownersare paid upfront incentivesfor each kW of the PVinstallation.Forleasedprojects, the developers arepaid a performance basedincentive (PBI) for each kWhof generation; this incentiveis generally paid out in 6years, however, previously itwas paid out in 5 years.RSIPparticipantsare allowedto use NetEnergyBillingindefinitely.(1) The RSIP subsidy wasconsidered to be a costto the RPS in the year thatthe incentive was paidout. For example, ifupfrontincentivestotaled 500,000 in oneyear, then that amountwas considered a cost tothe RPS for that year. Forperformancebasedincentives, only the firstyear of the PBI incentivewould be a cost to theRPS in any given year.Thecostfortheremaining years wouldbe allocated to erviceGeneration(WeightedAverageofCL&P and UI).(2) The Net Energy billingrate was assumed to be adirect cost that wouldcontinue indefinitely andwas calculated based onthe expected generationfrom the PV installations.Page 13
LREC/ZRECThe EDCs purchase RECsfrom bidders in a reverseauction. The bids are basedon the maximum annualRECs that a project canproduce. These contracts arefor 15 years.LREC/ZRECparticipantsare allowedto use ieswereconsidered direct costsand were allocated in theyear in which the RECswere expected to begenerated over a periodof 15 years. No ermhasexpired.Commercialand eofCL&P and UI).(2) (2) The Net Energybilling rate was assumedto be a year direct costthat would continueindefinitely and wascalculated based on theexpectedgenerationfrom the PV installations.Section 127Section 127 projects are amix of utility owned projectsand PPA contracts with thirdparty developers.NoneThe Direct Costs vary:Wholesale LMP(1) Utility built projects:Direct costs are
Distributed Generation Cost Analysis INTRODUCTION DEEP is committed to promoting the deployment of clean energy resources cost-effectively. Distributed generation provides many benefits to the electric grid, including but not limited to reducing system line losses, potentially delaying th