Transcription
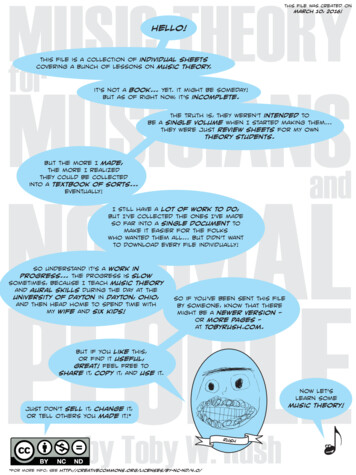
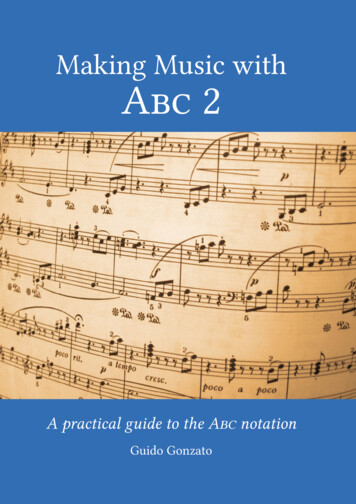
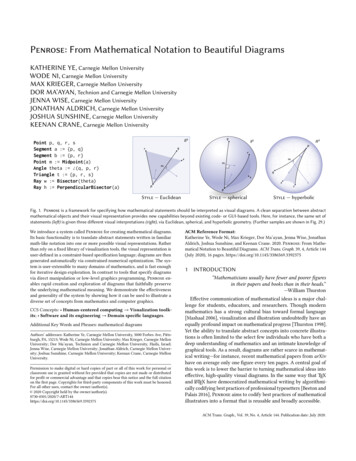
Penrose: From Mathematical Notation to Beautiful DiagramsKATHERINE YE, Carnegie Mellon UniversityWODE NI, Carnegie Mellon UniversityMAX KRIEGER, Carnegie Mellon UniversityDOR MA’AYAN, Technion and Carnegie Mellon UniversityJENNA WISE, Carnegie Mellon UniversityJONATHAN ALDRICH, Carnegie Mellon UniversityJOSHUA SUNSHINE, Carnegie Mellon UniversityKEENAN CRANE, Carnegie Mellon UniversityPoint p, q, r, sSegment a : {p, q}Segment b : {p, r}Point m : Midpoint(a)Angle theta : (q, p, r)Triangle t : {p, r, s}Ray w : Bisector(theta)Ray h : PerpendicularBisector(a)Style — EuclideanStyle — sphericalStyle — hyperbolicFig. 1. Penrose is a framework for specifying how mathematical statements should be interpreted as visual diagrams. A clean separation between abstractmathematical objects and their visual representation provides new capabilities beyond existing code- or GUI-based tools. Here, for instance, the same set ofstatements (left) is given three different visual interpretations (right), via Euclidean, spherical, and hyperbolic geometry. (Further samples are shown in Fig. 29.)We introduce a system called Penrose for creating mathematical diagrams.Its basic functionality is to translate abstract statements written in familiarmath-like notation into one or more possible visual representations. Ratherthan rely on a fixed library of visualization tools, the visual representation isuser-defined in a constraint-based specification language; diagrams are thengenerated automatically via constrained numerical optimization. The system is user-extensible to many domains of mathematics, and is fast enoughfor iterative design exploration. In contrast to tools that specify diagramsvia direct manipulation or low-level graphics programming, Penrose enables rapid creation and exploration of diagrams that faithfully preservethe underlying mathematical meaning. We demonstrate the effectivenessand generality of the system by showing how it can be used to illustrate adiverse set of concepts from mathematics and computer graphics.CCS Concepts: Human-centered computing Visualization toolkits; Software and its engineering Domain specific languages.Additional Key Words and Phrases: mathematical diagramsAuthors’ addresses: Katherine Ye, Carnegie Mellon University, 5000 Forbes Ave, Pittsburgh, PA, 15213; Wode Ni, Carnegie Mellon University; Max Krieger, Carnegie MellonUniversity; Dor Ma’ayan, Technion and Carnegie Mellon University, Haifa, Israel;Jenna Wise, Carnegie Mellon University; Jonathan Aldrich, Carnegie Mellon University; Joshua Sunshine, Carnegie Mellon University; Keenan Crane, Carnegie MellonUniversity.Permission to make digital or hard copies of part or all of this work for personal orclassroom use is granted without fee provided that copies are not made or distributedfor profit or commercial advantage and that copies bear this notice and the full citationon the first page. Copyrights for third-party components of this work must be honored.For all other uses, contact the owner/author(s). 2020 Copyright held by the .org/10.1145/3386569.3392375ACM Reference Format:Katherine Ye, Wode Ni, Max Krieger, Dor Ma’ayan, Jenna Wise, JonathanAldrich, Joshua Sunshine, and Keenan Crane. 2020. Penrose: From Mathematical Notation to Beautiful Diagrams. ACM Trans. Graph. 39, 4, Article 144(July 2020), 16 pages. ON“Mathematicians usually have fewer and poorer figuresin their papers and books than in their heads.”—William ThurstonEffective communication of mathematical ideas is a major challenge for students, educators, and researchers. Though modernmathematics has a strong cultural bias toward formal language[Mashaal 2006], visualization and illustration undoubtedly have anequally profound impact on mathematical progress [Thurston 1998].Yet the ability to translate abstract concepts into concrete illustrations is often limited to the select few individuals who have both adeep understanding of mathematics and an intimate knowledge ofgraphical tools. As a result, diagrams are rather scarce in mathematical writing—for instance, recent mathematical papers from arXivhave on average only one figure every ten pages. A central goal ofthis work is to lower the barrier to turning mathematical ideas intoeffective, high-quality visual diagrams. In the same way that TEXand LATEX have democratized mathematical writing by algorithmically codifying best practices of professional typesetters [Beeton andPalais 2016], Penrose aims to codify best practices of mathematicalillustrators into a format that is reusable and broadly accessible.ACM Trans. Graph., Vol. 39, No. 4, Article 144. Publication date: July 2020.
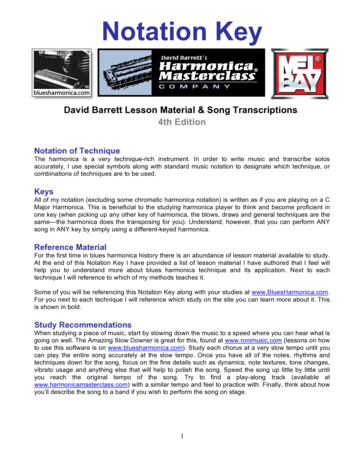
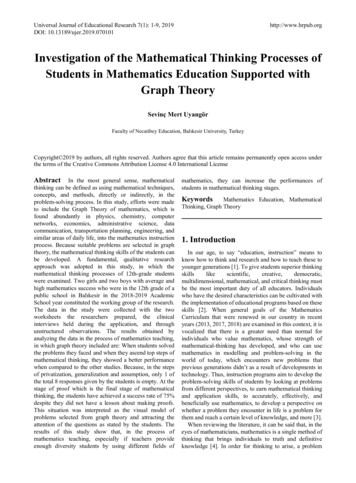
144:2 Ye et al.Our approach is rooted in the natural separation in mathematics between abstract definitions and concrete representations. Inparticular, the Penrose system is centered around the specificationof a mapping from mathematical objects to visual icons (Sec. 2).Such mappings are expressed via domain-specific languages (DSLs)that reflect familiar mathematical notation and can be applied toobtain new capabilities that are difficult to achieve using existingtools (Sec. 2.4). A key distinction is that Penrose programs encodea family of possible visualizations, rather than one specific diagram.Hence, effort put into diagramming can easily be reused, modified,and generalized. This approach has several broad-reaching benefits: Accessibility. Novice users can generate diagrams by simplytyping mathematical statements in familiar notation, leveraging the efforts of more expert package developers. Separation of content and presentation. The ability toeasily swap out different visual representations helps deepenunderstanding by illustrating the same mathematical concepts from many different visual perspectives. Evolution of collections. Existing collections of diagramscan easily be improved and modified to meet the needs ofa target platform, e.g. desktop vs. mobile, different printingprocesses, or different language localizations. Large-scale generation. It becomes easy to generate largecollections of illustrations to explore an idea, or to accompany,say, randomly-generated homework exercises.Beyond describing the implementation of Penrose, the purposeof this paper is to explore the general challenge of designing systemsfor diagram generation. We hence start with a discussion of goalsand trade-offs that inform our system design (Sec. 2). Readers mayalso find it helpful to periodically refer to the more detailed butpurely descriptive account of the system given in Sec. 3 and Sec. 4.2SYSTEM DESIGN“One must be able to say at all times—instead of points,straight lines, and planes—tables, chairs, and beer mugs.”—David HilbertOur aim is to build a system for converting abstract mathematicalideas into visual diagrams. Choices about system design are guidedby several specific goals, many of which are supported by interviewswe did with users of diagramming tools [Ma’ayan et al. 2020]:(1) Mathematical objects should be expressed in a familiar way.(2) The system should not be limited to a fixed set of domains.(3) It should be possible to apply many different visualizationsto the same mathematical content.(4) There should be no inherent limit to visual sophistication.(5) It should be fast enough to facilitate an iterative workflow.(6) Effort spent on diagramming should be generalizable andreusable.To achieve these goals, we take inspiration from the way diagramsare often drawn by hand. In many domains of mathematics, eachtype of object is informally associated with a standard visual icon.For instance, points are small dots, vectors are little arrows, etc. Toproduce a diagram, symbols are systematically translated into icons;a diagrammer then works to arrange these icons on the page in aACM Trans. Graph., Vol. 39, No. 4, Article 144. Publication date: July 2020.coherent way. We formalize this process so that diagrams can begenerated computationally, rather than by hand. Specifically,The two organizing principles of Penrose are:(i) to specify diagrams via a mapping from mathematicalobjects to visual icons, and(ii) to synthesize diagrams by solving an associated constrained optimization problem.Just as the occupant of Searle’s “Chinese room” does not actuallyunderstand a foreign language [Cole 2014], a system designed thisway need not perform deep reasoning about mathematics—it simplydoes a translation. We hence do not expect our system to solve allchallenges of diagramming. Users are still responsible for, say, choosing meaningful notation for a mathematical domain, inventing a useful visual representation of that domain, and ensuring that diagrams correctly communicate meaning.Likewise, a system cannot be expected to solve hard computationalor mathematical problems (e.g., the halting problem or Fermat’s lasttheorem) in order to construct diagrams. Yet despite this shallowlevel of reasoning, Penrose is able to generate quite sophisticateddiagrams. In fact, even in the absence of such reasoning, naïvevisualization often provides useful observations (Fig. 2).The resulting system effectively models diagram genera- Set A, Btion as a compilation process, Point pwhere the compilation target A Bis a constrained optimization p Aproblem rather than (say) a bi- p Bnary executable or a static image. Once compiled, this problem can be used and reused Fig. 2. An optimization-based approachto generate visual diagrams; has myriad benefits. Here a logically inFig. 3 illustrates the high-level consistent program fails gracefully, prosystem flow. From a program- viding visual intuition for why the givenming language point of view, statements cannot hold.a mapping expressed in this framework defines an executable visualsemantics. That is, it gives a specific, visual, and computable interpretation to what were previously just abstract logical relationships.source imizationproblemnumericalsolver.STY.STY .STY(interchangeable)diagramsFig. 3. High-level pipeline: a compiler translates mathematical statementsand a chosen visual representation into a constrained optimization problem.This problem is then solved numerically to produce one or more diagrams.
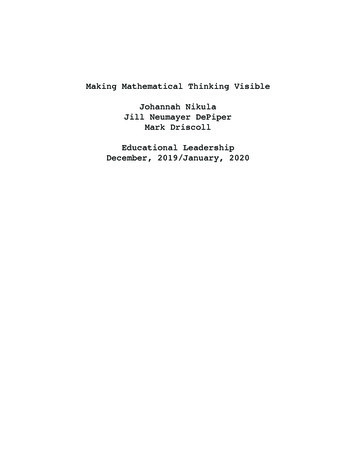
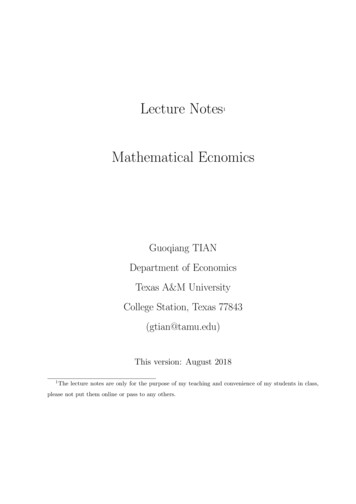
Penrose: From Mathematical Notation to Beautiful Diagrams 144:3Fig. 6. One benefit of a unified framework is that different domains are easily combined. Here, two existing packages (for meshes and set theory) were combined to illustrate that a simplicial complex(left) is closed with respect totaking subsets (right).PathType tHasForm(t,"L(D S)S*E")Path p : Sample(t)Fig. 4. By specifying diagrams in terms of abstract relationships rather thanexplicit graphical directives, they are easily adapted to a wide variety of usecases. Here we use identical Penrose code to generate ray tracing diagramsfor several targets (Sec. 5.6). Though the arrangement and number of objectschanges in each example, the meaning remains the same.2.1Language-Based SpecificationA major decision in Penrose is to use programming languagesto specify both mathematical objects (Sec. 2.1.2) and their visualrepresentation (Sec. 2.1.3). Graphical (e.g., sketch-based) specification would demand that users already know how to visualizeabstract ideas, and it ties mathematical content to one specific visual representation, which conflicts with Goal 3. A language-basedspecification provides the level of abstraction needed to separatecontent from visualization. This technique supports Goal 1, sincelanguage is the most common means by which mathematical ideasare expressed. From a system design point of view, a language-basedencoding provides a unified representation for identifying and transforming mathematical objects throughout the pipeline. Moreover,a language-based interface makes it easy for Penrose to providea platform on which other diagramming tools can be built (as inSec. 4.5 or Sec. 5.7). One trade-off is that a language-based approachrequires users to express themselves in formal mathematical or computational language, making it more difficult for (say) visual artistsand designers to contribute new representations.A secondary decision is to split specification of mathematicalcontent and visualization across two domain-specific languages:Substance and Style. A good analogy is the relationship betweenHTML [Berners-Lee and Connolly 1995], which specifies content,Fig. 5. Similar to the TEXecosystem, most users needonly use the Substance language, but can benefit frompackages written by moreexpert Domain and Styleprogrammers.Substance(typical users)Domain/Style(package developers)and CSS [Lie et al. 2005], which describes how it is rendered. Aschema called Domain (analogous to XML or JSON schemas) definesthe mathematical domain of interest, supporting Goal 2. In linewith Goal 3, this division allows the same styles to be reused fordifferent content, and likewise, the same content to be displayedin many different styles. Our goal is for this division to support anecosystem where novice users can benefit from packages written bymore experienced developers (Fig. 5). Finally, as in mathematics, theability to adopt user-defined, domain-specific notation (Sec. 2.1.1)enables efficient expression of complex relationships in a way thatis both concise and easy to understand [Kosar et al. 2012]. Encodingideas directly in the idiom of a problem domain often results inbetter program comprehension than (say) a sequence of library callsin a general-purpose language [Van Deursen et al. 2000]. We discussthe scope and limitations of our languages in Sec. 6.2.1.1 Mathematical Domain (Domain). One of our primary goals(Goal 2) is to build a unified system for diagramming, rather than tofocus on specific domains (as in, say, GraphViz [Ellson et al. 2004] orGroupExplorer [Carter and Ellis 2019]). A unified design enables objects from different domains to coexist in the same diagram, often bydoing little more than concatenating source files (Fig. 6). Moreover,effort put into (say) improving system performance or renderingquality is amortized across many different domains.Users can work in any area of mathematics by writing so-calledDomain schemas (Sec. 3.1) that define DSLs tailored to a given domain. This design also empowers users to adopt their own notationand conventions for modeling the domain. Use of domain- and userspecific notation reflects common practice in mathematical writing,where the meaning of a symbol is frequently overloaded dependingon context. Importantly, a Domain schema is purely abstract: it doesnot define an internal representation for objects, nor does it givedefinitions to functions or predicates. This level of abstraction iscrucial for Goal 3, since it allows multiple visual representations tolater be applied to objects from the same domain.2.1.2 Mathematical Content (Substance). To define the content ofa diagram, one must be able to specify (i) the objects in the diagram,and (ii) relationships among these objects. In line with Goal 1, Substance uses concise assertions that resemble standard mathematicalprose (see for example Fig. 7). Formally, it can model any domainexpressible in a compositional language of types, functions, andpredicates, which are the basic constructs found in conventionalmathematical notation [Ganesalingam 2013]. Just as definitions aretypically immutable in mathematics, Substance draws inspirationfrom strongly typed functional languages (such as ML [Milner et al.1997]) where objects are stateless. This choice also simplifies systemACM Trans. Graph., Vol. 39, No. 4, Article 144. Publication date: July 2020.
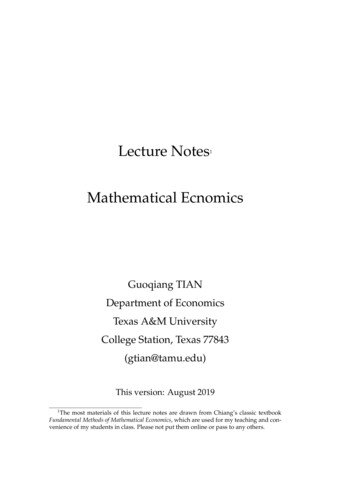
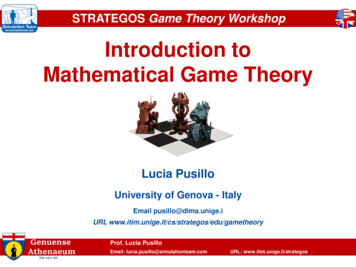
144:4 Ye et al.For any vector spaceX , let u, v X beorthogonal vectors ofequal length, and letw u v. Then u andw make a 45 angle.VectorSpace XVector u, v XOrthogonal(u, v)EqualLength(u, v)Vector w Xw : u vFig. 7. Extensibility enables users to adopt conventions and notation (center)that reflect the way they naturally write mathematical prose (left). Here,the resulting diagram (right) plays the role of the concluding statement.implementation, since the compiler can assume fixed definitions. Aconscious design decision, in line with Goal 3, is to exclude all graphical data (coordinates, sizes, colors, etc.) from Substance—since itssole purpose is to specify abstract relationships rather than quantitative data. All such data is instead specified in Style or determinedvia optimization. This division relieves users from the burden oftedious and repetitive graphics programming, which can instead befactored out into reusable Style code.Existing languages would be difficult to use in place of Substancesince they lack the semantics needed to encode complex logicalrelationships and do not provide language-level extensibility. Forinstance, TEX [Beeton and Palais 2016] and MathML [Miner 2005]markup provide only enough information to translate plain text intomathematical glyphs; computer algebra systems like Mathematicaand Maple have limited type systems or provide only a small set offixed predicates (e.g., asserting that a number is real). Conversely,the much richer languages used by automated theorem proversand proof assistants (such as Coq [Bertot and Castéran 2013] andLean [de Moura et al. 2015]) are overkill for simply specifying diagrams. A custom language provides simple, familiar syntax andclear error messages. We do however adopt some ideas from Coq,such as the ability to customize syntactic sugar (Sec. 3.1).2.1.3 Mathematical Visualization (Style). The meaning of a diagram is largely conveyed by relative relationships rather than absolute coordinates. Moreover, diagrams are often underconstrained:relationships needed to convey the intended meaning determine afamily of possible solutions, rather than a single unique diagram.Style hence adopts a constraint-based approach to graphical specification in the spirit of Sketchpad [Sutherland 1964]: diagrams arebuilt up from hard constraints that must be satisfied and soft penalties that are minimized (Sec. 3.3.6), then unspecified quantities aresolved for via numerical optimization (Sec. 4). Though proceduraldefinitions can still be used, the programmer need not provide absolute coordinates (as in imperative languages like PostScript orOpenGL). Though an implicit specification can make output hardto predict, part of the allure of Penrose is the potential to findinteresting or surprising examples. Moreover, the approach yieldsmore concise code; for instance, Style programs are much shorterthan the SVG files they produce.An alternative design might be to use an application programminginterface (API), though historically APIs have been eschewed forspecification languages for good reason. Language provides far moreACM Trans. Graph., Vol. 39, No. 4, Article 144. Publication date: July 2020.optimizingFig. 8. An optimization-based approach makes it possible to jointly optimizevisual attributes that are difficult to coordinate by hand. Here for instancewe optimize color contrast according to the spatial proximity of adjacentdisks (left to right), ultimately discovering a two-color solution (far right).The system can also be used to debug the optimization process itself—inthis case by drawing the hue of each disk as a dot on a color wheel.concise expression of complex relationships—imagine styling an entire website via the DOM API’s getElementById() and setStyle()methods, versus a few short lines of CSS. Visual programming languages (like LabView [Elliott et al. 2007] or Grasshopper [McNeelet al. 2010]) might suffice for basic specifications (e.g., vectors shouldbe drawn as arrows), but don’t scale to more complex concepts thatare easily expressed via language [Burnett et al. 1995].A key design challenge is identifying objects that appear in aSubstance program. Objects in a given mathematical universe aredistinguished not only by their type, but also by their relationshipsto other objects. A widely-used mechanism for specifying suchrelationships is through CSS-like selectors. Style adopts a similarmechanism that performs pattern matching on the types, functions,and predicates appearing in a Domain schema (Sec. 3.3.1).2.2Optimization-Based SynthesisThe second major design decision in Penrose is to use constrainedoptimization to synthesize diagrams satisfying a given specification(Sec. 4). This approach is again inspired by how people often drawdiagrams by hand (e.g., using GUI-based tools): visual icons areplaced on a canvas and iteratively adjusted until no further improvements can be made. In difficult scenarios, a diagrammer may tryseveral global arrangements before refining the final design, thoughtypically no more than a few. Automating this process makes it easyto perform layout tasks that would be tedious by hand (Fig. 8).There are good reasons to believe that an optimization-basedapproach can scale to very complex diagrams. First, attractive diagrams need not be optimal in a global sense—they should simply notpermit obvious local improvements, such as text that could easilybe moved closer to the item it labels. In fact, disparate local minima can provide useful examples that help build intuition (Fig. 9).Second, even sophisticated diagrams have surprisingly few degreesof freedom in comparison to many modern optimization problems(e.g., tens or hundreds, versus thousands or millions). Finally, strategies employed by expert diagrammers can be applied to managecomplexity, such as independently optimizing small components ofa diagram (akin to nonlinear Gauss-Seidel), rather than optimizingall degrees of freedom simultaneously.
Penrose: From Mathematical Notation to Beautiful Diagrams 144:5or Style program or directly generate static graphical content, sincesuch plugins would abandon the benefits that Penrose provides,such as the ability to re-style content and avoid use of absolutecoordinates. Fig. 4 illustrates how a simple plugin can make use ofSubstance and Style information to create “responsive” diagrams.2.4Fig. 9. A language-based design makes it easy to build tools on top ofPenrose that provide additional power. Here we use standard techniquesfrom program synthesis (Sec. 5.7) to automatically enumerate how thegiven relationships can be realized. Generating such examples helps to seeimportant corner cases that might be missed when drawing diagrams byhand (where perhaps the top-left diagram most easily comes to mind).In line with Goals 2 and 3, an optimization-based approach canbe applied generically and automatically for any user-defined domain and visual representation, without requiring programmersto think about the details of the layout process. In our system, theoptimization problem is defined using common-sense keywords(Sec. 3.3.6) in Style and chaining together basic operations (e.g.,arithmetic). Since the diagram specification is divorced from thedetails of the solver, optimization strategies can be changed andimproved in future versions of the system while preserving compatibility with existing code. The main cost of an optimization-basedapproach is that it puts demands on system design “upstream”: allexpressions used to define a visual style must be differentiable. Asdiscussed in Sec. 4.2, these requirements are largely satisfied viastandard techniques (e.g. by using automatic differentiation).In general, diagram optimization is a challenging problem in itsown right, which we of course do not aim to solve conclusivelyin this paper. Currently, we just use a generic constrained descentsolver (Sec. 4.2). However, we have been pleased to find that thissimple approach handles a wide variety of examples from differentdomains without requiring domain-specific strategies.2.3PluginsThe final design decision in Penrose is to provide system-levelextensibility via a plugin interface for calling external code in Substance and Style. Providing a plugin system is essential to enableusers to integrate external code that is specialized to solve particularlogical or graphical challenges. In fact, such interfaces for integrating external code are already provided by many systems (e.g., TEX,Adobe Illustrator, and TikZ’s plugin system for graph layout algorithms [Ellson et al. 2001]). The interface for Penrose plugins isdesigned to define a clear and simple boundary between the Penrose system and the plugin while enabling each component to focuson its strengths. A plugin can analyze and augment the set of abstract objects defined in Substance as well as analyze and augmentthe numerical information in Style. This simple interface allowsplugins to be written in any language (or repurposed from other systems) and operate independently from the implementation details ofPenrose. However, a plugin cannot change an existing SubstanceRelated SystemsHere we consider how our system design relates to other systemsthat convert abstract mathematical ideas into visual diagrams. Otherclasses of tools, such as general-purpose drawing tools (e.g., AdobeIllustrator) can also be used to make diagrams, though one quicklyruns into barriers, such as for large-scale diagram generation orevolving the style of a large collection of existing diagrams. Abroader discussion of related work can be found in a pilot study wedid on how people use diagramming tools [Ma’ayan et al. 2020].There are three main kinds of systems that convert an abstractform of input (e.g., an equation or code) into a visual representation.Language-based systems, such as TikZ [Tantau [n. d.]] (which buildson TEX), are domain-agnostic and provide significant flexibility forthe visual representation. Their use of “math-like” languages influenced the design of Substance. However, existing systems do notaim to separate mathematical content from visual representation.For instance, TikZ is domain- and representation-agnostic becauseit requires diagrams to be specified at a low level (e.g., individualcoordinates and styles) making programs hard to modify or reuse.Moreover, since there are only shallow mathematical semantics, itbecomes hard to reason about programs at a domain level.Plotting-based systems, like Mathematica and GeoGebra [Hohenwarter and Fuchs 2004] enable standard mathematical expressionsto be used as input and automatically generate attractive diagrams.Just as a graphing calculator is easy to pick up and use for moststudents of mathematics, these tools inspired us to provide a “tiered”approach to Penrose that makes it accessible to users with lessexpertise in illustration (Fig. 5). However, much like a graphingcalculator, the visual representations in these systems are largely“canned,” and the set of easily accessible domains is largely fixed.For instance, Mathematica does not permit user-defined types, andto go beyond system-provided visualization tools, one must providelow-level directives (in the same spirit as tools like TikZ).Finally, systems like graphviz [Ellson et al. 2004], and GeometryConstructions Language [Janičić 2006] translate familiar domainspecific language into high-quality diagrams. Here again, the domains are fairly narrow and there is little to no opportunity to expand the language or define new visualizations. Yet the convenienceand power of such systems for their individual domains inspired usto build a system with greater extensibility. More broadly, while allthese systems share some design goals with ours, a key distinctionis that Penrose is designed from the ground up as an extensibleplatform for building diagramming tools, rather than a monolithicend-user tool.3LANGUAGE FRAMEWORKThe Penrose language framework comprises three languages thatplay different roles:ACM Trans. Graph., Vol. 39, No. 4, Article 144. Publication date: July 2020.
Ye et al. A Domain schema declares the objects, relationships, andnotation available in a mathematical domain. A Substance program makes specific mathematical assertions within some domain. A Style program defines a generic mapping from mathematical statements in some domain to a visual representation.A package consisting of a Domain, and one or more compatibleStyle programs, can be used to illustrate Substance programs froma given domain (Fig. 3). Though some starter packages are providedfor the examples discussed in Sec. 5, the real power of Style andDomain is that they enable Penrose to be easily extended. In thissection we illustrate these languages via the running example of alinear algebra package (Figures 10 through 12). Formal grammarsfor the three languages are given in supplemental material.3.1type Scalar, VectorSpace, Vector-- LinearAlgebra.dslfunction add: Vector * Vector - Vectorfunction norm: Vector - Scalarfunction scale: Scalar * Vector - Vector.predicate In: Vector * VectorSpacepredicate Unit: Vectorpredicate Orthogonal: Vector * Vector.notation "v1 v2" "add(v1,v2)"notation " y1 " "norm(y1)"notation "s * v1" "scale(s,v1)"notation "Vector v V" "Vector a; In(a,U)"notation "v1 v2" "Orthogonal(v1,v2)".The Domain SchemaA Domain schema describes a domain of mathematics by definingthe objects and notation that can be used by associated Substanceand Style programs. A partial example for linear algebra is shownin Fig. 10 (the full schema is provided in supplemental material). Thetype lines define the available object types, function lines definethe domain and codomain for the set of available functions (where* denotes a Cartesian product), and predicate lines define thepossible relationships among objects, including unary predicates.Importantly, a Domain schema is purely abstract: it does not definea specific representation for objects, nor does it define bodies forfunctions or predicates. For instance, we do not say here that a vectoris encoded by a list of coordinates, nor do we write an additionoperation on such coordinates. A co
user-defined in a constraint-based specification language; diagrams are then generated automatically via constrained numerical optimization. The sys-tem is user-extensible to many domains of mathematics, and is fast enough for iterative design exploration. In contrast to tools that specify diagrams