Transcription
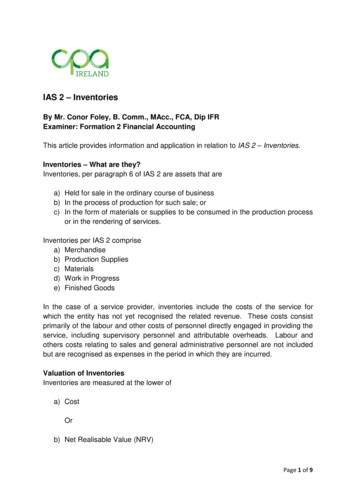
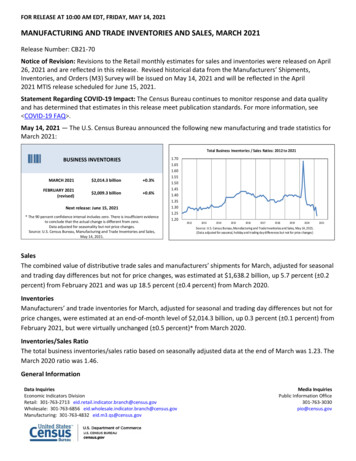
FOR RELEASE AT 10:00 AM EDT, FRIDAY, MAY 14, 2021MANUFACTURING AND TRADE INVENTORIES AND SALES, MARCH 2021Release Number: CB21-70Notice of Revision: Revisions to the Retail monthly estimates for sales and inventories were released on April26, 2021 and are reflected in this release. Revised historical data from the Manufacturers’ Shipments,Inventories, and Orders (M3) Survey will be issued on May 14, 2021 and will be reflected in the April2021 MTIS release scheduled for June 15, 2021.Statement Regarding COVID-19 Impact: The Census Bureau continues to monitor response and data qualityand has determined that estimates in this release meet publication standards. For more information, see COVID-19 FAQ .May 14, 2021 — The U.S. Census Bureau announced the following new manufacturing and trade statistics forMarch 2021:Total Business Inventories / Sales Ratios: 2012 to 2021BUSINESS INVENTORIESMARCH 2021 2,014.3 billion 0.3%FEBRUARY 2021(revised) 2,009.3 billion 0.6%Next release: June 15, 2021* The 90 percent confidence interval includes zero. There is insufficient evidenceto conclude that the actual change is different from zero.Data adjusted for seasonality but not price changes.Source: U.S. Census Bureau, Manufacturing and Trade Inventories and Sales,May 14, 012201320142015201620172018201920202021Source: U.S. Census Bureau, Manufacturing and Trade Inventories and Sales, May 14, 2021.(Data adjusted for seasonal, holiday and trading day differences but not for price changes)SalesThe combined value of distributive trade sales and manufacturers’ shipments for March, adjusted for seasonaland trading day differences but not for price changes, was estimated at 1,638.2 billion, up 5.7 percent ( 0.2percent) from February 2021 and was up 18.5 percent ( 0.4 percent) from March 2020.InventoriesManufacturers’ and trade inventories for March, adjusted for seasonal and trading day differences but not forprice changes, were estimated at an end-of-month level of 2,014.3 billion, up 0.3 percent ( 0.1 percent) fromFebruary 2021, but were virtually unchanged ( 0.5 percent)* from March 2020.Inventories/Sales RatioThe total business inventories/sales ratio based on seasonally adjusted data at the end of March was 1.23. TheMarch 2020 ratio was 1.46.General InformationData InquiriesEconomic Indicators DivisionRetail: 301-763-2713 eid.retail.indicator.branch@census.govWholesale: 301-763-6856 ring: 301-763-4832 eid.m3.qs@census.govMedia InquiriesPublic Information Office301-763-3030pio@census.gov
The April 2021 Manufacturing and Trade Inventories and Sales Report is scheduled for release on June 15,2021. View the full schedule in the Economic Briefing Room: www.census.gov/economic-indicators/ .EXPLANATORY NOTESReliability of EstimatesThe sampling variability for retailers and merchant wholesalers can be used to construct a 90 percentconfidence interval for the estimates. Over all possible samples, 90 percent of such intervals will cover thetrue estimate. These intervals are given in parentheses for the estimates on the front page. If, for example, theestimate is up 0.8 percent and the margin of sampling error is 1.2 percent, the 90 percent confidence intervalis -0.4 percent to 2.0 percent. If the range contains 0, it is uncertain whether there was an increase ordecrease. Measures of reliability for Retail and Wholesale sales and inventory levels and changes are includedin the detailed monthly press releases for those Industries. Manufacturers do not contribute to estimates ofsampling variability because the manufacturer’s mail panel is not a probability sample from a known frameand standard errors of the industry estimates cannot be calculated. Estimates from all three surveys are alsosubject to nonsampling errors, which can arise in any stage of the survey. Such errors include coverage error(failure to accurately represent all population units in the sample) response errors, coding errors, andnonresponse. Although no direct measurement of these errors has been obtained, precautionary steps weretaken in all phases of the collection, processing, and tabulation of the data to minimize their influence.Description of the SurveyThe Manufacturing and Trade Inventories and Sales estimates are based on data from three surveys: theMonthly Retail Trade Survey, the Monthly Wholesale Trade Survey, and the Manufacturers’ Shipments,Inventories, and Orders Survey. Data for the wholesale and manufacturing sectors are unrevised from themost recent Monthly Wholesale Trade Report and the Full Report on Manufacturers’ Shipments, Inventoriesand orders. Data from the Retail sector is revised and presented in more detail from the most recent AdvanceEconomic Indicators Report. For more information on these surveys see the links below: www.census.gov/retail/ , www.census.gov/wholesale/ , and www.census.gov/manufacturing/m3/ .RESOURCESAPIThe Census Bureau’s application programming interface lets developers create custom apps to reach newusers and makes key statistics more accessible than ever before. www.census.gov/developers/ FRED Mobile AppReceive the latest updates on the nation’s key economic indicators by downloading theFRED App https://fred.stlouisfed.org/fred-mobile/ for both Apple and Androiddevices. FRED, the signature database of the Federal Reserve Bank of St. Louis, nowincorporates the Census Bureau’s 13 economic indicators.Data InquiriesEconomic Indicators DivisionRetail: 301-763-2713 eid.retail.indicator.branch@census.govWholesale: 301-763-6856 ring: 301-763-4832 eid.m3.qs@census.govMedia InquiriesPublic Information Office301-763-3030pio@census.gov
###* The 90 percent confidence interval includes zero. There is insufficient evidence to conclude that the actual change is different from zero.Data InquiriesEconomic Indicators DivisionRetail: 301-763-2713 eid.retail.indicator.branch@census.govWholesale: 301-763-6856 ring: 301-763-4832 eid.m3.qs@census.govMedia InquiriesPublic Information Office301-763-3030pio@census.gov
Table 1. Estimated Monthly Sales and Inventories for Manufacturers, Retailers, and Merchant Wholesalers(In millions of dollars)SalesInventoriesInventories/Sales RatiosMar. 2021Feb. 2021Mar. 2020Mar. 2021Feb. 2021Mar. 2020Mar. 2021Feb. 2021Mar. 2020(p)(r)(r)(p)(r)(r)(p)(r)(r)Adjusted1Total business ,7171.231.301.46Manufacturers² 1.46Retailers³ 1.52Merchant wholesalers⁴ 1.39Total business ,9821.181.451.42Manufacturers² 1.39Retailers³ 1.54Merchant wholesalers⁴ 1.35Not Adjusted(p) Preliminary estimate.(r) Revised estimate.Data adjusted for seasonality and trading day differences, but not price changes. Explanations of confidence intervals and sampling variability can be found onour website at www.census.gov/mtis/how surveys are collected.html .Source: U.S. Census Bureau, Manufacturing and Trade Inventories and Sales, May 14, 2021.Table 2. Percent Changes for Sales and Inventories ‐‐ Manufacturers, Retailers, and Merchant WholesalersAdjustedNot AdjustedSalesInventoriesInventoriesSalesMar. 21/Feb. 21/Mar. 21/Mar. 21/Feb. 21/Mar. 21/Mar. 21/Feb. 21/Mar. 21/Mar. 21/Feb. 21/Mar. 21/Feb. 21Jan. 21Mar. 20Feb. 21Jan. 21Mar. 20Feb. 21Jan. 21Mar. 20Feb. 21Jan. 21Mar. 20Total business acturers2 3 .8‐7.4Merchant wholesalers4 4.60.019.01.31.04.527.0‐2.122.71.20.34.7See footnotes and notes at the end of Table 3.Data adjusted for seasonality and trading day differences, but not for price changes. Explanations of confidence intervals and sampling variability can be found on our website at www.census.gov/mtis/how surveys are collected.html .Source: U.S. Census Bureau, Manufacturing and Trade Inventories and Sales, May 14, 2021.
Table 3. Estimated Monthly Retail Sales, Inventories, and Inventories/Sales Ratios, By Kind of Business(In millions of dollars)SalesInventories3Percent ChangeKind of BusinessNAICSCodeInventories/SalesIn InventoriesRatiosMar. 2021Feb. 2021Mar. 2020Mar. 2021Feb. 2021Mar. 2020Mar. 21/Feb. 21/Mar. 21/Mar. 21Feb. 21Mar. 20(p)(r)(r)(p)(r)(r)Feb. 21Jan. 21Mar. 085‐1.40.1‐7.41.101.231.52Total (excl. motor veh. & parts) 01.041.121.18Adjusted 1Retail trade, total 441Motor vehicle & parts dealers . 2.8‐27.31.301.623.10Furniture,home furn., elect. & appl. stores .451.87444Building materials, garden equip & supplies 1.671.73445Food & beverage stores . 0.730.59448Clothing & clothing access. stores . �12.91.932.384.78452General merchandise stores . 201.321.21Dept. strs. (excl. leased depts.) 0.91.762.012.47Retail trade, total . 8‐7.41.091.401.54Total (excl. motor veh. & parts) 21.041.271.20442,34521Not Adjusted441Motor vehicle & parts dealers . 2.5‐27.21.221.832.97Furniture,home furn., elect. & appl. stores .611.85444Building materials, garden equip & supplies 2.181.85445Food & beverage stores . .740.790.59448Clothing & clothing access. stores . .992.875.01452General merchandise stores .491.22Dept. strs. (excl. leased depts.) 02.422.65442,34521(p) Preliminary estimate.(r) Revised estimate.1Adjusted for seasonal variations, trading day differences and, in the case of sales, holiday variations. Concurrent seasonal adjustment is being used to adjust all sales, shipment and inventory estimates. Concurrent seasonaladjustment uses all available unadjusted estimates as input to the X‐13ARIMA‐SEATS program. The factors derived from the program are applied to the current and previous month estimates and for retail and wholesaleestimates a year ago as well. For retail sales, concurrent seasonal adjustment is also used to adjust the advance estimates (published one month before the preliminary estimates) and the estimates one year before the advancemonth. This explains the revision to retail estimates from a year ago.2Manufacturers sales refer to the value of shipments by manufacturers. The shipments data from individual manufacturers are adjusted prior to tabulation for the number of trading days as well as for any variations in the lengthof the reporting period.3Adjusted and not adjusted inventories for aggregate levels retail trade total, total excluding motor vehicles and parts, and motor vehicle and parts dealers are revised from the Advance Economic Indicators Report.4The 2012 North American Industry Classification System (NAICS) defines merchant wholesalers as including manufacturers' sales branches and offices. However, the estimates included in this release exclude manufacturers'sales branches and offices. Note that this is not a change in coverage from prior releases and is consistent with the description used in the Monthly Wholesale Trade Survey data products.Data adjusted for seasonality and trading day differences, but not price changes. Explanations of confidence intervals and sampling variability can be found on our website at www.census.gov/mtis/how surveys are collected.html .Source: U.S. Census Bureau, Manufacturing and Trade Inventories and Sales, May 14, 2021.
The total business inventories/sales ratio based on seasonally adjusted data at the end of March was 1.23. The March 2020 ratio was 1.46. General Information. BUSINESS INVENTORIES . MARCH 2021 2,014.3 billion 0.3% FEBRUARY 2021 (revised) 2,009.3 billion 0.6%: Next release: June 15, 2021 * The 90 percent confidence interval includes zero. There is insufficient evidence to conclude that the .