Transcription
Highlights from the Student Transi ons ProjectPost‐Secondary Student MobilityJanuary 2017What is Student Mobility?Within the context of B.C.’s higher educa on system,student mobility includes the sequen al or simultaneousenrollment of students in mul ple B.C. public post‐secondary ins tu ons at any me during their academicstudies. Within the global context, student mobility castsa much wider net to include a endance in mul ple post‐secondary se ngs anywhere in the world. Thisnewsle er focuses exclusively on student mobility withinthe B.C. system, among academic credit registrants only.1This mobility study was produced from thirteen years ofstudent enrollment data, spanning Fall 2002 to Fall 2015.Data was collected in Fall 2015 by the STP and wassubsequently assembled into 5.6 million mobile studentrecords describing the numerous educa on pathways ofeach student who entered, con nued, moved betweenand exited B.C. public post‐secondary ins tu ons eachyear. The number of mobile students in 2014/2015 was54,071. This is simply the number of students whoenrolled in an ins tu on in 2014/2015 that isdifferent from their previous ins tu on ofregistra on. The number of mobile students hasdeclined 5% since its peak of 57,109 in 2011/2012.[Pages 5‐6] The current student mobility rate (17%) is thepropor on of all academic credit registrants in theyear who followed a mobile pathway to theirins tu on of registra on in 2014/2015 (54,071 318,800). This rate has gradually declined from a highof 18.9% in 2008/2009 and this is likely due to post‐secondary ins tu on designa on changes and theopportuni es for students to earn a Bachelor’sdegree at any of B.C.’s 25 public post‐secondaryins tu ons. [Page 6] Sector mobility rates provide a measure of studentThis study was endorsed and reviewed by the Post‐secondary Student Mobility (PSM) sub‐commi ee of theStudent Transi ons Project (STP).mobility from each ins tu on type or sector in B.C.This includes mobile students who switchedins tu ons within the same or between differentins tu on types. In 2014/2015, registrants lastenrolled in B.C. colleges had higher mobility rates(33.6%) than students last enrolled in TIUs (27.7%),Ins tutes (25.4%) or RIUs (13.5%). Due to theflexibility and support of the B.C. College transfersystem, it is not surprising that students from B.C.colleges are more mobile that students in otherins tu on types. In the last few years, studentmobility rates have been declining in each sector; andcompared to a decade ago, student mobility rateshave shown the greatest decline at TIU’s. [Page 7]Brief Summary of Student Mobility in B.C.The STP con nues to develop and enhance a variety ofvisual and numeric approaches for describing andquan fying student mobility within the B.C. public post‐secondary system. An overview and summary of thesystem‐level student mobility facts are provided here.More details are also available on the STP web site andspecialized tools for ins tu on‐level data explora on areavailable on the secure STP Sharepoint site. The incoming student pathways of all 318,8002014/2015 students enrolled in academic credits canbe simplified into three main pathways: new students(24%), con nuing students at the same ins tu on(65%), and mobile students who switched ins tu ons(17%)2. [Page 5]1.In the most recent academic year (2014/2015), there were roughly318,800 students registered in academic credits, represen ng 75% of the426,000 total unique headcount students enrolled in B.C.’s 25 public post‐secondary ins tu ons. Interna onal students enrolled in academic studiesin B.C. public post‐secondary ins tu ons are included in B.C.’s studentmobility studies. Students in B.C. private post‐secondary ins tu ons, suchas Columbia College, Fraser Interna onal College, etc. are excluded.2.Mobile students can also be con nuing students at another ins tu on,thus the sum of percentages across the three pathways exceeds 100%.
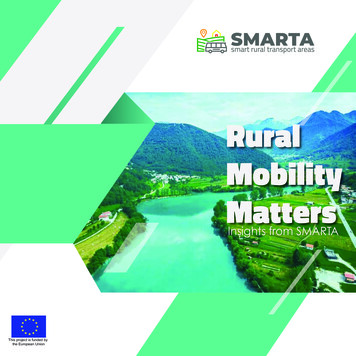
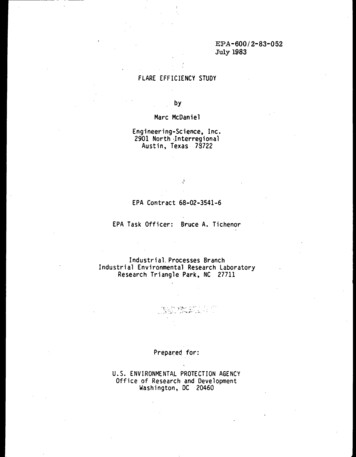
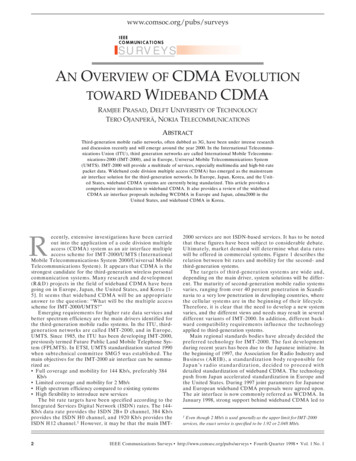
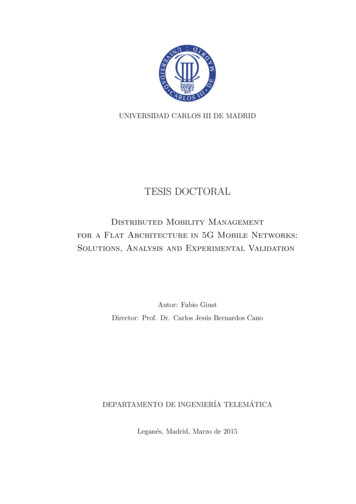
Student Transi ons Project Research Results Regional mobility rates provide a measure ofstudent mobility for each region of B.C. and includesall students who switched ins tu ons within thesame region or to a different region of B.C. In2014/2015, students from the Cariboo‐North (33.0%)and Thompson‐Okanagan‐Kootenays (30.0%) had thehighest mobility rates, as compared to VancouverIsland (22.5%) and Mainland/Southwest (21.3%).Student mobility rates for each region remainrela vely flat compared to a decade ago, but theThompson‐Okanagan‐Kootenays region has seen thegreatest drop in student mobility, down from 35.7%in 2003/2004. [Page 7]January 2017Figure 1: Sector Mobility Diagram (2014/2015)See larger image on page 8.Figure 2: Regional Mobility Diagram (2014/2015)See larger image on page 9. While the student mobility rates by sector and regionare useful indicators for comparing sectors andregions, the Student Mobility Diagrams (by sector andregion) provide a more comprehensive visualoverview of the number and direc on of studentsflowing between each of the B.C. ins tu on types andeach of the B.C. regions. [Pages 8 and 9]The Sector Mobility Diagrams (Figure 1) reveal thatthe most dominant pathways for students are: the tradi onal transfer pathway from B.C. collegesto research‐intensive universi es; the pathway from TIUs to all other ins tu ontypes; and the pathway from B.C. colleges and RIUs toins tutes.The Regional Mobility Diagrams (Figure 2) show aremarkable balance of student flows between each ofthe four regions of B.C. with roughly equal numbersof students entering each region in 2014/205 as thosewho le . The only significant excep on is the netinflow of 1,000 students into the Mainland‐Southwestregion from Vancouver Island.Figure 3: Network Diagram of Student Mobility in NorthernB.C. (2014/2015) Regional and sector mobility diagrams provide auseful visual of student mobility between and withinregions and sectors, but Network Diagrams of StudentMobility (Figure 3) can help to expand ourunderstanding of the student mobility that occursbetween ins tu ons within the same sector (20% ofstudent mobility) or within the same region (60%).[Pages 10 to 13]2 PageStudent Transitions Project
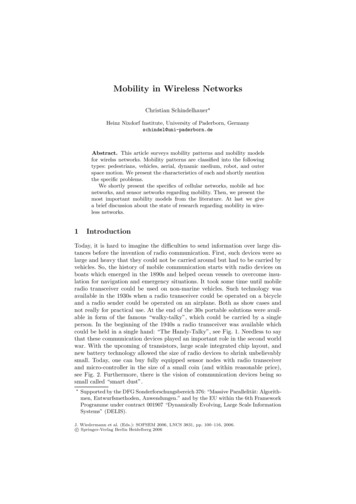
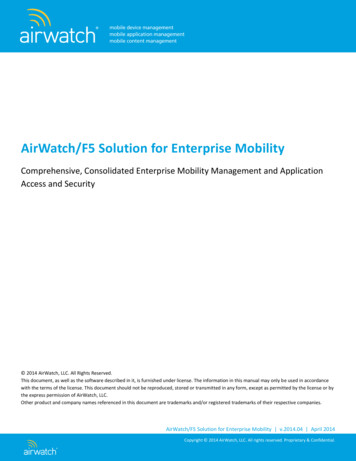
Student Transi ons Project Research Results Compared to student mobility diagrams that areuseful for showing the total volume of mobilestudents between sectors or regions, StudentPathways Diagrams (Figure 4) reveal the ming ofthe student mobility (either immediately or a er astop out period); and the type of student mobility(moving to a new ins tu on for the first me orreturning to an ins tu on previously a ended). Thesediagrams provide a visual and numeric descrip on ofthe numerous pathways or routes into and out of aB.C. public post‐secondary system, including new anddepar ng students, plus direct pathways from thepreceding me period (move, return, con nue) andindirect pathways occurring a er a stopout period(stopout move, stopout return, stopout con nue).Each of the different pathways diagrams have anunderlying summary table with the counts of studentsalong each pathway at the ins tu on level. Thesediagrams can also be provided for a specificins tu on, region or sector. [Page 14]January 2017transfer students is evident at each RIU, with theexcep on of SFU showing rela vely li le change.[Page 16] Looking at the Trends in Mobile Students from TIUsallows us to evaluate the impact of recent changes toins tu on designa ons, specifically the crea on ofTeaching‐Intensive Universi es (TIU’s). The number ofmobile students leaving TIUs and entering RIU’s hasdeclined by about 1,000 students since 2005/2006,perhaps sugges ng that students are staying at TIU’sto complete their creden al. [Page 17]Figure 4: Student Pathways DiagramSee larger image on page 14. The student mobility and student pathways diagramsprovide very detailed student mobility informa onfrom one year to the next, whereas a 3‐YearRegistra on State Sankey Diagram (Figure 5)provides a simple visual display of the rela ve volumeof students flowing between different registra onstates (new, registered, not registered, stopout,mobile) over a longer (three‐year) period, from2012/2013 to 2014/2015. The most dominant studentflow is the con nued registra on from one year tothe next, as depicted by its wide flow pa ernthroughout the Sankey diagram. [Page 15]Figure 5: Three‐Year Registra on State Sankey DiagramSee larger image on page 15. A long‐standing interest exists in B.C. to track andquan fy the subset of mobile students who transferfrom B.C. colleges to research‐intensive universi es(see inset box for a Brief History on page 5). Thisgroup of mobile students that we now call Tradi onalTransfer Students3 currently totals roughly 4,200students in 2014/2015, down from annual transfervolumes in excess of 5,000 students per year a decadeago4. A visual display of the system‐wide andins tu on‐level transfer student trends shows thatSFU receives the largest share of tradi onal transferstudents each year. A general downward trend in3 Page3. Tradi onal transfer students transferred from B.C. Colleges, Ins tutes andTeaching‐Intensive Universi es to Research‐Intensive Universi es with a mini‐mum of 24 credits and a cumula ve GPA of at least 2.00 with a basis of admis‐sion “B.C. College” or “B.C. Associate Degree”.4. The basis of admission (BOA) category is used to iden fy tradi onal collegetransfer students entering BC research‐intensive universi es. The STP2015data used in this analysis includes submissions to the STP from UBCV and UB‐CO with a greater share of BOA ”other” and smaller share of BOA ”BC Col‐lege” than previously submi ed for the same me period – students enteringUBCO/UBCV from TIU’s from 2006/2007 onward were assignedBOA "university transfer" in UBC's student system (and submi ed to STP withBOA "other") instead of BOA "BC College". Therefore, the total number oftradi onal transfer students reported in this newsle er is lower than previous‐ly reported for the same me period, up to and including 2012/2013.Student Transitions Project
Student Transi ons Project Research ResultsConclusionThe STP’s Post‐Secondary Student Mobility studies areconducted annually or biennially, depending uponproject priori es. While the STP’s methodology fortracking student movement between ins tu ons hasevolved over me, the STP’s goal is to providemeaningful and useful informa on to our stakeholders inorder to support the management and planning ofprograms in B.C. post‐secondary system and ul matelysa sfy the educa on needs of our students.The Student Transi ons Project is Bri sh Columbia'scollabora ve research project that measures studentsuccess from the K‐12 to post‐secondary systems. Thiseffec ve system‐wide partnership, involving B.C.'seduca on and advanced educa on ministries and post‐secondary ins tu ons, is tracking student success byrepor ng on student transi on rates to post‐secondaryeduca on, student mobility among post‐secondaryins tu ons, and post‐secondary comple on and reten onrates.Special Thanks: The STP would like to thank the Ministryof Educa on, the Ministry of Advanced Educa on and theB.C. public post‐secondary ins tu ons for collabora ng inthis research effort. Without their co‐opera on and datacontribu ons, this research could not have beenaccomplished.Where to find more informa on: Addi onal informa onis also available to post‐secondary ins tu ons seekingmore detailed informa on on student transi ons specificto their region or ins tu on.STP Highlights newsle ers and reports are available on thepublic Student Transi ons Project web site at:http://www.aved.gov.bc.ca/student transitionsResearch Results Prepared by Joanne Heslop, Manager,Student Transi ons Project4 PageJanuary 2017Post‐Secondary StudentMobility (PSM)Sub‐commi ee of STP:This post‐secondary studentmobility research wasconducted under the auspicesof the Student Transi onsProject (STP). The mobilityanalysis and this newsle erwas prepared by JoanneHeslop with researchdirec ons provided by thePost‐secondary StudentMobility Sub‐commi ee ofSTP. The sub‐commi eemembership includesrepresenta ves from acrosspost‐secondary sectors.Robert Adamoski, AssociateDirector, Admissions andResearch, BCCAT (Chair)Frank DiPuma, Manager,Ins tu onal Research, CapilanoUniversityKeith Ellis, Director, Ins tu onalResearch & Planning, DouglasCollegeJoanne Heslop, Manager, StudentTransi ons ProjectHugh Judd, Central DataWarehouse Coordinator,Research and Analysis, Ministryof Advanced Educa onZareen Naqvi, Director,Ins tu onal Research andPlanning, Simon FraserUniversityAnna Tikina, Research Officer,BCCAT.Where to Find More Informa on Brief Summary of Student Mobility in B.C. About the STP and the Post‐Secondary StudentMobility Sub‐commi ee of the STP Student Pathways Into B.C. Public Post‐SecondaryRegistra on in 2014/2015 Declining Trend in Mobile Students & StudentMobility Rate Mobility Rates by Sector or Region of Origin List of B.C. Public Post‐Secondary Ins tu ons byIns tu on Type and by RegionPage1‐445678‐9 Student Mobility Between Ins tu on Types8 Student Mobility Between Regions of B.C.9 Mobile Students Within the Same Region10‐11 Mobile Students Within the Same Ins tu on Type12‐13 Student Pathways Diagrams14 Defini ons14 Following Student Flows Over a Mul ‐Year Period15 Tradi onal Transfer Students16 Trends in Mobile Students from TIUs17Student Transitions Project
Student Transi ons Project Research ResultsJanuary 2017Describing and Quan fying Student Mobility in Bri sh Columbia in More DetailStudent Pathways into B.C. Public Post‐SecondaryRegistra on in 2014/2015There were roughly 318,800 students registered inacademic credits in B.C.’s 25 public post‐secondaryins tu ons in 2014/2015. Where did these studentscome from? (See Figure 6) 66% were con nuing students at the same ins tu onwhere they last registered, including 59% who lastregistered in 2013/2014, and 6% who last registered in2012/2013 or earlier (a er stopping out in theprevious year or longer).Brief History of Student Mobility StudiesFor many years, the B.C. Council on Admissions and Transfer(BCCAT) conducted collabora ve research studies with the B.C.Colleges and B.C. universi es to help quan fy and predict thenumber of students transferring from B.C. colleges to B.C.universi es.In 2008, a er the crea on of the STP data sharing agreementand database, the STP was invited to prepare student mobilitystudies from the robust new STP data set. The study resultsand subsequent evolu on and enhancements to these STPmobility studies have enlightened and broadened theprovincial perspec ve on student mobility. We now have abe er understanding that students frequently move in alldirec ons between all types of post‐secondary ins tu ons inB.C. 24% were new to the B.C. system, of which roughlyhalf (38,000 students) were former students fromB.C.’s K‐12 system, including 33,000 grade 12graduates and 5,000 non‐graduates; and the other half(39,000) had no previous history5 in the B.C. K‐12system. 17% were mobile students, including 11% who werelast registered in the previous year, and 6% who lastregistered prior to 2013/2014, a er stopping out for atleast one year. These students followed at least one offour possible mobile pathways: 6% moved from one ins tu on to a new ins tu onthey never a ended previously; 5% returned to an ins tu on previously a ended,a er last registering elsewhere; 4% moved from one ins tu on to another, a er astop out period; and 1% returned to a previously a ended ins tu ona er a stop out period.Note that students may a end mul ple ins tu ons in ayear, either simultaneously or sequen ally, thus crea ngmul ple pathways in a single year.Figure 6: Pathways to Post‐Secondary Registra on in 2014/20155.New students to the B.C. public post‐secondary system without any previous B.C. K‐12 enrollment history includes: (a) students without a Personal Educa onNumber (PEN), (b) students who graduated from the BC K‐12 system before 1991, and (c) students who graduated outside of B.C., such as students from otherCanadian provinces and interna onal students who graduated in another country.5 P a g eStudent Transitions Project
Student Transi ons Project Research ResultsJanuary 2017Declining Trend in Mobile Students & Student Mobility RateThe B.C. public post‐secondary system has seen an 18%growth rate in unique academic credit registrants overthe last eight years, increasing from 269,000 in2006/2007 to 319,000 in 2014/2015. Over the sameme period the number of mobile students, or thosewho switched ins tu ons from one year to the next,increased to reach a peak of 57,019 in 2011/2012, butthen declined 5% over the last three years to 54,071 in2014/2015.6The student mobility rate is the propor on of the totalunique headcount credit registrants who moved fromone ins tu on to another, or returned to a previouslya ended ins tu on, a er last enrolling elsewhere. Inthe most recent year for which data is available(2014/2015), the student mobility rate was 17.0% or(54,071 mobile students 318,800 unique academiccredit registrants).As shown in Figure 7, the rela vely stable studentmobility rate has remained around 17% to 18% eachyear, with roughly 50,000 to 55,000 students movingamong B.C. public post‐secondary ins tu ons annually.The student mobility rate provides a simple gauge ofstudent movement in the B.C. public post‐secondarysystem each year and minor annual fluctua ons in thisrate are expected. The gradual decline in the studentmobility rate is likely due to the numerous newopportuni es available to students to complete abachelor’s degree or other creden als at a singleins tu on, without the need to transfer elsewhere forcomple on.Figure 7: Student Mobility Trend (2006/2007 to 2014/2015)6.Each year, student enrollments are re‐stated and student mobility rates are recalculated from the latest enrollment submissions to the STP, thus ensuringconsistency with any updates or opera onal changes to student enrollment records. The final year reported here (2014/2015) excludes registrants with a laterstart date such that their mobility informa on is not captured yet. Any missing students will be included in next year’s repor ng cycle.6 P a g eStudent Transitions Project
Student Transi ons Project Research ResultsJanuary 2017Mobility Rates by Sector of OriginMobility Rates by Region of OriginAs shown in Figure 8 for recent 2014/2015 registrants,those who previously enrolled in a B.C. College had ahigher mobility rate (33.6%) than those last enrolled in aTIU (27.7%), ins tute (25.4%) or RIU (13.5%). The B.C.College transfer system encourages and facilitatestransfer from colleges, thus it is expected that B.C.Colleges would have the highest mobility rate. Themobility rate is declining in each of the sectors, althoughnot as sharply among students origina ng in research‐intensive universi es (see Figure 9).Students last enrolled in the Cariboo‐North (33.0%) andThompson‐Okanagan‐Kootenays (30.0%) had the highestmobility rates in 2014/2015, as compared to studentsfrom Vancouver Island (22.5%) and Mainland/Southwest(21.3%) (see Figure 10)8. In terms of regional trends,student mobility rates are declining in the Thompson‐Okanagan‐Kootenays, but remain rela vely unchanged inthe Cariboo‐North and Vancouver Island regions.Mainland/Southwest mobility has declined slightly overthe last seven years, but remains rela vely unchangedfrom 2003/2004 (see Figure 11).Figure 8: Mobility Rates by Sector of Origin, 2014/2015Figure 10: Mobility Rates by Region of Origin, 2014/2015Figure 9: Mobility Rate Trends by Sector of OriginFigure 11: Mobility Rate Trends by Region of Origin7. Mobility rates by sector of origin are a ra o of mobile students in the sector of origin to all con nuing academic credit registrants (excluding new students in thedes na on sector). Comparable mobility rates by sector of des na on (including new students) are 24.9% at ins tutes, 21.8% at colleges, 18.0% at TIU’s and11.2% at RIUs. The 2014/2015 overall mobility rate of 17.0% is a ra o of all mobile students to all academic credit registrants in 2014/2015 (including newstudents).8. Mobility rates by region of origin are a ra o of mobile students in the region of origin to all con nuing academic credit registrants (thus excluding new students).Comparable mobility rates by region of des na on (including new students) are 24.4% in Cariboo‐North, 22.9% in Thompson‐Okanagan‐Kootenays, 16.5% inMainland/Southwest and 15.4% in the Vancouver Island region. The 2014/2015 overall mobility rate of 17.0% is a ra o of all mobile students to all academiccredit registrants in 2014/2015 (including new students).7 PageStudent Transitions Project
Student Transi ons Project Research ResultsJanuary 2017Student Mobility Between Ins tu on TypesFigure 12: Student Mobility Between Ins tu ons and Sectors in the B.C. Public Post‐Secondary System (2014/15)9Post‐Secondary Ins tu ons by Ins tu on TypeB.C.’s public post‐secondary ins tu ons belong to one of four ins tu ontypes or sectors, as defined by the Ministry of Advanced Educa on.Ins tu on designa ons have changed over me and these are thecurrent groupings by ins tu on type. Any historical mobility informa onin this study assigns each ins tu on to its current ins tu on type, asdefined below.Nicola Valley InsƟtute of Technology in MerriƩIns tutes – Bri sh Columbia Ins tute of Technology, Jus ce Ins tute ofB.C., Nicola Valley Ins tute of Technology.Community Colleges – Camosun College, College of New Caledonia,College of the Rockies, Douglas College, Langara College, NorthIsland College, Northern Lights College, Northwest CommunityCollege, Okanagan College, Selkirk College, VancouverCommunity College.Research‐Intensive Universi es – Simon Fraser University, University ofBri sh Columbia, University of Bri sh Columbia Okanagan,University of Northern Bri sh Columbia, University of Victoria.Vancouver Community CollegeTeaching‐Intensive Universi es – Capilano University, Emily CarrUniversity of Art Design, Kwantlen Polytechnic University,Royal Roads University, Thompson Rivers University, Universityof the Fraser Valley, Vancouver Island University.9. Sector mobility diagrams also available on the public STP web site.8 PageStudent Transitions Project
Student Transi ons Project Research ResultsJanuary 2017Student Mobility Between Regions of B.C.Figure 13: Student Mobility Between Ins tu ons and Regions in the B.C. Public Post‐Secondary System (2014/15)10B.C. Public Post‐Secondary Ins tu ons by RegionB.C. public post‐secondary ins tu ons are located in urban and rural regionsof the province. For the purpose of tracking the mobility of students aroundthe province, the STP has assigned each of the post‐secondary ins tu ons toone of the following four geographic regions.Cariboo‐North Region – College of New Caledonia, Northern Lights College,Northwest Community College, University of Northern Bri sh Columbia.Mainland‐Southwest Region – Bri sh Columbia Ins tute of Technology,Capilano University, Douglas College, Emily Carr University of Art Design,Jus ce Ins tute of B.C., Kwantlen Polytechnic University, Langara College,Simon Fraser University, University of Bri sh Columbia, University of theFraser Valley, Vancouver Community College.Vancouver Island University in NanaimoThompson‐Okanagan‐Kootenay Region– College of the Rockies, Nicola ValleyIns tute of Technology, Okanagan College, Thompson Rivers University,Selkirk College, University of Bri sh Columbia (Okanagan).Vancouver Island Region – Camosun College, North Island College, Royal RoadsUniversity, University of Victoria, Vancouver Island University.University ofNorthern BriƟshColumbia inPrince George10. Regional mobility diagrams are also available on the public STP web site.9 PageStudent Transitions Project
Student Transi ons Project Research ResultsJanuary 2017Mobile Students Within the Same RegionA fair propor on, approximately 60% of student mobilityoccurs within the same region. The student flows ofmobile students between ins tu ons within the sameregion is provided in Figure 14a for 900 students whoremained in the Cariboo North region, 26,900 within theMainland/Southwest region, 2,200 from the Thompson‐Okanagan‐Kootenays and 3,700 within the VancouverIsland Region. These are best viewed with specialso ware. The width of the lines connec ng ins tu onsindicates a greater flow of students is occurring betweenthose ins tu ons. Line colors also vary depending uponthe type of des na on ins tu on.Figure 14a: Rela ve Volume of Mobile Students Switching Ins tu ons within the Same Region, 2013/2014 to 2014/20511Student Mobility within Cariboo North:Student Mobility within Thompson‐Okanagan‐Kootenays:Student Mobility within Vancouver Island:Student Mobility within Mainland/Southwest:There are 11 ins tu ons in this region, thus the informa on in this chart is not clear.See Figure 14b for mobility from each ins tu on type, within this region.11. (a) Student flow direc on is indicated by matching color of flow line to color of des na on node. (b) Thickness of lines between sectors indicate number ofmobile students between sectors. (c) Size of node indicates volume of students moving to the ins tu on from within the region.10 P a g eStudent Transitions Project
Student Transi ons Project Research ResultsJanuary 2017Figure 14b: Rela ve Volume of Mobile Students Switching Ins tu ons within the Lower Mainland Region, 2013/2014 to2014/20512Student Mobility within the Lower Mainland (From Colleges):Student Mobility within the Lower Mainland (From Ins tutes):Student Mobility within the Lower Mainland (From TIUs):Student Mobility within the Lower Mainland (From RIUs):12. (a) Student flow direc on is indicated by matching color of flow line to color of des na on node. (b) Thickness of lines between sectors indicate number ofmobile students between sectors. (c) Size of node indicates volume of students moving to the ins tu on from within the region.11 P a g eStudent Transitions Project
Student Transi ons Project Research ResultsJanuary 2017Mobile Students Within the Same Ins tu on TypeApproximately 20% of student mobility occurs within thesame sector, such as college to college or RIU to RIU, etc.The student flows of mobile students who remainedwithin the same sector or ins tu on type is provided inFigure 15a, including 4,000 students within the B.C.college sector, 1,800 within ins tutes, 2,700 betweenRIUs, and 3,300 who switched between TIUs. These arebest viewed with special so ware. The width of the linesconnec ng ins tu ons indicates a greater flow ofstudents is occurring between those ins tu ons.Figure 15a: Rela ve Volume of Mobile Students Switching Ins tu ons within the Same Sector, 2013/2014 to 2014/205College to College Mobility:Ins tute to Ins tute Mobility:There are 11 colleges in the province, thus the informa on in this chart is not clear.See Figure 15b for mobility between colleges within each of the four regions.RIU to RIU Mobility:12 P a g eTIU to TIU Mobility:Student Transitions Project
Student Transi ons Project Research ResultsJanuary 2017Figure 15b: Rela ve Volume of Mobile Students Switching Ins tu ons within the College Sector, 2013/2014 to 2014/20512College to College Mobility within theCariboo North Region:College to College Mobility within theThompson‐Okanagan‐Kootenay Region:College to College Mobility within theVancouver Island Region:College to College Mobility within theMainland/Southwest Region:12. (a) Student flow direc on is indicated by matching color of flow line to color of des na on node. (b) Thickness of lines between sectors indicate number ofmobile students between sectors. (c) Size of node indicates volume of students moving to the ins tu on from within the region.13 P a g eStudent Transitions Project
Student Transi ons Project Research ResultsStudent Pathways DiagramsThe Student Transi ons Project depictsthe routes students take over a mul ‐year period in a series of PathwaysDiagrams provided on the StudentTransi ons Project web site. Thesediagrams are available for each ofB.C.’s 25 post‐secondary ins tu ons,each of the four regions and foursectors of B.C., and for the B.C. Systemoverall (see Figure 16). For moreinforma on and interpreta on of thesepathways diagrams, please refer to theDefini ons on this page.December 2016Defini ons:Student mobility is the movement ofstudents (specifically registrants in post‐secondary credit courses) from one B.C.public post‐secondary ins tu on toanother.c) Return – Switch ins tu ons byreturning to an ins tu onpreviously a endedd) Stopout Return ‐ Switch ins tu onsby returning to an ins tu onpreviously a ended, but a er astop out period of non‐registra on.Students take a variety of routes orpathways between ins tu ons over me.When a student switches ins tu ons, thestudent takes a mobile student pathway,otherwise the student takes a non‐mobilestudent pathway.Non‐Mobile Student Pathways: Whenstudents do not switch ins tu ons, thereare four other pathways they might havetaken (or will take in the future).a) New to STP – New student to theSTP with no previous record ofThe student mobility rate is the propor onregistra on (back to 2002/03) inof students who took a mobile pathway toany ins tu on in the B.C. publictheir registra on in a given year, expressedpost‐secondary system.as a percentage of all students registered inb) Exit STP – Le the B.C. public post‐that year.secondary system. There are nofurther record(s) of registra on inMobile Student Pathways: Depending onthe B.C. public post‐secondarythe ming and type of mobility, foureduca on system beyond this pointdifferent mobile pathways are possible.in me (up to Fall 2011).a) Move – Switch ins tu ons by movingc) Con nue – Con nue registra on atto an ins tu on never a endedthe ins tu on last a ended in thebeforeprevious me period.b) Stopout Move – Switch ins tu onsd) Stopout Con nue – Con nue at theby
Keith Ellis, Director, Ins tu onal Research & Planning, Douglas College Joanne Heslop, Manager, Student Transi ons Project Hugh Judd, Central Data Warehouse Coordinator, Research and Analysis, Ministry of Advanced Educa on Zareen Naqvi, Director, Ins tu onal Research and Planning, Simon Fraser University Anna Tikina, Research Officer,