Transcription
EUROPEAN UNION:AN EMISSIONS TRADINGCASE STUDY
European UnionThe World’s Carbon Markets: A Case Study Guide to EmissionsTradingLast Updated: May 2015EU ETS Phase III (2015)Target-21% below 1990 by 2020Cap (tCO2e)1,964,282,108Carbon price 5.88 (2014 average) 6.91 (Q1 2015)Greenhouse GassescoveredCarbon dioxide (CO2), nitrous oxide (N2O),perfluorocarbons (PFCs)Number of EntitiesCovered 11,500Sectors CoveredPower and heat generation, industrial processes (oilrefineries, coke ovens, iron and steel plants),production of cement, glass, lime, bricks, ceramics,pulp, paper and board, commercial aviation, CCSnetworks, production of petrochemicals, ammonia,non-ferrous metals, gypsum and, aluminum, nitric,adipic and glyoxylic acid.ThresholdSector specific% Total emissionscovered45%Compliance tools &FlexibilitymechanismsFree allowance allocation, offsets, banking, MarketStability reserve (2019)Table 1: Programme OverviewPage 1 of 20
Brief History & Recent DevelopmentsDateEvent2003EU ETS directive adopted2004EU linking directive with Kyoto Protocol adopted2005EU ETS Phase I (2005-2007) launched on 1st January2007Bulgaria and Romania join EU ETS2008Beginning of Phase II (2008-2012)2008Norway, Iceland and Liechtenstein join EU ETS2009Adoption of the 2020 EU energy and climate package (Effort sharingdirective) with a revised directive for the Phase III of the EU ETS(2013-2020)2010EU ETS Aviation directive2011EU Commission release communication: “Towards a 2050 low-carboneconomy roadmap”2012International aviation included in ETS2013Beginning of Phase III (2012-2013)2014Market Stability Reserve and Backloading measures implementedTable 2: Key datesSource: European Commission, DG CLIMA, 2015. Available at: ec.europa.euThe EU Emissions Trading System (ETS) was the first multi-national installation-level cap-and-trade programme. TheETS covers 45% of carbon dioxide (CO2) emissions in the EU, as well as emissions of other greenhouse gases (GHGs).The 31 countries covered by the EU ETS – being the EU28 plus Iceland, Liechtenstein and Norway – account for 20%of global gross domestic product (GDP) and 11% of the world’s energy-related CO2 emissions. 1The EU ETS was established by the Directive of the European Parliament and the European Council in October 2003. 2In 2004, the Directive was amended to link the EU ETS with the international carbon market, 3 and the ETS came intoforce in 2005. A Directive in 2008 amended the EU ETS Directive to cover CO2 emissions from aviation beginning in2012, 4 although this was later amended to apply only to flights within the European Economic Area or within outermostregions. Amendments in 2009 established annual emissions reductions for a post-2012 Phase of the EU ETS without asunset clause, implying that the EU-wide system is set to continue beyond 2020. 5 While the declining emissions capcontinues by default beyond 2020 with 1.74% increased up to 2.2% after 2020. The European Commission envisagesthe emission reductions required to meet the EU’s stated emissions reduction objective of 80-95% below 1990 levels by2050 as part of an effort by developed countries as a group to reduce their emissions by a similar degree, can be reachedby the current trajectory of the ETS.On 22 January 2014, the European Commission published its non-legislative Communication on the 2030 Climate andEnergy Framework. 6 It proposed two binding targets, which were adopted by Member States in October 2014: A domestic GHG reduction target of at least 40% by 2030 compared to 1990 levels. No use of internationalcredits after 2020 is foreseen, unless the global climate agreement reached at the end of 2015 justifies the EUincreasing its GHG reduction target for 2030 beyond 40%, which could be met by using international credits(a scenario of a 45% emission reduction target is assessed). For the EU ETS sectors, this target means achievingan emissions reduction target of -43% below 2005 levels by 2030. An indicative renewable energy target of at least 27% for the EU as a whole (with no binding energy efficiencytargets for Member States, although this was reviewed at a later date and the European Commission proposedPage 2 of 20
a 30% energy efficiency target but EU Heads of States then endorsed an indicative target of 27% to be reviewedin 2020 having in mind a 30% target).At the beginning of Phase III (January 2013), the allowance surplus within the EU ETS stood at 2.1 billion allowances. 7Due to a lack of reliable emissions data that could be used to establish an accurate emission baseline, allowance surplushas been an issue since Phase I. In Phase II, the allowance surplus was a result of the economic crisis and other climatepolicies. According to the European Commission, without action, a structural surplus will continue during the majorityof Phase III and will likely undermine the overall effectiveness of the EU ETS. In order to address this issue theEuropean Commission has undertaken two main initiatives:1.Market Stability Reserve (long term): In January 2014, the European Commission published an EU ETSstructural reform legislative proposal for the creation of a Market Stability Reserve (MSR). 8 The objective ofthe reserve is to adjust the supply of allowances according to changes in demand. This proposal was followedby a public consultation (which ended in March 2015) on the revision of the EU ETS Directive for Phase IV(after 2020). An additional legislative proposal to amend the ETS Directive is expected later in 2015, once theMSR is adopted, and will incorporate the elements from the politically-agreed 2030 climate & energyframework into the ETS Directive. 92.Backloading (short term): In February 2014, the European Parliament and European Member Statesadopted a European Commission proposal on Backloading - a measure to postpone the auctioning of 900million allowances from 2014-16 until 2019-20 initially. Due to the adopted MSR, back loaded allowances areto be place directly within the Market Stability Reserve at the end of the third trading period. 10Summary of Key Policy FeaturesCAP & TARGET:Kyoto Protocol (KP) Emission Reduction CommitmentThe EU15’s emission reduction objective under the first commitment period of the Kyoto Protocol was to reduceeconomy-wide GHG emissions to 8% below 1990 levels (on average) over 2008-12. As part of the EU’s strategy to reachthis target, firms covered by the EU ETS were required to reduce their net emissions by 6.5% below 2005 levels. 11 InPhase II, which coincided with the Kyoto period, the cap was 2,083 million tonnes of carbon dioxide equivalent peryear (tCO2e). 12 However, excluding the countries and installations which joined in Phase II, the comparable ETS-widecap would have been 1,909 million tCO2e/year, 8% below the Phase I cap of 2,181 million tCO2e/year. 13While the EU15, a are considered a single regional bubble, under its first Kyoto Protocol commitment period, the burdensharing agreement assigned each member state a portion of the region’s commitment. 14EU Emissions Reduction CommitmentThe EU aims to reduce economy-wide GHG emissions 20% below 1990 levels (or 13% below 2005 levels) by 2020.To reach this goal, the EU target is divided into two sub-targets:a EU ETS sectors: Sectors covered by the EU ETS have a reduction target of 21% below 2005 levels by 2020.This translates to a maximum of 1,777 million tCO2e emitted by covered entities in 2020. 15 Around 45% ofGHG emissions in the EU are covered by the ETS. Non-EU ETS sectors: For the majority of sectors not included under the EU ETS, the emission reductiontarget is 10% below 2005 levels by 2020. This target is determined by the Effort Sharing Decision (ESD), 16which was adopted in April 2009. The ESD sets GHG emission reduction targets for each Member State forsectors not covered by the EU ETS (transport, heating of buildings, small-scale industry, agriculture andwaste). Currently, these sectors cover 55% of total GHG emissions emitted by EU Member States. However,the ESD does not cover or set emission reduction targets for land use, land-use change and forestry (LULUCF)Referring to the 15 EU Member States as of 1997Page 3 of 20
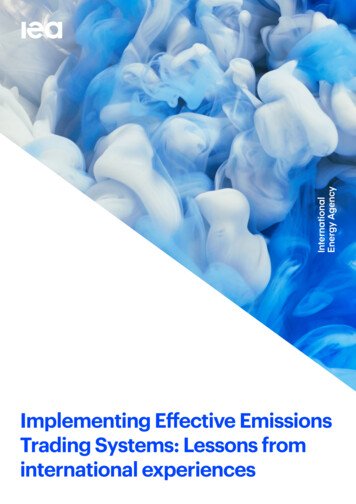
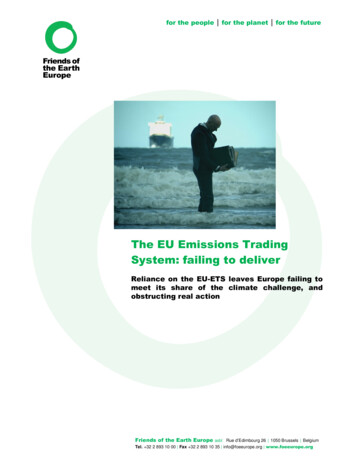
activities. A public consultation on the ESD was launched in March 2015. The INDC indicates EUs interest inincluding LULUCF in the 2030 effort.The long term objective is to reduce the EU’s emissions to 80-95% below 1990 levels by 2050, which includes bothsectors covered by the EU ETS and non-traded sectors. 17EU emissions capThe 2015 cap for power stations and other fixed installations among the 28 EU Member States is set at 1,964 milliontCO2e. 18 During Phase III, a linear reduction factor decreases the overall cap annually by 1.74% of the average totalquantity of allowances that were issued from 2008-12. Beginning in Phase IV, according to the 2030 climate and energypolicy framework, the linear reduction factor will be 2.2%. During Phases I and II, Member States determined the totalquantity of allowances that would be issued (their emissions cap), subject to Commission approval, and the breakdownof allowances that would be distributed to covered installations within the country. Phase III brought substantialchanges in the allocation rules: a single EU-wide cap for free allowances has been established and allocation takes placeaccording to harmonized rules.YearCap 1,975,94720191,814,540,56020201,777,105,173Table 3: EU ETS cap for covered sectors except aviation for the period 2013 -20Source: European Commission, 2015. Available at: eur-lex.europa.euFigure 1: EU ETS emissions cap and allocation by 2030Source: CDC Climat Research, 2015. Based on the European Commission’s 2030 proposalsPage 4 of 20
SCOPE & COVERAGE: The EU ETS covers around 50% of EU CO2 emissions and 45% of total EU GHGemissions. 19 The ETS limits the GHG emissions of over 11,500 installations, 20 owned by 5,000 companies in31 countries. b The point of obligation is at the point of emissions. 21 The EU ETS covers CO2 and, since 2013, nitrousoxide (N2O) and perfluorocarbons (PFC) for specific wer stations and other combustionICO220 MWRefining of mineral oilICO2-CokeICO2-Cement clinkerICO2550t/day(rotary kilns)Ceramic products by firingICO275t/dayGlassICO220t/dayIron or steelICO22.5t/hLime or calcination of dolomite or magnesiteICO250t/dayMetal ore roastingICO2-PulpICO2-Paper or cardboardICO220t/dayBlack carbonIIICO220t/dayBulk organic chemicals by cracking, reforming,partial or full oxidationIIICO2100t/dayDrying or calcination of gypsumIIICO220 MWGHG from Capture, transport and geologicalstorageIIICO2-Hydrogen, synthesis gas by reforming or partialoxidationIIICO225t/dayMineral wool insulation materialIIICO220t/daySectorNitric acidIIICO2, N2O-Production of adipic acidIIICO2, N2O-Production of glyoxal andIIICO2, N2O-Production or processing of ferrous metals and ofnon-ferrous metalsIIICO220MWProduction or processing of primaryIIICO2, PFCProduction or processing of secondaryaluminiumIIICO220 MWSoda ash and sodium bicarbonateIIICO2-Table 4: EU ETS sectors and threshold coverageSource: European Commission, 2003. Available at: eur-lex.europa.eubThe 28 EU nations, Iceland, Liechtenstein and Norway.Page 5 of 20
EU ETS implementation has been divided into four Phases thus far: Phase I (2005-07) was a “learning-by-doing” period; Phase II (2008-12): The scope of the EU ETS increased with the inclusion of the aviation sector and Iceland,Liechtenstein and Norway in 2012; 22 Phase III (2013-20): The scope expanded to include 17 industrial activities, N2O and PFCs. Croatia also joinedthe EU ETS, and the European Commission is negotiating a link between the EU ETS and the Swiss ETS. Phase IV (2021-28): Rules are still under development.Aviation within the EU ETSThe inclusion of international aviation emissions under the EU ETS has been a highly contentious issue over the years.The 2008 amended EU ETS Directive stated that all emissions from flights to, from and within the EU would be coveredfrom January 2012. 23 These provisions were amended in 2013 to facilitate international negotiations on aviation withinthe International Civil Aviation Organization (ICAO), a 191-nation body that operates under the aegis of the UnitedNations. Specifically, in April 2013 the EU enacted “Stop the clock” provisions which postponed the deadline for theaviation industry to surrender 2012 allowances by one year. In October 2013, ICAO formally agreed to develop a globalmarket-based mechanism by 2016 and to cap emissions from international flights from 2020. 24 Pending the possibleadoption of international rules, in April 2014, European member states and the European Parliament amended the EUETS Directive for the period of 2013-16. 25 Coverage for the aviation sector is currently limited to flight emissions withinthe European Economic Area (being the 28 EU member states plus, Iceland, Liechtenstein and Norway) for the periodfrom 2013 to 2016. 26AUCTION OVERVIEW: Since 2013, with the beginning of Phase III, auctioning has been the default method usedto allocate allowances. Most of the power sector is required to purchase allowances at auctions (taking into account thesector’s ability to pass on costs). c According to the European Commission, “given the significant weight of powergeneration in the EU ETS, and even with partial free allocation in eight Member States, more than 40% of the 2013annual allowances were auctioned”. 27 An exception is maintained for 8 Member States 28 who joined the EU after 2004- Bulgaria, Cyprus, Czech Republic, Estonia, Hungary, Lithuania, Poland and Romania (Latvia and Malta were alsoeligible to use this derogation but chose not to). Derogation under Article 10c of the EU ETS Directive allows thesestates to provide a decreasing number of free allowances to existing power plants for a transitional period until 2019(although as part of the negotiations for the EU’s 2030 climate and energy framework, this exemption may be extendedto 2030).Industrial sectors that are not eligible for carbon leakage protection are required to purchase 20% of allowances; this isexpected to increase to up to 70% by 2020. 29 By contrast, in Phase II, only 3% of annual allowances were auctioned. 30In Phase III, more than 7.9 billion allowances will be auctioned according to Member States’ based on emissionshistorical emission baselines: 31 88% are distributed based on a Member States’ share of verified emissions from EU ETS installations in 2005or by an average of the 2005-07 period, (whichever one is the highest); 10% of allowances will be distributed to the least wealthy EU Member States as an additional source of revenueto help them invest in reducing the carbon intensity of their economies and adapting to climate change, and; the remaining 2% are offered as a '”Kyoto bonus'” to nine EU Member States (Bulgaria, Czech Republic,Estonia, Hungary, Latvia, Lithuania, Poland, Romania and Slovakia) which, by 2005, had reduced their GHGemissions by at least 20% of the base year levels in their Kyoto targets.cWith exception of 7 Member States who are entitled to grant free allocation to the power sector for a transitory period and on the basis of real investments incarbon reductions.Page 6 of 20
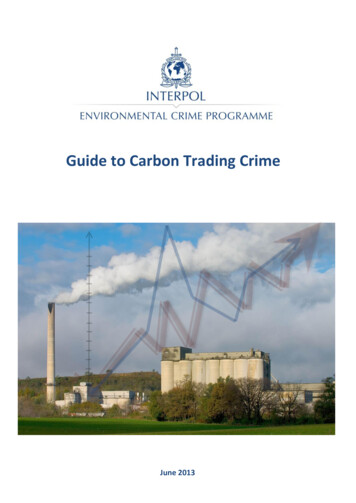
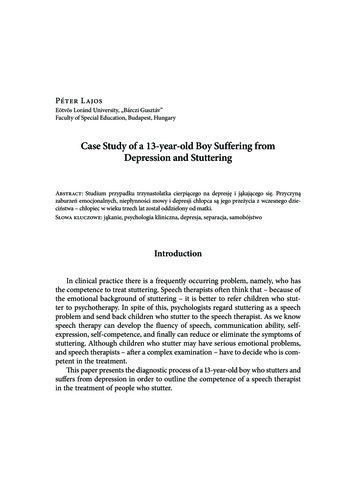
One impact of this distribution breakdown will be that countries with lower income will receive a greater amount offree allowances relative to high-income Member States. Auctions are conducted by national governments, but buyersare located worldwide. The EU ETS Directive has established a common platform to auction emission allowances onbehalf of the Member States: the European Energy Exchange (EEX) based in Germany. Member States can alsodevelop their own auction platforms such as the UK, (which has contracted ICE Futures Europe in London), Germany(which has appointed EEX), and Poland (which has contracted EEX to auction on their behalf).MillionsIn order to ensure greater efficiency of the EU ETS in Phase III, the auction calendar was modified to reflectbackloading, 32 which reduced the volume of allowances auctioned by 400 million in 2014, by 300 million in 2015, and200 million in 2016. The backloaded allowances will be placed into the Market Stability Reserve in 2019-20. 2018FinlandItalyMaltaRomaniaUnited Kingdom2019Czech Rep.2020FranceLatviaNetherlandsSlovakiaFigure 2: Overview of EU ETS auction volumes in Phase III, with backloadingSource: CDC Climat Research, 2015.Auction proceeds 34According to the EU ETS Directive, at least half of auction revenues should fund complementary GHG reductionmeasures in the EU and developing countries. Such measures can include renewable energy investment and energyefficiency, adaptation, minimising the economic impact on low to middle income households from higher electricityrates, reducing deforestation, and carbon capture and storage (CCS) projects. There is a divergence within memberstates on the extent to which auction revenues are used for climate protection – some will reinvest their full auctionrevenues in complementary GHG reduction measures, while others will return the auctioning revenues directly to theirTreasury. In 2013, the EU ETS’s total auctioning revenue amounted to 3.6 billion. 35 From this, around 3 billion wasused for climate and energy related purposes such as energy efficiency, renewables, research and sustainabletransport. 36Page 7 of 20
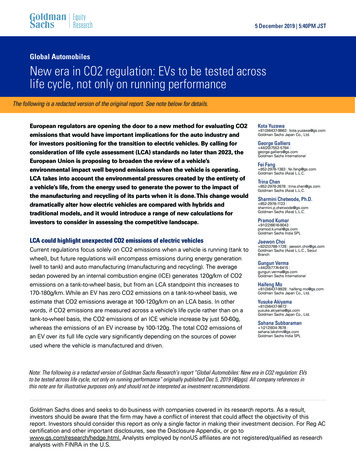
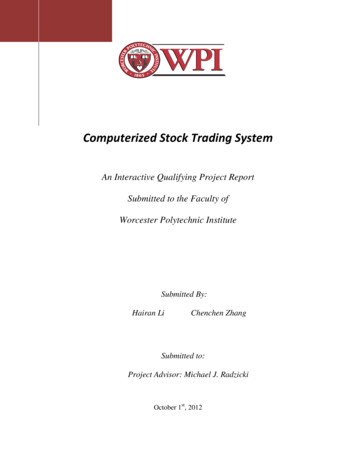
* IT, EL: split between domestic and international use not reported. BE: no information on the use ofauctioning revenues provided.** No reporting provided.Figure 3: Use of 2013 EU ETS auction revenueSource: European Commission, 2014. Available at: eur-lex.europa.euThe sale of 300 million Phase III allowances prior to the start of the trading period was to seed a fund dedicated to lowcarbon technologies such as CCS and renewable energy projects, the NER 300. 37 Auctioning revenues were distributedto projects that were selected through two rounds of proposals, covering 200 and 100 million allowances respectively.The NER 300 programme also seeks to leverage a considerable amount of private investment and/or national cofunding.According to the European Commission, the first call for proposals in April 2013 led to a total of 1.1 billion of fundingawarded to 20 renewable energy projects. 38 This amount is estimated to have leveraged additional funding of over 2billion from private sources. The projects awarded funding are expected to be operational by December 2016 at thelatest. The second round of funding in July 2014 granted a total of 1 billion in funding to 18 renewable energy projectsand one CCS project. This amount is estimated to have leveraged over 860 million of additional funding from privatesources. The projects awarded funding must reach their final investment decisions by July 2016 and enter intooperation by July 2018 at the latest. 39Auctioning rules for the aviation sector 4015% of allowances issued for the aviation sector are auctioned. Member states are able to auction a number of theseallowances in proportion to their share of verified aviation emissions compared to other member states. Aviationauctions differ from general auctions for covered stationary sources in that, from 2013 to 2016, the amount of aviationallowances for auctions is positioned to progressively decrease. Beyond 2016, the EU legislation on aviation could beamended taking into account the potential decision of the ICAO. 41ALLOWANCE DISTRIBUTION: During Phase I and Phase II, allowances were largely allocated for free. Eachmember state developed and made public their National Allocation Plan (NAP) specifying the number of allowancesallocated to each installation per year and the amount of offsets they were permitted to use to satisfy their complianceobligation. All NAPs were submitted to and evaluated by the European Commission. 42 Member states were entitled toauction a maximum of 5% of their cap during the pilot phase and up to 10% in Phase II; however, this option was rarelyexercised. 43Page 8 of 20
While auctioning is the primary method of allocation in Phase III, there is still an element of free allocation. By 28February of each year, member states are to communicate the quantity of allowances to be allocated to each installationin their territory in their National implementation measures (NIM) submission to the European Commission. TheEuropean Commission and the European Free Trade Association Surveillance Authority then verify each NIM to ensureit is compliant with the relevant legal provisions and approve or reject the NIMs accordingly. Since 2013, freeallowances 44 have been allocated according to EU harmonised rules on the basis of benchmarks (carbon intensitytarget) and historical production levels. A benchmark does not represent an emission limit or even an emissionreduction target, but merely a value used to calculate free allocation per installation. The benchmarks have beendeveloped per product, to the extent feasible, based on a value reflecting the average GHG emissions performance ofthe 10% best performing installations in the EU producing that product.In Phase III, 5% of allowances are placed in the new entrants’ reserve (not eligible for new entrants in electricityproduction). 45 At the end of Phase III, any remaining allowances are likely to be placed into the MSR, according to theprovisional agreement reached at the time of writing. 46Avoid the risk of carbon leakage 47Under certain conditions, firms in sectors that are ‘at risk’ of carbon leakage may receive free allowance allocationsbased on industry best-practice benchmarking – measured as the best 10% of performers in the sector - but the totalfree allocation to benchmarked industries decreases linearly with the overall cap. As of 2013, firms outside of the powersector receive 80% of their benchmark for free, but this form of free allocation will decrease to 30% by 2020 and furtherthereafter. Until 2020, emissions-intensive trade exposed (EITE) firms will receive up to 100% of their benchmark viafree distribution. 48The European Commission is required to review the list of sectors vulnerable to carbon leakage every five years. Thefirst list was adopted in 2009 but applied at the start of Phase III in 2013. The second list (adopted in October 2014) 49used the same criteria as the previous list and will be applicable from 2015 to 2019. A sector or sub-sector is deemed tobe exposed to a significant risk of carbon leakage if: 50 The extent to which the sum of direct and indirect additional costs induced by the implementation of theDirective would lead to an increase of production cost, calculated as a proportion of the Gross Value Added,of at least 5%; andThe trade intensity (imports and exports) of the sector with countries outside the EU is above 10%.A sector or sub-sector is also deemed to be at risk of carbon leakage if just one of the following requirements is met: The sum of direct and indirect additional costs is at least 30%; orThe non-EU trade intensity is above �� 𝑐𝑐𝑐𝑐𝑐𝑐𝑐𝑐 𝑇𝑇𝑇𝑇𝑇𝑇𝑇𝑇𝑇𝑇 ��𝐼𝐼𝐼𝐼𝐼 𝐷𝐷𝐷𝐷𝐷𝐷𝐷𝐷𝐷𝐷𝐷𝐷 ��𝑖𝑖𝑖 𝑐𝑐𝑐𝑐𝑐𝑐𝑐𝑐𝑐𝑐𝑐𝑐 𝑐𝑐𝑐𝑐𝑐𝑐𝑐𝑐 30 %𝐺𝐺𝐺𝐺𝐺𝐺𝐺𝐺𝐺𝐺 𝑣𝑣𝑣𝑣𝑣𝑣𝑣𝑣𝑣𝑣 ��𝐼𝐼𝐼𝐼𝐼𝐼𝐼𝐼𝐼𝐼𝐼 ��𝐸 30 ���𝑃𝑃𝑃𝑃𝑃𝑃𝑃 ��𝐼 ��𝐸𝑇𝑇𝑇𝑇𝑇𝑇𝑇𝑇𝑇𝑇 ��𝐼𝐼𝐼𝐼𝐼 10 %& 𝐶𝐶𝐶𝐶𝐶𝐶𝐶𝐶𝐶𝐶𝐶𝐶 𝑐𝑐𝑐𝑐𝑐𝑐𝑐𝑐 5 %Page 9 of 20
CriteriaN SectorsAllocated FreeAllowances(million tonnes)Carbon Cost (CC) 30%4210Trade Intensity (TI) 30%133148CC 5% et TI 10 %20496Listed Total146712Industry Total236755Table 5: List of carbon leakage sectors and criteria between 2015 and 2020Source: CDC Climat Research, 2015. Available at: eur-lex.europa.euAviation sector specificities 51The EU Aviation ETS also features a new entrants reserve called the Special Reserve. 52 Starting in 2013, every year 3%of the total aviation allowances (around 6.3 million tCO2) are added to the reserve. 53The role of the reserve is todistribute free allowances to aircraft operators who began operations after 2010 or for those for whose tonne-kilometredata has increased by more than 18% (on average) annually between 2010 and 2014. In both cases, aviation activitiescannot, wholly or in part, be a continuation of activities performed by another aircraft operator. 54 To apply for freeallocation from the Special Reserve, aircraft operators are required to submit their 2014 verified tonne-kilometre datato the European Commission. A final decision on such requests will be adopted in 2016, and allowances will be issuedfrom 2017 onwards. The deadline to apply for allowances from the Special Reserve is 30 June 2015. Allowances thatare not allocated from this reserve will be cancelled.FLEXIBILITY PROVISIONS: The EU ETS Directive gives covered entities some options to comply with theirobligations. These provisions are related to offsetting emissions, banking, and linking to foreign ETS’s.The use of offset credits 55Offset usage for the period 2008-20 is constrained to 50% of the required aggregated abatement relative to 2005.Emitters are allowed to use credits from the flexibility mechanisms established by the Kyoto Protocol, the CleanDevelopment Mechanism (CDM) and Joint Implementation (JI).In Phase II, the rules relating to the usage of certified emission reductions (CERs) and emission reduction units(ERUs) for covered entities were defined by each member state and calculated as a percentage of the allocation of eachinstallation. 56 Each country individually specified the percentage of offsets allowed (international offsets as apercentage of total allowances); the range varied from 0% (Estonia) to 20% (Spain, Germany, and Lithuania). 57 In total,CERs and ERUs were permitted to comprise up to 13.4% of the total EU cap, equating to 1.4 billion allowances. 58Amendments to the EU ETS Directive in 2011 excluded the possibility of using CERs for compliance from projectsregistered after 2012 unless the project was in a least developed country (LDC) and was registered after 2012. Since2013, CERs and ERUs from industrial gas projects are ineligible, 59 while credits from hydroelectric projects exceeding20MW of installed capacity are subject to terms and conditions. 60Unused Phase II offset caps were transferred to Phase III (2013-20). The exact amount eligible for use per operator inPhase III depends on whether or not the operators are new entrants.Page 10 of 20
OperatorsLimiteduse from2008-20(%)Stationary InstallationsAlready covered in Phase II11New entrants in Phase III4.5Aircraft 1.5Table 6: Limited use of offsets during EU ETS: Phase IIISource: EU Commission, 2013. Available at: eur-lex.europa.euThe total amount of available credits from ERUs and CERs exceeds 1,600 million tCO2e, which equates toapproximately 50% of the projected abatement required by the EU ETS from 2008-20. 61From 2020, as per the 2030 Climate and Energy Policy Framework, there will be a shift towards achieving emissionreductions domestically rather than relying on international credits to achieve reduction goals.Banking & BorrowingUnlimited banking of allowances was allowed in Phases II and III. Borrowing is not technically allowed, but sincethe compliance period submission deadlines follow the issuance of the following year’s allowances, there is effectivelyyear-ahead borrowing within trading periods (but not between the last year of one period and the first year of thenext). 62Linking provisionsThe EU considers linkage of its carbon market with programmes in other countries as an essential step in buildinga global carbon market. 63 Norway, Iceland and Liechtenstein joined the EU ETS in 2008 and the European Commissionis currently negotiating a link with the Swiss ETS. A planned link with Australia was put on hold following the repeal ofAustralia’s emissions trading system in July 2014.COST CONTAINMENT & VOLATILITY MANAGEMENT: Banking between Phases II and III, and PhaseIII’s longer eight-year trading period, are intended to bolster investment certainty. In addition, the decline in the EUETS linear cap will continue beyond 2020 in order to provide a stable, long-term policy signal for investors. 64 However,a build-up of allowances in the system during Phase II risks undermining the long-term objectives of the EU ETS, andprompted the EU to pursue two options to reform the market using Backloading as a short-term fix and a marketstability reserve as a long-term structural solution.BackloadingBackloading, which was adopted in February 2014, allows the withholding of 400 million allowances from auctioningin 2014, 300 million in 2015 and 200 million in 2016. The allowances are currently due to be placed into the MarketStability Reserve in 2019. 65 Backloading was implemented via an amendment to the EU ETS Auctioning Regulation. 66Market Stability ReserveTo manage the current and growing supply-demand imbalance, the European Commission has proposed to establish aMarket Stability Reserve (MSR). 67The MSR functions by triggering adjustments to annual auction volumes in situations where the total number ofallowances in circulation is outside a certain predefined range: When the surplus exceeds 833 million allowances, 12% of the allowances in circulation will be placed in theMSR instead of being auctioned;Page 11 of 20
When the surplus is less than 400 million allowances, 100 million allowances would be released from the MSRvia future auctions.The MSR legislative proposal, put forward in January 2014 at the same time as the EU’s 2030 Climate and Energypolicy framework, requires approval by the member states and the European Parliament before becoming law. At thebeginning
to be place directly within the Market Stability Reserve at the end of the third trading period. 10. Summary of Key Policy Features . CAP & TARGET: Kyoto Protocol (KP) Emission Reduction Commitment. The EU15's emission reduction objective under the first commitment period of the Kyoto Protocol was to reduce