Transcription
ELECTRICAL CIRCUITS LABORATORYLAB MANUALYear:2016 - 2017Subject Code:AEE102Regulations:R16Class:I B.Tech II SemesterBranch:ECE / EEEPrepared byMr.P.Sridhar(Professor/HOD)Mr.T.Anil kumar(Associate Professor)Mr.G.Hari krishna(Assistant Professor)Mr.A.Naresh kumar(Assistant Professor)Electrical and Electronics EngineeringINSTITUTE OF AERONAUTICAL ENGINEERING(Autonomous)Dundigal, Hyderabad - 500 0431 Page
INSTITUTE OF AERONAUTICAL ENGINEERING(Autonomous)Dundigal, Hyderabad - 500 043ELECTRICAL AND ELECTRONICS ENGINEERINGProgram ineering knowledge: Apply the knowledge of mathematics, science, engineering fundamentals, andan engineering specialization to the solution of complex engineering problems.Problem analysis: Identify, formulate, review research literature, and analyze complex engineeringproblems reaching substantiated conclusions using first principles of mathematics, natural sciences, andengineering sciencesDesign/development of solutions: Design solutions for complex engineering problems and design systemcomponents or processes that meet the specified needs with appropriate consideration for the public healthand safety, and the cultural, societal, and environmental considerations.Conduct investigations of complex problems: Use research-based knowledge and research methodsincluding design of experiments, analysis and interpretation of data, and synthesis of the information toprovide valid conclusions.Modern tool usage: Create, select, and apply appropriate techniques, resources, and modern engineeringand IT tools including prediction and modeling to complex engineering activities with an understanding ofthe limitations.The engineer and society: Apply reasoning informed by the contextual knowledge to assess societal,health, safety, legal and cultural issues and the consequent responsibilities relevant to the professionalengineering practice.Environment and sustainability: Understand the impact of the professional engineering solutions insocietal and environmental contexts, and demonstrate the knowledge of, and need for sustainabledevelopment.Ethics: Apply ethical principles and commit to professional ethics and responsibilities and norms of theengineering practice.Individual and team work: Function effectively as an individual, and as a member or leader in diverseteams, and in multidisciplinary settings.Communication: Communicate effectively on complex engineering activities with the engineeringcommunity and with society at large, such as, being able to comprehend and write effective reports anddesign documentation, make effective presentations, and give and receive clear instructions.Life-long learning: Recognize the need for, and have the preparation and ability to engage in independentand life-long learning in the broadest context of technological change.Project management and finance: Demonstrate knowledge and understanding of the engineering andmanagement principles and apply these to one’s own work, as a member and leader in a team, to manageprojects and in multidisciplinary environments.Program Specific OutcomesPSO1PSO2PSO3Professional Skills: Able to utilize the knowledge of high voltage engineering in collaboration withpower systems in innovative, dynamic and challenging environment, for the research based team work.Problem - Solving Skills: To explore the scientific theories, ideas, methodologies and the new cuttingedge technologies in renewable energy engineering, and use this erudition in their professionaldevelopment and gain sufficient competence to solve the current and future energy problems universally.Successful Career and Entrepreneurship: To be able to utilize of technologies like PLC, PMC, processcontrollers, transducers and HMI and design, install, test, and maintain power systems and industrialapplications.2 Page
INDEXS. No.List of ExperimentsPage No.1Verification of Kirchhoff’s current law and voltage law using hard ware anddigital simulation.62Verification of mesh analysis using hard ware and digital simulation.103Verification of nodal analysis using hard ware and digital simulation.13456Determination of average value, rms value, form factor, peak factor ofsinusoidal wave, square wave using hard ware and digital simulation.Verification of super position theorem using hard ware and digitalsimulation.Verification of reciprocity theorem using hardware and digital simulation.1620238Verification of maximum power transfer theorem using hardware anddigital simulationVerification of Thevenin’s theorem using hard ware and digital simulation9Verification of Norton’s theorem using hard ware and digital simulation3410Verification of compensation theorem using hard ware and digitalsimulation3711Verification of Milliman’s theorem using hard ware and digital simulation4112Verification of series resonance using hard ware and digital simulation4513Verification of parallel resonance using hard ware and digital simulation5114Verification of self inductance and mutual inductance by using hard ware57727303 Page
ATTAINMENT OF PROGRAM OUTCOMES & PROGRAM SPECIFIC cation of Kirchhoff’s current law and voltage lawusing hard ware and digital simulation.Verification of mesh analysis using hard ware and digitalsimulation.Verification of nodal analysis using hard ware and digitalsimulation.Determination of average value, rms value, form factor,peak factor of sinusoidal wave, square wave using hardware and digital simulation.Verification of super position theorem using hard wareand digital simulation.Verification of reciprocity theorem using hardware anddigital simulation.Verification of maximum power transfer theorem usinghardware and digital simulationVerification of Thevenin’s theorem using hard ware anddigital simulationVerification of Norton’s theorem using hard ware anddigital simulationVerification of compensation theorem using hard wareand digital simulationVerification of Milliman’s theorem using hard ware anddigital simulationVerification of series resonance using hard ware anddigital simulationVerification of parallel resonance using hard ware anddigital simulationVerification of self inductance and mutual inductance byusing hard wareProgram OutcomesAttainedProgram SpecificOutcomes O2PSO2PSO2PSO24 Page
ELECTRICAL CIRCUITS LABORATORYOBJECTIVE:The objective of the Electrical Circuits lab is to expose the students to the of electrical circuits and give themexperimental skill. The purpose of lab experiment is to continue to build circuit construction skills using differentcircuit element. It also aims to introduce MATLAB a circuit simulation software tool. It enables the students to gainsufficient knowledge on the programming and simulation of Electrical circuits,OUTCOMES:Upon the completion of Electrical Circuit and simulation practical course, the student will be able to attain thefollowing:1Familiarity with DC and AC circuit analysis techniques.2Analyze complicated circuits using different network theorems.3Acquire skills of using MATLAB software for electrical circuit studies.4Determine the self and mutual inductance of coupled coils.5 Page
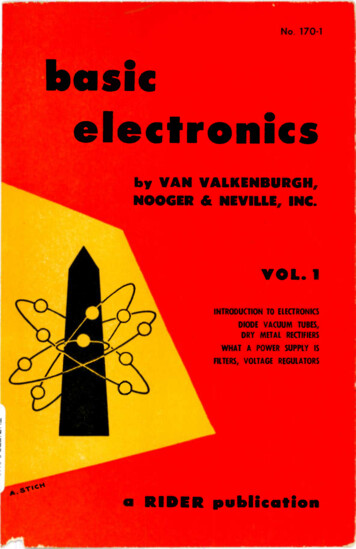
EXPERIMENT - 1(A) VERIFICATION OF KVL AND KCL1.1AIM:To verify Kirchhoff’s Voltage Law (KVL) and Kirchhoff’s Current Law (KCL) in a Passive ResistiveNetwork .1.2APPARATUS:S. No1.3Apparatus ors5Bread Board--016Connecting Wires--As requiredCIRCUIT DIAGRAMS:Figure – 1.1 Verification of KVLFigure – 1.2 Verification of KCL6 Page
1.4PROCEDURE:To Verify KVL1. Connect the circuit diagram as shown in Figure 1.2. Switch ON the supply to RPS.3. Apply the voltage (say 5v) and note the voltmeter readings.4. Gradually increase the supply voltage in steps.5. Note the readings of voltmeters.6. sum up the voltmeter readings (voltage drops) , that should be equal to applied voltage .7. Thus KVL is Verified practically.To Verify KCL1. Connect the circuit diagram as shown in Figure 2.2. Switch ON the supply to RPS.3. Apply the voltage (say 5v) and note the Ammeter readings.4. Gradually increase the supply voltage in steps.5. Note the readings of Ammeters.6. Sum up the Ammeter readings (I1 and I2) , that should be equal to total current (I).7. Thus KCL is Verified practically1.5OBSERVATIONS:For KVLV1 (volts)AppliedVoltageV (volts)TheoriticalPracticalV2 (volts)TheoriticalPracticalV3 (volts)TheoriticalV1 V2 V3 (volts)PracticalTheoriticalPracticalFor KCLI (A)AppliedVoltageV (volts)1.6TheoreticalI1 (A)PracticalTheoreticalPracticalI2 (A)TheoreticalPracticalI1 I2 (A)TheoreticalPracticalPRECAUTIONS:1.Check for proper connections before switching ON the supply2.Make sure of proper color coding of resistors3.The terminal of the resistance should be properly connected.1.7RESULT:7 Page
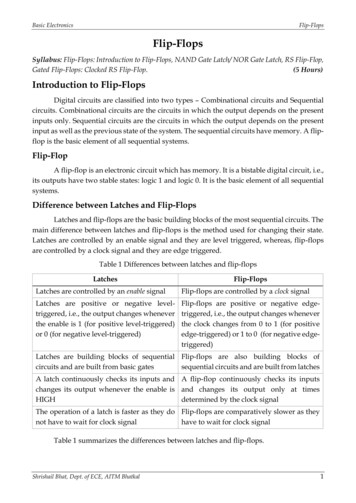
(B)VERIFICATION OF KVL AND KCL USING DIGITAL SIMULATION.1.8AIM:To verify Kirchhoff’s Voltage Law (KVL) and Kirchhoff’s Current Law (KCL) using digital simulation.1.9APPARATUS:S. No11.10SOFTWARE USEDMATLABDESK TOPQUANTITY01CIRCUIT DIAGRAMS:Figure – 1.3 Verification of KVLFigure – 1.4 Verification of KCL8 Page
1.11PROCEDURE:1. Make the connections as shown in the circuit diagram by using MATLAB Simulink.2. Measure the voltages and currents in each resistor.3. Verify the KVL and KCL.1.12OBSERVATIONS:For KVLV1 (volts)AppliedVoltageV (volts) TheoreticalPracticalV2 (volts)TheoreticalPracticalV3 (volts)TheoreticalV1 V2 V3 (volts)PracticalTheoreticalPracticalFor KCLI (A)AppliedVoltageV (volts)TheoreticalI1 (A)Practical1.13RESULT:1.14PRE LAB VIVA QUESTIONS:TheoreticalPracticalI2 (A)TheoreticalPracticalI1 I2 (A)TheoreticalPractical1. Define current.2. Define voltage.3. What is resistance?4. Define ohm’s law.5. State KCL and KVL.1.15POST LAB VIVA QUESTIONS:1. What do you mean by junction?2. Derive current division rule.3. Explain the sign conventions.4. Explain the color coding of resistors.9 Page
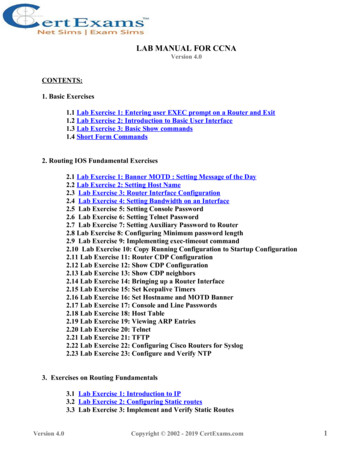
EXPERIMENT - 2(A) MESH ANALYSIS2.1AIMThe study of mesh analysis is the objective of this exercise, specifically its usage in multi-source DCcircuits. Its application in finding circuit currents and voltages will be tors2.Ammeter3.R.P.S4.Bread Board5.Connecting rce DC circuits may be analyzed using a mesh current technique. The process involves identifyinga minimum number of small loops such that every component exists in at least one loop. KVL is thenapplied to each loop. The loop currents are referred to as mesh currents as each current interlocks or mesheswith the surrounding loop currents. As a result there will be a set of simultaneous equations created, anunknown mesh current for each loop. Once the mesh currents are determined, various branch currents andcomponent voltages may be derived.2.4CIRCUIT DIAGRAM:Figure – 2.1 Mesh analyses2.5PROCEDURE1. Connect the circuit diagram as shown in Figure 2.1.2. Switch ON the supply to RPS.10 P a g e
3. Apply the voltage (say 15v).4. Gradually increase the supply voltage in steps.5. Connect ammeters in the loop and find the currents I1, I2 and I3.6. Verify the practical results obtained with theoretical results2.6OBSERVATIONS:Loop current(I1)AppliedVoltageV (volts)TheoreticalPracticalLoop current (I2)TheoreticalPracticalLoop current(I3)TheoreticalPractical2.7 PRECAUTIONS:1. Check for proper connections before switching ON the supply2. Make sure of proper color coding of resistors3. The terminal of the resistance should be properly connected.2.8RESULT:(B) MESH ANALYSIS USING DIGITAL SIMULATIONAIM:To verify mesh analysis using digital simulation.2.9APPARATUS:S. No1SOFTWARE USEDMATLABDESKTOPQUANTITY0111 P a g e
2.10SIMULATION DIAGRAMS:Figure – 2.2 Mesh analysis in MATLAB2.11PROCEDURE:1. Make the connections as shown in the circuit diagram by using MATLAB Simulink.2. Measure current in each resistor.3. Verify the mesh analysis.2.12OBSERVATIONS:Loop current(I1)AppliedVoltageV (volts)TheoreticalPractical2.13RESULT2.14PRE LAB VIVA QUESTIONS:Loop current (I2)TheoreticalPracticalLoop current(I3)TheoreticalPractical1. On which law is the mesh analysis based?2. What is mesh analysis?3. When do we go for super mesh analysis?4. What is the equation for determining the number of independent loop equations in mesh current method?2.15POST LAB VIVA QUESTIONS:1. How do we calculate branch currents from loop currents?2. How do we calculate branch voltages from loop currents?12 P a g e
EXPERIMENT - 3(A) NODAL ANALYSIS3.1AIMThe study of nodal analysis is the objective of this exercise, specifically its usage in multi-source DCcircuits. Its application in finding circuit node voltages will be tors2.Voltmeter3.R.P.S4.Bread Board5.Connecting WiresRangeType----QuantityrequiredTHEORY:In electric circuits analysis, nodal analysis, node-voltage analysis, or the branch current method is a methodof determining the voltage (potential difference) between "nodes" (points where elements or branchesconnect) in an electrical circuit in terms of the branch currents.3.4CIRCUIT DIAGRAM:Figure – 3.1 Nodal analysis13 P a g e
3.5PROCEDURE.1. Connect the circuit diagram as shown in Figure 3.1.2. Switch ON the supply to RPS.3. Apply the voltage (say 15v) and note the voltmeter readings.4. Gradually increase the supply voltage in steps.5. Note the readings of voltmeters.6. Verify the practical results obtained with theoretical results.3.6OBSERVATIONS:Node voltage(v1)AppliedVoltageV (volts)3.7TheoreticalPracticalNode voltage(v2)TheoreticalPracticalNode voltage(v3)TheoreticalPracticalPRECAUTIONS:1. Check for proper connections before switching ON the supply2. Make sure of proper color coding of resistors3. The terminal of the resistance should be properly connected.3.8RESULT(B) NODAL ANALYSIS USING DIGITAL SIMULATION3.9AIM:To verify nodal analysis using digital simulation.3.10APPARATUS:S. No1SOFTWARE USEDMATLABDESKTOPQUANTITY0114 P a g e
3.11SIMULATION DIAGRAMS:Figure – 3.2 Nodal analysis in MATLAB3.12PROCEDURE:1. Make the connections as shown in the circuit diagram by using MATLAB Simulink.2. Measure the voltage across each node using voltage measurement.3. Verify with the theoretical results obtained with practical results3.13OBSERVATIONS:Node voltage(V1)AppliedVoltageV (volts)TheoreticalPractical3.14RESULT:3.15PRE LAB VIVA QUESTIONS:Node voltage (V2)TheoreticalPracticalNode voltage (V3)TheoreticalPractical1. On which law is the nodal analysis based?2. What is nodal analysis?3. When do we, go for super-node analysis?3.16POST LAB VIVA QUESTIONS:1. Define node.2. Is nodal analysis is applicable to both dc and ac supply?3. How do we calculate branch currents from node voltages?4. How do we calculate branch voltages from node voltages?15 P a g e
EXPERIMENT - 4AVERAGE VALUE, RMS VALUE, FORM FACTOR, PEAK FACTOR OF SINUSOIDAL WAVE,SQUARE WAVE4.1AIM:To determine the average value, RMS value, form factor, peak factor of sinusoidal wave, square wave.4.2APPARATUSS. No4.3NameRangeQuantity1Resistors100Ω2 Nos2Inductor1 mH1 No3Function Generator1 No4Multimeter1 No5CRO1 NoTHEORY:In alternating current (AC, also ac) the movement (or flow) of electric charge periodically reversesdirection. An electric charge would for instance move forward, then backward, then forward, thenbackward, over and over again. In direct current (DC), the movement (or flow) of electric charge is only inone direction.Average value: Average value of an alternating quantity is expressed as the ratio of area covered by waveform to distance of the wave form.Root Mean Square (RMS) Value: The RMS value of an alternating current is expressed by that steadyDC current which when flowing through a given circuit for given time produces same heat as produced bythat AC through the sane circuit for the same time period. In the common case of alternating current whenI(t) is a sinusoidal current, as is approximately true for mains power, the RMS value is easy to calculatefrom the continuous case equation above. If we define Ip to be the peak current, then in general formWhere t is time and ω is the angular frequency (ω 2π/T, where T is the period of the wave).For a sinusoidal voltage,16 P a g e
The factor is called the crest factor, which varies for different waveforms. For a triangle wave formcentered about zero.For a square wave form centered about zeroRMS (Root Mean Square) value of an ac wave is the mean of the root of the square of the voltages atdifferent instants. For an ac wave it will be 1/ 2 times the peak value.4.4CIRCUIT DIAGRAM:Fig – 4.1 Basic Circuit4.5PROCEDURE:1. Connect the circuit as shown in the circuit diagram of fig. 4.1.2. Set the value of frequency say 100 Hz in the function generator.3. Adjust the ground of channel 1 and 2 of Cathode Ray Oscilloscope and then set it into DCmode.4. Connect CRO across the load in DC mode and observe the waveform. Adjust the DC offset offunction generator.5. Note down the amplitude and frequency.6. Set the multimeter into AC mode and measure input voltage and voltage across point AB. Thisvalue gives RMS value of sinusoidal AC.7. Calculate the average value.8. Repeat experiment for different frequency and different peak to peak voltage.9. Measure the RMS and Average value of DC signal also where instead of function generatoryou can use DC supply.17 P a g e
4.54.6OBSERVATIONS & CALCULATIONS:Peak valueRMS valueAverage value(V)(V)(V)PRECAUTIONS:1. Check for proper connections before switching ON the supply2. Make sure of proper color coding of resistors3. The terminal of the resistance should be properly connected4.7RESULT:(B) AVERAGE VALUE, RMS VALUE, FORM FACTOR, PEAK FACTOR OF SINUSOIDAL WAVE,SQUARE WAVE USING DIGITAL SIMULATION4.8AIM:To Determine the average value, RMS value, form factor, peak factor of sinusoidal wave, square wave.4.9APPARATUS:S. No14.10SOFTWARE USEDMATLABDESKTOPQUANTITY01CIRCUIT DIAGRAM:Fig – 4.2 MATLAB Simulink circuit18 P a g e
4.11PROCEDURE:1. Make the connections as shown in the circuit diagram by using MATLAB Simulink.2. Measure the Peak value of the voltage obtained3. Verify with the practical results obtained with theoretical results4.12OBSERVATIONS & CALCULATIONS:Peak valueRMS valueAveragevalue(V)(V)(V)4.13RESULT:4.14PRE LAB VIVA QUESTIONS:1. What is complex wave?2. Define Instantaneous value.3. Why RMS value is not calculated for DC quantity?4. Define RMS Value.5. What is the expression for form factor and peak factor?4.15POST LAB VIVA QUESTIONS:1. What is RMS value of Sin wave?2. Why RMS value is specified for alternating Quantity?3. Why average value is calculated for half cycle for an sine wave?4. Define form factor and peak factor for an alternating wave.19 P a g e
EXPERIMENT - 5(A) VERIFICATION OF SUPERPOSITION THEOREM5.1AIM:To Verify principle of Superposition theoretically and practically.STATEMENT:In an linear, bilateral network the response in any element is equal to sum of individual responsesWhile all other sources are stors2.Ammeter3.R.P.S4.Bread Board5.Connecting WiresRangeType----requiredCIRCUIT DIAGRAM:Fig- 5.1 Both Voltage Sources are acting (V1&V2)5.4QuantityPROCEDURE:Fig - 5.2 Voltage Source V1 is acting aloneFig - 5.3 Voltage Source V2 is acting alone1. Connect the circuit as shown in figure (5.1) and note down the current flowing through R3 and let it be I.2. Connect the circuit as shown in figure (5.2) and note down the ammeter Reading, and let it be I1.3. Connect the circuit as shown in figure (5.3) and note down the ammeter reading, and let it be I2.4. Verify for I I1 I2 .20 P a g e
5. Compare the practical and theoretical currents.5.5TABULAR COLUMN:WHEN BOTHV1 & V2 0(I)PARAMETERSWHENV1 0 & V2 0(I1)WHENV1 0& V2 0(I2)Current through R3 (Theoretical Values)Current through R3 (Practical Values)5.6PRECAUTIONS:1. Check for proper connections before switching ON the supply2. Make sure of proper color coding of resistors3. The terminal of the resistance should be properly connected5.7RESULT(B)VERIFICATION OF SUPERPOSITION THEOREM USING DIGITAL SIMULATION.5.8AIM:To verify Superposition theorem using digital simulation.5.9APPARATUS:S. No15.10SOFTWARE USEDMATLABDESK TOPQUANTITY01CIRCUIT DIAGRAMS:Figure – 5.4 Verification of super position theorem.21 P a g e
Figure – 5.5. Verification of super position theorem.Figure – 5.6. Verification of super position theorem.5.11PROCEDURE:1. Make the connections as shown in the circuit diagram by using MATLAB Simulink.2. Measure the current in each circuit using current measurement.3. Verify with the theoretical results obtained with practical results5.12RESULT:5.13 PRE LAB VIVA QUESTIONS:1. State Superposition theorem.2. How to find power using Superposition theorem?3. Write applications of super position theorem.5.14POST LAB VIVA QUESTIONS:1. Is it possible to apply Superposition theorem to nonlinear circuit?2. Is it possible to apply Superposition theorem to ac as well as dc circuit?22 P a g e
EXPERIMENT – 6(A)VERIFICATION OF RECIPROCITY THEOREM6.1AIM:To verify the condition of Reciprocity for an electric network.6.2STATEMENTIn any linear, bilateral, single source network the ratio of excitation to response is constant even whentheir positions are inter - changed.6.3APPARATUS:S. No.6.4Name of the Equipment1Ammeter2Voltmeter3R.P.S4Resistors5Bread Board6Connecting WiresRangeTypeQuantityCIRCUIT DIAGRAM:Fig - 6.1 Basic CircuitFig – 6.2 Response due to 10v before interchanging load23 P a g e
Fig – 6.3 Response due to 10v after interchanging load6.5PROCEDURE:1. Connect the circuit as shown in fig 6.2.2. Measure the current I1 in the branch.3. Inter - change voltage source and response as shown in fig6.3 and note down the current I2.4. Observe that the currents I1 and I2 should be same.5. Measure the ratio of excitation and response and check whether they are equal in both cases arenot.6.6TABULAR COLUMN:Parameters6.7Theoretical ValuesPractical ValuesPRECAUTIONS:1. Check for proper connections before switching ON the supply2. Make sure of proper color coding of resistors3. The terminal of the resistance should be properly connected6.8RESULT24 P a g e
(B)VERIFICATION OF RECIPROCITY THEOREM USING DIGITAL SIMULATION.6.9AIM:To verify Reciprocity theorem using digital simulation.6.10APPARATUS:S. No16.11SOFTWARE USEDMATLABDESK TOPQUANTITY01CIRCUIT DIAGRAMS:Fig – 6.4 Response due to 10v before interchanging loadFig – 6.5 Response due to 10v after interchanging load6.12PROCEDURE:1. Make the connections as shown in the circuit-6.4&6.5 diagram by using MATLAB Simulink.2. Measure response current in the resistor in 10 ohms circuit-6.4.3. Measure response current in the resistor in 10 ohms circuit-6.5.4. Verify the reciprocity theorem.25 P a g e
6.13PRE LAB VIVA QUESTIONS:1. State reciprocity theorem.2. Is it possible to apply both theorems to ac as well as dc circuit?3. Is Reciprocity is applicable for unilateral and bilateral networks?6.14LAB ASSIGNMENT:1. State and prove reciprocity theorem.2. State applications of reciprocity theorem.6.15POST LAB VIVA QUESTIONS:1. Comment on the applicability of reciprocity theorem on the type of network.2. Is reciprocity theorem applicable for networks with current source?26 P a g e
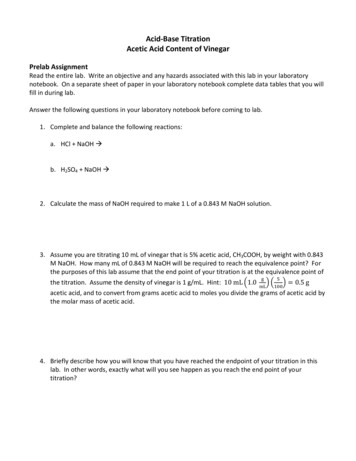
EXPERIMENT – 7(A)VERIFICATION OF MAXIMUM POWER TRANSFER THEOREM7.1AIM:To design the load resistor which absorbs maximum power from source.7.2STATEMENT:The maximum power transfer theorem states that maximum power is delivered from a source to an loadresistance when the load resistance is equal to source resistance. (RL Rs is the condition required formaximum power transfer).7.3CIRCUIT DIAGRAM:Fig – 7.17.4Maximum Power Transfer CircuitPROCEDURE:1. Connect the circuit as shown in fig.7.12. Vary the load resistance in steps and note down voltage across the load and current flowing throughthe circuit.3. Calculate power delivered to the load by using formula P V*I.4. Draw the graph between resistance and power (resistance on X- axis and power on Y-axis).5. Verify the maximum power is delivered to the load when RL Rs for DC.7.5TABULAR COLUMN:S. NoRLVIP VI1234527 P a g e
7.6MODEL GRAPH:Fig – 7.2 Output Graph of Maximum Power Transfer Theorem7.7PRECAUTIONS:1. Check for proper connections before switching ON the supply2. Make sure of proper color coding of resistors3. The terminal of the resistance should be properly connected7.8RESULT(B)VERIFICATION OF MAXIMUM POWER TRANSFER THEOREM7.9AIM:To verify maximum power transfer theorem using digital simulation.7.10APPARATUS:S. No1SOFTWARE USEDMATLABDESK TOPQUANTITY0128 P a g e
7.11CIRCUIT DIAGRAMS:Fig – 7.37.12Maximum Power Transfer CircuitPROCEDURE:1. Make the connections as shown in the circuit-7.3 diagram by using MATLAB Simulink.2. Measure the voltage and current through the load resistor using voltage measurement andcurrent measurement3. Calculate the power .4. Find the resistance at which maximum power delivered7.13RESULT:7.14PRE LAB VIVA QUESTIONS:1. State maximum power transfer theorem.2. Is it possible to apply maximum power transfer theorem to ac as well as dc circuit?3. How to find power using maximum power transfer theorem?7.15LAB ASSIGNMENT:1. State and prove maximum power transfer theorem for dc circuit.2. State and prove maximum power transfer theorem for ac circuit.7.16POST LAB VIVA QUESTIONS:1. What are conditions for maximum power transfer theorem?2. Is it possible to apply maximum power transfer theorem to nonlinear circuit?29 P a g e
EXPERIMENT - 8(A)VERIFICATION OF THEVENIN’S THEOREM8.1AIM:To Verify Thevenin’s rVoltmeterR.P.SBread BoardResistorsConnecting WiresRangeTypeQuantityAs requiredSTATEMENT:Any linear, bilateral network having a number of voltage, current sources and resistances can be replacedby a simple equivalent circuit consisting of a single voltage source in series with a resistance, where thevalue of the voltage source is equal to the open circuit voltage and the resistance is the equivalent resistancemeasured between the open circuit terminals with all energy sources replaced by their ideal internalresistances8.4CIRCUIT DIAGRAM:Fig-8.1 Measurement of VTH or VOCFig – 8.2 Measurement of RTHFig – 8.3 Measurement of IL (IL VTH or VOC/ RTH RL )30 P a g e
8.5PROCEDURE:1. Connect the circuit diagram as shown in fig.8.12. Measure current in RL.3. Connect the circuit as shown in fig8.2.4. Measure open circuit voltage Voc by open circuiting terminals i.e, VTH5. Draw the Thevenin’s equivalent circuit as shown in fig8.36. Measurement current in RL8.6.1TABULAR COLUMN:ParametersTheoretical ValuesPractical ValuesVocRTHIL8.7PRECAUTIONS:1. Check for proper connections before switching ON the supply2. Make sure of proper color coding of resistors3. The terminal of the resistance should be properly connected.8.8RESULT:(B)VERIFICATION OF THEVENIN’S THEOREM USING DIGITAL SIMULATION.8.9AIM:To verify Thevenin’s theorem using digital simulation.8.10APPARATUS:S. No1SOFTWARE USEDMATLABDESK TOPQUANTITY0131 P a g e
8.11CIRCUIT DIAGRAMS:Fig – 8.4 Measurement of VTH or VOCFig – 8.5 Measurement of IL (IL VTH or VOC/ RTH RL )8.12PROCEDURE:1. Make the connections as shown in the circuit-8.4 diagram by using MATLAB Simulink.2. Measure the open circuit voltage across the load terminals using voltage measurement.3. Connect circuit fig 8.5 Thevenin’s equivalent circuit in MATLAB and find the loadcurrent.8.12RESULT:8.13PRE LAB VIVA QUESTIONS:1. What is load resistance?2. How will you calculate Thevenin’s resistance RTH?3. How will you calculate Thevenin’s voltage VTH?4. How will you calculate load current IL?32 P a g e
8.14LAB ASSIGNMENT:1. Solve the theoretical value of Thevenin’s theorem for different circuits.2. Solve the theoretical value of Thevenin’s resistance for different circuits.8.15POST LAB VIVA QUESTIONS:1. Write the applications of Thevenin’s theorem.2. Write the limitations of Thevenin’s theorem.33 P a g e
EXPERIMENT - 9(A)VERIFICATION OF NORTON ’S THEOREM9.1AIM:To Verify Norton’s theorem.9.2STATEMENTAny linear, bilateral network with current sources, voltage sources and resistances can be replaced by anequivalent circuit consisting of a current source in parallel with a resistance. The value of the currentsource is the current flowing through the short circuit terminals of the network and the resistance is theequivalent resistance measured between the open circuit terminals of the network with all the energysources replaced by their internal resistances.9.3CIRCUIT DIAGRAM:Fig – 9.1 Norton’sCurrent Circuit9.4Fig – 9.2 Norton’sFig – 9.3 Norton’sEquivalent Resistance circuitEquivalent CircuitPROCEDURE:1. Connect the circuit diagram as shown in fig 9.1.2. Measure the current Isc (or) IN through AB by short-circuiting the resistance between A and B.3. Connect the circuit diagram as shown in fig 9.2.4. The resistance between A and B are obtained by using. Voltmeter, ammeter method and the ratio of Vand I gives RN.5. Draw Norton's equivalent circuit by connecting IN & RN in parallel as shown in fig9.3 and find loadcurrent.9.5TABULAR COLUMN:ParametersTheoretical ValuesPractical ValuesIsc/ INRNIL34 P a g e
9.6RESULT:(B)VERIFICATION OF NORTON’S THEOREM USING DIGITAL SIMULATION9.7AIM:To verify Norton’s theorem using digital simulation.9.8APPARATUS:S. No19.9SOFTWARE USEDMATLABDESK TOPQUANTITY01CIRCUIT DIAGRAMS:Fig-9.4 Norton’s current in MATLABFig-9.5 Load current in MATLAB35 P a g e
9.9PROCEDURE:1. Make the connections as shown in the circuit-9.4 diagram by using MATLAB Simulink.2. Measure the short circuit current
Upon the completion of Electrical Circuit and simulation practical course, the student will be able to attain the following: 1 Familiarity with DC and AC circuit analysis techniques. 2 Analyze complicated circuits using different network theorems. 3 Acquire skills of using MATLAB software for electrical circuit studies.