Transcription
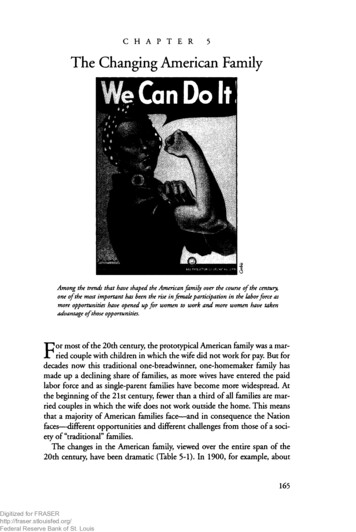
C H A P T E R5The Changing American FamilyAmong the trends that have shaped the American family over the course of the century,one of the most important has been the rise in female participation in the labor force asmore opportunities have opened up for women to work and more women have takenadvantage of those opportunities.For most of the 20th century, the prototypical American family was a married couple with children in which the wife did not work for pay. But fordecades now this traditional one-breadwinner, one-homemaker family hasmade up a declining share of families, as more wives have entered the paidlabor force and as single-parent families have become more widespread. Atthe beginning of the 21st century, fewer than a third of all families are married couples in which the wife does not work outside the home. This meansthat a majority of American families face—and in consequence the Nationfaces—different opportunities and different challenges from those of a society of "traditional" families.The changes in the American family, viewed over the entire span of the20th century, have been dramatic (Table 5-1). In 1900, for example, aboutDigitized for FRASERhttp://fraser.stlouisfed.org/Federal Reserve Bank of St. Louis165
TABLE 5-1.— Contrasting American Families Then and NowItemHouseholds by type (percent)Family householdsMarried coupleMale householder, no wife presentFemale householder, no husband presentNonfamily householdsAverage household size (persons)Households with seven or more people (percent)Living arrangements of children by family status (percent)4Two-parent farm familyTwo-parent nonfarm familyFather breadwinner, mother homemakerDual earnerSingle-parentNot living with parentMales and females by marital status (percent)Males aged 15 and 61.241(5)43295244428468.92.04.224.958.08.22.5Never marriedFemales aged 15 and overMarriedDivorcedWidowedNever 4.910.310.224.7Median age at first marriageMenWomen25.921.922.820.326.725.0Life expectancy at birth (years)MenWomenInfant mortality rate (deaths per 1,000 live 215.418.431.952.216.026.853.120.0WidowedLabor force participation rate of women (percent)Women in the labor force by marital status (percent)SingleMarriedWidowed, divorced, or separated1331.279.47.2Infant mortality rate is for 1915.Labor force participation rate of women is for 1999.Not available.Data for 1900 and 1950 are from Donald J. Hernandez, America s Children, The Russell Sage Foundation, 1993.Less than 2 percent and included in nonfarm totals.Sources.- Department of Commerce (Bureau of the Census); Department of Labor (Bureau of Labor Statistics); andDepartment of Health and Human Services (Centers for Disease Control and Prevention), except as noted.80 percent of children lived in two-parent families with a mother or stepmother who worked on the farm or at home. Fewer than 10 percent ofAmerican children lived in one-parent families. The typical home had few oftodays conveniences (only 8 percent of dwelling units had electricity in1907), and many women sewed their own clothes and gave birth in thehome rather than in a hospital. Women early in the century marriedyounger, had more children, and died younger than women today. Ten percent of children died in infancy, and average life expectancy for both men166 I Economic Report of the PresidentDigitized for FRASERhttp://fraser.stlouisfed.org/Federal Reserve Bank of St. Louis
and women was less than 50 years. The average household had close to fivemembers, and a fifth of all households had seven or more. Job opportunitiesfor women who did not live on farms were limited as much by custom as byphysical demands: only a fifth of all women worked for pay, and those whodid were mainly single and poor.The average family today enjoys many advantages that its counterpart of acentury ago did not. As we have seen in earlier chapters, the material standard of living of the average family is much higher now than it was then.People are more likely not only to live longer but to remain healthy intoretirement as well. It is partly because of these very advances, however, thatfamilies today face a different set of challenges than did families 100 yearsago. In particular, the expansion of opportunities for women to work for pay,and the greater desire of women to seek such work, have added a new challenge to the perennial one of having adequate resources to meet familyneeds. That new challenge is how to balance the material gains from morehours of paid employment against the desire to reserve time for the responsibilities and enjoyments of family life.This chapter examines these two challenges. It begins with an overview ofsome of the key trends that have created the modern American family: therise in female labor force participation, changes in family formation and dissolution, and improvements in health and longevity. It then explores theemergence of a diverse set of family types, focusing on differences in incomesand in time spent at work. The remainder of the chapter explores the challenges these different kinds of families face—and their policy implications.This discussion is organized in two parts. The first discusses the "moneycrunch": the financial constraints that still burden many families despite theremarkable growth in the American standard of living. This problem is morelikely to confront single-mother families and one-earner couples than twoearner couples. The second part discusses the "time crunch": the shortage oftime to devote to family needs that results from the increased participation ofparents, especially mothers, in the paid labor market. This problem affects avast number of families, including many for whom the money crunch is lesspressing. The chapter also discusses recent favorable trends in family incomesand reviews some of the Administration s policies designed to address themoney and time crunches.Key Trends Shaping the American FamilyAmong the many trends that have affected the American family over thecourse of the century, three have been particularly important. The first is therise in female participation in the labor force as more opportunities haveDigitized for FRASERhttp://fraser.stlouisfed.org/Federal Reserve Bank of St. LouisChapter 5 I 167
opened up for women to work and as more women have taken advantage ofthose opportunities. The second is not a single trend but a set of relatedchanges in how families form and dissolve, which have contributed to thegrowing prevalence of single-parent families. The third is improvements inhealth and life expectancy that have made care for older relatives—and providing for their own retirement—increasingly important issues for heads offamilies today. Many other kinds of households—including people livingalone—are also part of American society and face challenges of their own,but this chapter focuses primarily on those challenges that affect familieswith children.Female Labor Force ParticipationWomen have always worked, whether on the family farm, in the home, orin the paid labor force. What distinguished the 20th century was theenormous increase in the proportion of women who work for pay. In 1999about three-fifths of the female population aged 16 and over were in thelabor force (either employed or looking for work). This is three rimes as high asthe female labor force participation rate in 1900. And the participationrate of women aged 25-44—those most likely to be balancing work andchild rearing—has risen severalfold, from less than 20 percent in 1900 toover 75 percent today (Chart 5-1). The participation rate of women in thisage group with children under age 18 has been somewhat lower than theoverall rate but has shown a similar pattern of increase. Over the past 25years the share of working mothers in this age group who were employedfull-time has been roughly 71 percent.Many factors have contributed to this growth in women's participation inthe paid labor market, including increases in education and wages forwomen, the opening up of more opportunities for women to work, andchanges in family structure. As a result of higher labor force participationrates and later marriages, a larger proportion of women than ever beforeexperience a period of independent living and employment before marriage.This gives them greater attachment to the labor force and increases thechances that they will continue to work, or return to work, after they marryand start a family.Family Formation and DissolutionMarriage remained a fairly universal experience throughout the 20th century. Among the population 15 years old and over, the proportions of bothmen and women who are married are roughly the same today as a centuryago, although lower than in the 1950s and 1960s. Only 6 percent of womenaged 45-64 in 1998 and 12 percent of women aged 35-44 had never been168 I Economic Report of the PresidentDigitized for FRASERhttp://fraser.stlouisfed.org/Federal Reserve Bank of St. Louis
Chart 5-1 Labor Force Participation of WomenRoughly four-fifths of younger women are in the labor force today, whereas roughly four-fifthswere not in 1900. Women with children are also working in greater numbers.Percent90Mothers aged 25-44with youngest childunder 18 years old1900191019201930194019501960197019801990Note: Annual data are available only since 1942. Dots indicate decennial census data.Sources: Department of Commerce (Bureau of the Census) and Department of Labor (Bureau of Labor Statistics).married. However, one study found that women today are spending a smallerfraction of their adult lives married than did their counterparts a few decadesago. A much larger proportion of children are being born to unmarriedmothers. As a result, the share of children living in one-parent familiesincreased from 9 percent in 1900 to 28 percent in 1998.Several strands of evidence suggest that people are spending a smaller fraction of their lives married than in 1900. First, people are marrying slightlylater. In 1900 the typical first marriage was between a woman of 22 and aman of 26; now the typical bride is 3 years older and the groom nearly a yearolder. Second, divorce rates are much higher today than at the beginning ofthe century. In 1900, among those aged 35-54, widowhood was far morecommon than divorce. Over the century, the probability of being a widow inthis age range declined markedly, while the probability of being divorced rose(Chart 5-2). The divorce rate, which jumped from around 10 per 1,000married females per year in the mid-1960s to more than 20 per 1,000 in themid-1970s, has drifted down slightly since then but remains high. A thirdreason why people spend a smaller fraction of their lives married is that lifeexpectancy is longer today relative to the typical duration of a marriage. Thenet result of all these forces is that only 56 percent of the population aged 15and over are married today, rather than 68 percent as in 1960. Thus it isprobably not surprising that the proportion of children living in singleparent households has risen dramatically.Digitized for FRASERhttp://fraser.stlouisfed.org/Federal Reserve Bank of St. LouisChapter 5 I 169
Chart 5-2 Shares of Population Aged 35-54 Who Are Widowed or DivorcedA smaller share of middle-aged Americans, men and women, are widowed now than in 1900,but far more of both sexes are divorced.Percent1816 I-Women,divorced14 'Women, widowedMen, 8Source: Department of Commerce (Bureau of the Census).The increased prevalence of single-parent households is also related to therise in out-of-wedlock births. For unmarried females aged 15-44, the numberof births per 1,000 women increased dramatically from 7.1 in 1940 to 46.9in 1994, but it has since stabilized and begun to decline, reaching 44.3 in1998 (Chart 5-3). In contrast, this measure of the birth rate among marriedwomen has been dropping since the baby-boom of the 1950s and 1960s,although it remains nearly twice that of unmarried women. As a result ofthese trends, the share of all births that were to unmarried women of all agesincreased eightfold, from 4.0 percent in 1950 to 32.8 percent in 1998,although this figure has begun to level off in recent years. Some of thisincrease reflects lower marriage rates generally, and some reflects the rapidincrease in the late 1980s and early 1990s in out-of-wedlock births, including those to teens. (The Administrations efforts to reduce teen pregnancy arediscussed later in this chapter.)Life Expectancy and HealthThe life expectancy and health of Americans increased dramatically over the20th century. Major public health initiatives (such as immunization campaigns,better sewage systems, and education about hygiene) as well as medical advances(from antibiotics to pacemakers to bone marrow transplants) have led to the virtual eradication of numerous diseases and conditions that once contributed tohigh death rates and low life expectancy. For example, technological innova170 I Economic Report of the PresidentDigitized for FRASERhttp://fraser.stlouisfed.org/Federal Reserve Bank of St. Louis
Chart 5-3 Birth Rates for Married and Unmarried FemalesThe share of out-of-wedlock births soared after 1960 but have recently stabilized. Meanwhilethe birth rate for married females has fallen to about twice that for unmarried females.Live births per 1,000 femalesPercent of all births18040Birth rate for marriedfemales, 15-44(left scale)160Births to unmarriedfemales (right scale)1403530120251002080Birth rate for unmarriedfemales, 15-44 v(left 980198519901995Note: Annual data for birth rate for married females are available only since 1960; dots indicate previous years withavailable data.Source: Department of Health and Human Services (Centers for Disease Control and Prevention).tions, better obstetrical care and nutrition, more widespread access to prenatalcare, and greater use of antibiotics all contributed to tremendous improvementsin the health of mothers and infants. The infant mortality rate dropped by morethan 90 percent over the century, from 99.9 per 1,000 live births in 1915 to 7.2per 1,000 in 1998. The maternal mortality rate dropped similarly: whereas in1900 more than 80 women died from pregnancy-related complications forevery 10,000 live births, by 1997 this rate had fallen to less than 1 death forevery 10,000 live births—more than a 98 percent decline. Advances also havebeen seen in other areas. Death rates from coronary disease have declined by 51percent since 1972, improved sanitation has dramatically reduced typhoid andcholera in the United States, and the widespread use of vaccines has eliminatedsmallpox and polio.These improvements have meant longer life spans for most Americans.Over the century, the average life span in the United States increased by30 years, and one study attributes five-sixths of that increase to advances inpublic health such as vaccinations and food safety. Life expectancy at birthfor a woman rose from 48.3 years in 1900 to 79.4 years by 1998. For men itrose over the same period from 46.3 years to 73.9 years. Older Americansnow have longer remaining life expectancies as well. Whereas the average 60year-old white man in 1900 could expect to live almost to age 75, by 1998 aman of that age could expect to live almost to age 80. Combined with therecent declines in fertility behavior, these changes in life expectancy have ledDigitized for FRASERhttp://fraser.stlouisfed.org/Federal Reserve Bank of St. LouisChapter 5 I 171
to an increasing share of the population that is elderly—a trend that will continue as the baby-boom generation ages.Increasing Diversity Across FamiliesIncome and the time to enjoy it are two key components of economicwell-being. In principle, the strong growth in productivity and the resultinggrowth in real wages over the past century, described in Chapter 1, couldhave allowed material standards of living to increase while simultaneouslyallowing families to work shorter hours. But in fact, the substantial increasein female labor force participation and the increase in the proportion ofhouseholds headed by single females mean that there are more families withworking women, and many women are working more hours. These trendsalso mean that there is now a greater diversity in family structure as well asdifferences in incomes and hours of work among family types.Diversity in Family StructureTraditional one-breadwinner, one-homemaker married couples have beendeclining as a share of all families, from 67 percent in 1952 to 27 percent in1999 (Chart 5-4). Rising female labor force participation has increased theproportion of all married-couple families in which the wife works, and theseChart 5-4 Composition of Families by Family StructureThe share of "traditional" families with a nonemployed wife has declined by more than half since1950, whereas that of two-earner families has more than doubled.Percent of all families80Married couple,* s. . wife not in paid labor force70605040Married couple,wife in paid labor force302010 .Female head, husband absent1949195419591964196919741979Note: A family is two or more related individuals who reside together.Source: Department of Commerce (Bureau of the Census).172 I Economic Report of the PresidentDigitized for FRASERhttp://fraser.stlouisfed.org/Federal Reserve Bank of St. Louis1984198919941999
now account for roughly half of all families. Reflecting the trends in marriageand divorce discussed above, the share of all families headed by a singlehouseholder with no spouse present (predominantly single-parent families)increased from 13 percent to 23 percent between 1949 and 1999. Althoughmost children living in single-parent families live with their mothers, theshare of single-parent families headed by fathers has more than doubled since1975 and stood at 19 percent in 1999. It is estimated that more than a thirdof all children do not live with their biological fathers (Box 5-1).Box 5-1. The Importance of FathersAlthough the proportion of single-parent families headed by thefather is rising, the mother has typically been the custodial parent insuch families. For this reason, and because of the higher incidence ofpoverty in female-headed families, the discussion of single-parentfamilies in this chapter focuses on single mothers. An important issuefor such families is the link between children's well-being and theabsence of the father.It is ectimated that 36 percent of American children live apart from theirbiological fathers; about 40 percent of children in fatherless householdshave not seen their fathers in at least a year. Before they reach age 18,more than half of America's children are likely to have spent a significantportion of their childhood living apart from their fathers.Yet there is strong evidence suggesting that the presence of a fathermatters: Children under age 6 who live apart from their fathers are aboutfive times as likely to be poor as children with both parents athome. Girls without a father in their life are two and a half times as likelyto get pregnant and 53 percent more likely to commit suicide. Boys without a father in their life are 63 percent more likely to runaway and 37 percent more likely to abuse drugs. Children without father involvement are twice as likely to drop outof high school, roughly twice as likely to abuse alcohol or drugs,twice as likely to end up in jail, and nearly four times as likely toneed help for emotional or behavioral problems than those withfather involvement.The absence of a father has effects beyond those on his own children:it can affect communities as well. About 4.5 million children in 1990resided in predominantly fatherless neighborhoods in which more thanhalf of all families with children were headed by single mothers.Digitized for FRASERhttp://fraser.stlouisfed.org/Federal Reserve Bank of St. Louiscontinued on next page.Chapters I173
Box 5-1. — continuedAlthough most fathers can afford to pay child support (an estimated74 percent of noncustodial fathers have incomes above the povertylevel), about 2.8 million men are "dead-broke," noncustodial fathers,most of whom do not pay child support. Administration efforts aimedat helping these fathers to work and support their children are detailedlater in this chapter.Increasing life expectancy has also changed the structure of the family. Forexample, over 70 percent of adults aged 30-54 in the early 1990s had livingrelatives who spanned three or more generations, and over 40 percent ofadults aged 50-59 had living family members from four or more generations.In addition, nearly 2.4 million families now have more than two generationsliving under one roof. Longer life expectancy has meant that more grandparents are able to watch their grandchildren grow to adulthood. And youngergenerations are facing caregiving responsibilities for older relatives. A 1997survey estimated, for example, that 22 percent of all U.S. households providecare for an elderly person.At the same time, grandparents have also become more important as caregivers—including primary caregivers. Over the last three decades, for example, the share of children under age 18 living in a household headed by agrandparent has risen by more than 70 percent (Chart 5-5). Most of theChart 5-5 Grandchildren in Grandparents' Homes by Presence of ParentsA larger share of children today live in households headed by a grandparent. The proportion ofthese children who share the home with neither of their parents has increased since 1990.Percent of children under 18 who live with a grandparentS Neither parent presentD Only father present Only mother presenta Both parents present19701980Source: Department of Commerce (Bureau of the Census).174 I Economic Report of the PresidentDigitized for FRASERhttp://fraser.stlouisfed.org/Federal Reserve Bank of St. Louis19901998
increase in this share during the 1990s was from an increase in the share ofchildren living in households with neither parent present. Between 1980 and1990, by contrast, the increase came mostly from children living in grandparent-headed households with just a single parent present. The share of suchhouseholds with a single father present, although small, continued to grow inthe 1990s.Consistent with the focus of the chapter, this discussion has emphasizedfamily types likely to have children present. It is important to recall, however, that American households cover a much wider range of diversity than this(Box 5-2).Diversity of Income and Hours of WorkAn examination of income growth among families with children by family type reveals important differences among two-earner married couples, oneearner married couples, and families headed by single females. To someextent these differences represent choices about how many hours to work andhow many to leave free for other things. But they may also reflect underlyingdifferences in education or other factors that affect earnings opportunities.Box 5-2. The Diversity of American HouseholdsThe Census Bureau defines a family as two or more people relatedby birth, marriage, or adoption who reside together. A household, bycontrast, is defined as any person or group of people who occupy asingle housing unit.Thus households include single people and groupsof unrelated people who reside together.In 1970 the proportion of households fitting the traditional definitionof a family (a husband, a wife, and their children) was 40 percent; by1998 only 25 percent of households fit that definition. The number ofAmericans living in unmarried-partner households is large and growing rapidly. From 1994 to 1998 the number of married-couple households increased by 2 percent, while the number of unmarried-partnerhouseholds increased 16 percent. In 1998 about 1.7 million, or 1.6 percent, of households were same-sex partnerships.The fraction of individuals choosing to live together outside of a formal marriage rose dramatically in the second half of the 20th century.One study reports that only 3 percent of women born between 1940and 1944 had lived in a nonmarital cohabitation by age 25, whereas forwomen born 20 years later, 37 percent had cohabited by that sameage. In fact, despite lower marriage rates and a later age of first marriage now than several decades ago, evidence indicates that individuals are still forming coresidential relationships at about the same pointin their lives.Digitized for FRASERhttp://fraser.stlouisfed.org/Federal Reserve Bank of St. LouisChapter 5 I 175
For the past 50 years, the median income of two-earner couples has beenhigher than that of one-earner couples, which in turn has been higher thanthat of families headed by a single female (Chart 5-6). Moreover, the gapbetween the median income of two-earner couples and that of the other family types has widened, both in absolute dollars and in percentage terms.Chart 5-6 Median Family Income by Family StructureThe median income of the typical two-earner married couple has exceeded that of other familytypes for at least half a century and continued to grow strongly after 1973.Thousands of 1998 dollars70Married couple,wife in paid labor force6050Married couple, wifenot in paid labor force40With cnildren30Single female head- - -xWith te: A family is two or more related individuals who reside together.Source: Department of Commerce (Bureau of the Census).Although many measures of income inequality have stopped rising in recentyears, the real median income of married-couple families where the wife isnot in the paid labor force is less than three-fifths that of married-couplefamilies where the wife works for pay. Recent increases have brought the realmedian income of female-headed families in 1998 above its previous peak in1979, although that income is only a little more than a third the median fortwo-earner couples. To a great extent, of course, these differences reflect factors other than family type. As emphasized below, wives in two-earner couples are likely to have greater earnings opportunities than wives in singleearner couples. And single mothers tend to be younger and less educatedthan married mothers, with the result that their earnings are likely to belower as well.Median incomes provide one perspective on differences in income by family type, but they necessarily conceal the extent of income variation withineach family-type grouping. Among families with children, there is considerable overlap between the distributions of income for each family type, par-176 I Economic Report of the PresidentDigitized for FRASERhttp://fraser.stlouisfed.org/Federal Reserve Bank of St. Louis
ticularly in the lower income ranges (Chart 5-7). The distribution of femaleheaded families with children, however, is more concentrated in the lowerincome range.Chart 5-7 Income Distributions for Families with Children by Family Structure, 1998A larger share of two-earner couples have high incomes, while the distribution of female-headedfamilies is skewed toward lower incomes.Percent30 Married couple, wife in paid labor force25S Married couple, wife not in paid labor forceD Single female head201510!l102030405060708090100 110 120 130 140 150 160 170 180 190 200andoverFamily income (thousands of dollars)Note: Data are for a sample of civilian families with primary female aged 18-55 and children under 18. Theincomes on the horizontal axis represent ranges of income (e.g. 10 is 10,000 - 19,999). A family is two ormore related individuals who reside together.Source: Council of Economic Advisers tabulation of Current Population Survey data.The income differences across families shown in Chart 5-7 are due largely todifferences in earned income from employment, not differences in wealth ortransfer payments (such as welfare payments). In 1998, wage and salary earningsrepresented 87 percent of income for the average married-couple family withchildren and 69 percent for the average female-headed family with children.Differences in hours worked are a major factor accounting for differencesin income across family types. Not surprisingly, dual-earner couples devotemore total hours to work than the other family types, on average, and havethe highest concentration of families in the portion of the distribution withthe most hours worked (Chart 5-8). Among single-earner family types, husbands in single-earner couples work more hours on average than singlemothers.The Rising Earnings of Women with ChildrenThe typical mother today now contributes significantly more earnings tofamily money income than did her counterpart several decades ago. Themedian earnings of single mothers with children rose from 4,800 to 12,000 (in 1998 dollars) between 1968 and 1998, and among working sin-Digitized for FRASERhttp://fraser.stlouisfed.org/Federal Reserve Bank of St. LouisChapter 5 I 177
Chart 5-8 Distribution of Annual Hours Worked by Families with Children, 1998Within each family type, the modal number of hours worked is about 2,000 per worker. Manytwo-earner couples work 4,000 hours a year or more, leaving limited time for other activities.Percent Married couple, wife in paid labor forceH Married couple, wife not in paid labor forceD Single female 000iJL4,5005,0005,500Annual hours of husband and wife combined (or of unmarried female)6,000andoverNote: Data are for a sample of civilian families with primary female aged 18-55 and children under 18. Thehours on the horizontal axis represent ranges of hours (e.g. 0 is 0 - 499). A family is two or more relatedindividuals who reside together.Source: Council of Economic Advisers tabulation of Current Population Su
Life expectancy at birth (years) . Labor force participation rate of women (percent) Women in the labor force by marital status (percent) Single Married Widowed, divorced, or separated (3) (3) (3) (3) (3) 4.8 20.4 41 43 2 9 5 54.6.3 4.6 40.3 57.0.5 11.2 . older. Second, divorce rates are much higher today than at the beginning of the .