Transcription
SG OVCRAMSDEPANBJ A C EIOF FOffice of Justice ProgramsNT OF JMEUSRTCETIU.S. Department of JusticeIJJO F OJJ D P B ROJ US T I C E PNational Institute of JusticeNational Institute of JusticeProgramFocuThe Chicago PoliceDepartment’s InformationCollection for AutomatedMapping (ICAM) Programs
PROGRAM FOCUSThe Chicago Police Department’sInformation Collection for AutomatedMapping (ICAM) Programby Thomas F. RichTo better understand the nature and extent ofcriminal and social problems in the community andimprove allocation of resources, a growing number ofcrime control and prevention organizations are turningto computerized mapping. A recent National Instituteof Justice (NIJ) study reported that officials foundcomputerized mapping to be a valuable tool that had not yet reached itsfull potential.1 Because mapping software has a unique ability to overlaydisparate data sets (e.g., citizencomplaints; police incident data; thelocations of specific sites, such asabandoned buildings or liquor stores;HighlightsComputerized mapping is emerging as aneffective tool to help police departmentstrack criminal activity in neighborhoods.Combined with a technique known asgeocoding (which verifies addresses andlinks other geographic information withthem), computer mapping software cancombine data sets to provide a multidimensional view of crime and its potentialcontributing factors.Although many large police departmentsare using this technology, the ChicagoPolice Department (CPD) has put togetherone of the most accessible and easy-to-useprograms in the Nation. Since its implementation in May 1995, the InformationCollection for Automated Mapping(ICAM) program has been praised by thecity’s police officials, beat officers, andthe public.Because the mapping program was created in conjunction with the Department’scommunity policing program, the mapshave been an effective way to work withresidents on addressing problems in theirneighborhoods. The maps are expected tobecome regular features of neighborhoodbeat meetings with police officers.2 National Institute of JusticeUser FriendlyICAM’s unique easy-to-use design can betraced to the mandate of the ICAM coproject coordinator, Deputy Superintendent Charles Ramsey, who said the mapping system should be “so user-friendly,even I can make a map.” The systemdesigners also factored in the needs ofofficers. A CPD detective and an officerspent several weeks at a precinct stationfinding out what officers wanted from thecomputerized mapping system.Using a series of clicks made with a computer mouse, ICAM can produce a map ofreported offenses of a particular type in aspecified area, or it can produce a chart ofthe 10 most frequently reported offensesin an area. A keyboard is not required forthe ICAM system.The computer hardware and software forICAM were developed with a 1 milliongrant from the Illinois Motor Vehicle TheftPrevention Council. The council understood that computer mapping could permit geographic analysis of the relationship between the locations of a car’s theftand its subsequent recovery—thus,potentially contributing to significant reductions in motor vehicle theft and savingmillions of dollars for the insuranceindustry.Planned EnhancementsICAM currently is not fully accessible tothe public because no program exists toblock out confidential information, suchas the names and addresses of victims. Amodified version of ICAM is being developed that will allow the public to generatemaps and lists of crimes in their neighborhoods without divulging confidential data.ICAM is currently limited in its ability toaid crime analysis. For example, an officercannot generate a map of calls for serviceor arrests. Major revisions, being madeunder an initiative known as ICAM 2, willaddress these and other issues. For example, the enhanced system will be able tomap reported offenses within specifieddistances of a location (e.g., within 1,000feet of a school) and track changes incrime over time. In addition, a new citywide911 emergency network will allow officers to access the data bases of districtsthroughout the city.
PROGRAM FOCUSand census data), computerized mapscan provide a multidimensional overview of crime and its potential contributing factors.Computerized mapping is particularlyuseful for police departments withcomputer-aided dispatch and recordsmanagement systems, which storeand maintain calls for service, aswell as incident, arrest, and otherdata that are potentially mappable.These systems typically have a geocoding feature that verifies addressesand associates them with other geographic information, including policereporting areas, beats, and districts.Before implementing computerizedmapping systems, however, policedepartments are faced with a numberof issues: The costs of the necessary hardware and software can be substantial. Commercially available mappingsoftware is more complicated andharder to learn than word processingor spreadsheet software and oftenrequires special multiday trainingcourses. This limits the accessibilityof the mapping software and oftenmakes police departments dependenton a small number of specially trainedpersons. The data to be mapped must beavailable on an ongoing basis to ensure that maps are timely and up-todate. Unless the mapping system canuse electronic data that already existin the department’s computer-aideddispatch or records management systems, substantial data entry costs willbe incurred when the data are transferred to the mapping system. Procedures are required to ensurethat addresses of data to be mappedare accurate (e.g., street names arespelled correctly). Ideally, an addresswould be verified whenever it is entered into a computer system. However, it may be necessary, first, todevelop an accurate base map; policedepartments may want to undertakethe time-consuming, albeit one-time,task of editing computerized streetfiles of their jurisdictions. The streetfiles can be obtained from the U.S.Bureau of the Census or commercialgeographic data vendors, but eventhese files may have missing or unnamed streets or incorrect addressranges.The Chicago Police Department(CPD) has overcome these obstaclesand put together a mapping system—Information Collection for Automated Mapping (ICAM)—that canbe used by police officers throughoutthe agency. While a growing numberof law enforcement agencies havehighly sophisticated mapping systems(see “Mapping Systems in Other Police Departments”), it appears thatonly CPD has a system that enablesofficers with little or no special training to create and quickly retrieveMapping Systems in Other PoliceDepartmentsNumerous police departments around thecountry use mapping software, in mostcases, to support crime analysis activities.The Dallas and Los Angeles Police Departments are among the more active usersof this technology.Dallas. The Dallas Police Department hasdeveloped what might be called a “textonly” version of ICAM. Located at eachpolice substation, a “walk-up-and-use”system produces a list of reported offensesthat meet specified criteria. Once a list isgenerated, the user can export it to a general purpose mapping software package(the Department uses MapInfo) that can beused to map the list of offenses. A “handful” of officers in the Department—andat least one civilian at each substation—know how to use MapInfo.2Corporation to develop a custom softwareapplication that allows users to generatemaps of reported offenses meeting specified criteria. The options for querying thedata base of reported offenses are extensive—a user can specify crime types, dateand time ranges, modus operandi, pointsof entry/exit, property descriptions,weapon descriptions, suspect descriptions,vehicle descriptions, victim descriptions,and narrative key phrases. The application is installed at all 18 area stations,where it is used by the area crime analyst.The analyst uses the application to produce crime alert bulletins, “in-custody”bulletins, and “wanted” bulletins. The application is also used to enhance cases, torespond to officers’ requests for crimemaps, and to generate crime maps for areabiweekly tactical planning meetings.3Los Angeles. The Los Angeles PoliceDepartment contracted with MapInfoProgram Focus 3
PROGRAM FOCUStheir own maps of crime and community conditions and share them withthe community. This Program Focusdiscusses ICAM in terms of its development and implementation; currentfeatures, usage, and impact; plannedenhancements; and implications forother police departments.The Context forICAM: CommunityPolicingICAM was developed as part of CPD’sfar-reaching and ambitious communitypolicing strategy. Unlike many othercommunity policing programs that arelimited to a single unit in the department, the Chicago Alternative PolicingStrategy (CAPS) is departmentwide.The strategic plan for reinventing CPDdescribes CAPS as a “wholesale transformation of the department, from alargely centralized, incident-driven,crime suppression agency to a moredecentralized, customer-driven organization dedicated to solving problems,preventing crime, and improving thequality of life in each of Chicago’sneighborhoods.”4 In fact, CAPS isreally a city program with strong support from the Mayor’s office and closeinvolvement of city agencies, whichhave been directed to give top priorityto “CAPS service requests” that affectcrime and neighborhood safety.CAPS was launched in April 1993in 5 prototype police districts; it hassince been adopted in all of the city’s25 districts. CAPS revolves aroundthe beat officer, who is assigned for4 National Institute of Justicea minimum of 1 year to a single beatwithin his or her district.5 Beat officersare instructed to focus on problemsolving, and dispatch procedures havebeen changed to limit the time theyspend responding to calls for serviceoutside their assigned beats.6 Beatofficers are also required to attendregularly scheduled “beat meetings”with community residents.The evaluation of CAPS, partiallyfunded by NIJ, has focused on theprogram’s implementation in the fiveprototype districts.7 The 1995 reportstated:[Many] prototype district residentsdetected positive changes in policing during its first year of operation, and residents of most of theprototypes thought the police hadgrown more responsive to community concerns. There was alsoevidence that the program led to asignificant decline in crime-relatedproblems in three prototypes, drugand gang decline in two districts,and significant decreases in levelsof physical decay in two areas.Many of the changes in perceptions of crime problems in theprototype areas were mirroredby declines in officially reportedcrime and survey measures ofvictimization.8Wesley Skogan, director of the evaluation effort, called the results of CAPS“among the most substantial I’veseen” compared to other communitypolicing programs in the country.9ICAM’s Relationshipto CAPSIn 1995, officers in all of Chicago’s25 police districts began using ICAMto better understand the problems intheir assigned areas and to developstrategies to address them. The officers also began to share ICAM mapswith residents, improving policecommunity relations and giving citizens a chance to help police cut downon crime by providing data for jointpolice-community problem-solvingefforts. Developing ICAM was thusan integral part of Chicago’s community policing approach.The superintendent’s strategicvision for ICAM. The importance ofusing and sharing information throughtechnology was a key element in thesuperintendent’s 1993 plan for implementing CAPS:The Department must continue toseek out and apply new technologies, as it has done in the past withAFIS, Live-Scan, and other systems. New technologies must gobeyond finding better ways todetect offenders and respond tocrimes: they must provide theinformation and analytical capabilities that help police officersand the community identify andsolve problems and, therefore,prevent crimes.Information is power. To supportour new, decentralized approachto decisionmaking, the Department must establish a new, decentralized approach to data collection and analysis as well. Systems
PROGRAM FOCUSshould be put in place to giveofficers the information theyneed, when and where they needit. Where appropriate, these systems should also provide community members with up-to-datestatistical information to helpthem in identifying and targetingproblems.10The superintendent also emphasizedthe importance of accessibility as afeature of any new information system: “In many cases, computers willneed to be moved out of the backroom, where they have served asspecialized tools, and into the operational levels of our organization,where they can become more flexibleand far-reaching tools of the police.”11Developmentof ICAMUsing the superintendent’s strategicvision as a guide, Officer JonathanLewin (24th District) and DetectiveLarry Soltysiak (Area 4 Division) tookon the challenge of developing a system that would provide useful information directly to the beat officer. Atthe time, beat officers relied on handwritten offense reports to determinethe level of criminal activity in theirassignment areas, which took days toanalyze in any detail. Computerizedincident data were kept on CPD’smainframe, but the system was accessible only to trained computeroperators.CPD’s prior experience with mapping. Developing ICAM was notCPD’s first attempt to implementcomputerized mapping. Two earliercollaborations between researchersand CPD had demonstrated both thefeasibility and utility of such an approach. The first effort in 1988, anNIJ-funded project, involved CPD,the Chicago Alliance for Neighborhood Safety (CANS)—an umbrellaorganization that trains communityresidents in problem solving)—andresearchers at the University of Illinoisat Chicago and Northwestern University in creating a rudimentary mapbased crime analysis system in oneCPD district. In their report, the researchers stated that the system had animpact in a number of areas, including:[In] combining data from differentsources, in providing an institutional memory of a beat, in providing detectives with the abilityto search for patterns more readily,in permitting proactive management by the district commander,and in improving community relations between the police andcommunity organizations.12Warren Friedman, executive directorof CANS, believes that initiation ofthe ICAM project was a particularlysignificant step toward obtainingCPD acknowledgment of the importance of working with communityorganizations.13Later, in 1991, researchers at theIllinois Criminal Justice InformationAuthority and police officials inCPD’s Area 4 teamed up to implementa map-based system for studying streetgang crime.14 The study helped identify those areas with the highest risk ofgang-related violence. This effort wasnotable because it combined policedata with a wide variety of communitydata, including the location of rapidtransit stops, schools, youth organizations, public housing facilities, parks,liquor stores, and demographic data.15These maps could depict not only“hot spots” and other locations wherecrimes were committed but also anarray of associated and possibly contributing factors.To build on these previous efforts,in 1993 Officer Lewin and DetectiveSoltysiak first spent several weeksin the 11th District (Area 4) interviewing beat officers and detectivesand testing various formats to determine the presentation and type of information that would be most useful toofficers and detectives. The consensuswas that maps—“simple, clear, andeasy-to-read”—would be the most useful format to display crime information.Obtaining funding. However, oneobstacle to developing the computerized mapping system was cost. Fora comprehensive system to be put inplace, money was needed to pay forthe hardware and software at all 25police districts and specialized CPDunits at the area level, which includeda work station for running ICAM, aserver for network maintenance andsupport, and a laser printer.CPD applied for and received a 1million award from the Illinois MotorVehicle Theft Prevention Council(IMVTPC) to buy the necessary equipment. IMVTPC, created in 1991 bythe insurance industry, envisionedcomputerized mapping as an effectivetool for auto theft investigators because it would allow a geographicanalysis of the relationship betweenthe location of a car theft and theProgram Focus 5
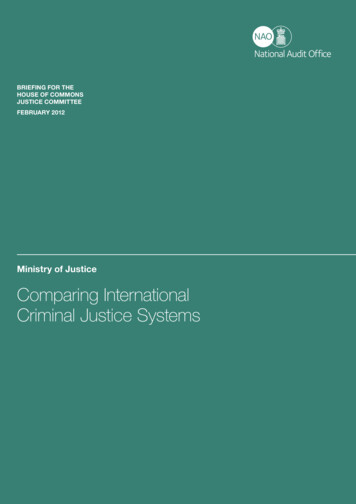
PROGRAM FOCUSlocation of the car’s recovery.IMVTPC supports a variety of vehicle theft prevention programs; forexample, they provided funds formobile data terminals for CPD patrolcars in 1992, which enabled patrolofficers to query State and nationalstolen vehicle files.If computerized mapping could reduce the number of auto thefts inChicago—where two-thirds of theState’s auto thefts occur—IMVTPCbelieved it could save the insuranceindustry millions of dollars each year.IMVTPC made the award even withthe understanding that the mappingsystem would cover all crimes, notjust those related to automobiles.16From prototype to implementation.With funding secured, Lewin andSoltysiak, then joined by Gene Chin,a senior systems analyst in CPD’sData Systems Division, began developing the mapping system. But afterattending a workshop on using computerized mapping for crime analysisat the Illinois Criminal Justice Information Authority in August 1993, theteam realized that although many police departments had sophisticatedcrime mapping systems, no department had a system that was accessibleto beat officers.17 Thus, the team hadto create a unique prototype. In latesummer 1993, the development teamset up its first model in CPD’s 24thDistrict. The results were disappointing. Beat officers found the systemtoo complicated to use, and the 10 to15 minutes required to generate a mapwas considered unacceptable.6 National Institute of JusticeThen in summer 1994 CPD DeputySuperintendent and CAPS Co-ProjectDirector (then Deputy Chief) CharlesRamsey made an unannounced visitto the 24th District. Ramsey issued achallenge to the development team:Implement a system “that is so userfriendly even I can make a map.”18The team focused its efforts on developing a system that, in terms of easeof use, more closely resembles anautomated teller machine (ATM) thanstandard office automation software.In addition to changing ICAM’s hardware and software platforms,19 theteam decided that ICAM would notrequire use of a keyboard (in fact,ICAM PC’s do not even have keyboards). Instead, all user selectionsand commands would be issued witha mouse.In October 1994, an ICAM prototypewas set up in the 24th District. ByMay 1995, ICAM was installed in all25 districts.ICAM FeaturesWhen the ICAM computer is turnedon, the main screen automaticallyappears (see “ICAM’s QueryScreens”). The two main tasks thatICAM performs are indicated in theboxes containing the “Do It!” buttons:ICAM can produce a map of reportedoffenses of a particular type in an area,or it can generate a list of the 10 mostfrequently reported offenses in a beat.ICAM allows a user to generate a mapin as few as three mouse clicks. Asimple query can be modified in anumber of ways, each of which requires a few additional mouse clicks.As shown in exhibit 1, page 8, the usercan change the default query parameters by specifying one or more secondary classifications of the primaryoffense, changing the desired geographic area, changing the date andtime range, or specifying a particulartype of location.The ability to map offenses meetingthese criteria is a standard feature ofany map-based crime analysis system.What is unique about ICAM is theway in which the user formulates thequery. By default, ICAM maps offenses occurring in the past 10 days.However, any date and time range canbe selected (e.g., the past 2 days ormidnight to 8 a.m. during the pastmonth). The simplicity of the methodfor selecting a date and time rangeillustrates the efforts made by theICAM development team to ensureICAM’s accessibility to officers.Since keyboards are not attached toICAM PC’s, the traditional way ofspecifying a date and time range—typing in the starting and ending datesand times—could not be used. Instead,a calendar screen is displayed (see“ICAM’s Query Screens”), and theuser simply clicks on the desiredmonth, day, and year for both thestart and end dates. There is a similarscreen for selecting the time range.After the user clicks “Do It!,” ICAMruns the query against the offensedata file and displays on the screenboth a map and a tabular view of theoffenses meeting the specified criteria
PROGRAM FOCUS(see “ICAM’s Information Screens”).The map displays the specified geographic area (e.g., district, sector, orbeat), the streets in this geographicarea, the names of major streets, andicons showing the location of eachoffense meeting the specified criteria.If secondary offenses have been requested, each type will have a differenticon, with all the different icons beingshown in a map legend window.At this point, the user has several options (see exhibit 2, page 10), including printing the map or tabular view ofthe data, displaying community data,performing other geographic analyses,or returning to the ICAM Main Screenand formulating another query. A listof the ten most frequently reportedoffenses in a beat in the past 10days—the “Top Ten” feature ofICAM—can be obtained with justthree mouse clicks. The default timeperiod of 10 days can be changed byaccessing the date and time selectionscreens.ICAM’s Query ScreensFrom the ICAM Main Screen, the user can selectthe default setting to map the locations of allreported robberies occurring in the past 10 daysin a district; the user simply has to:TO MAKE MAP:1. Click on the primary offense scroll button todisplay the list of primary offenses.DO IT!2. From the list of primary offenses, click on“robbery.”3. Click on the button labeled “Do It!”TOP TENThe user could choose to pose a different queryto obtain a list of the most frequently reportedoffenses in a beat; in this instance,the user would:1. Click on the “pick beat” scrollbutton to display the list of beatsin the district.8DO IT!2095830952. From the list of beats, click onthe desired beat.3. Click on the button labeled“Do It!”If the user wants to specify a different time and date range from the10-day default period for the query,he or she moves to the followingcalendar screen and clicks on thetime period desired.Program Focus 7
PROGRAM FOCUSExhibit 1ICAM’s Mapping Features: Query ComponentsComponentOptionsPrimary OffenseOnly one primary offense can be selected per map.Secondary OffenseFor the selected primary offense, up to 10 secondaryclassifications can be selected. For example, if robberyis the primary offense and the secondary offenses are“with a knife” and “with a gun,” then only robberieswith a knife or a gun are mapped.Geographic AreaThe choices are the entire district, one sector, or onebeat. The default selection is the entire district.Date RangeBoth a start and end date are selected. The defaultselection is the past 10 days.Time of Day RangeBoth a start and end time are selected. For example, ifthe user is only interested in offenses occurring duringthe day shift, 800 to 1600 would be selected. Thedefault selection is all day.Type of LocationThe type of location includes those categories listedon the CPD General Offense case report—examplesinclude on a bus, in an apartment, at a business, and ata church. If “in an apartment” is selected, then onlyoffenses occurring in apartments would be mapped.The default selection is all types of locations.ICAMImplementationand TrainingAn official unveiling ceremony accompanied installation of ICAM ateach of the city’s 25 districts as thedevelopment team introduced thesystem to district police officialsand residents during the period fromOctober 1994 to May 1995. AlthoughICAM was designed for easy accessibility, training in its use was stillneeded by police officers at the districtstations. The ICAM development teamproduced an 8-minute instructionalvideo to be played during roll call atall district stations. Detective Soltysiakalso spent 2 days at each district station demonstrating ICAM to officersand training district administrativemanagers, who would then serve8 National Institute of Justiceas contact persons to provide assistance to district personnel. Thus, thedevelopment team adopted a “trainthe trainers” approach to ICAMinstruction.The development team also wrote anICAM users’ guide and prepared aone-page “Quick Map” instructionsheet, which was posted next to theICAM PC’s in each district station.The ICAM PC’s were placed in acommon area (e.g., behind the districtdesk), rather than being locked in anoffice, to make them accessible topolice personnel around the clock.Quality of data. The availability oftimely and accurate data is key toICAM’s effective use. One of thepotential obstacles that police departments face in implementing computerized mapping systems is the addedcost of entering the data. Fortunately,ICAM was able to “piggyback” ontoexisting data-entry procedures in thedistricts to minimize costs. Data-entryprocedures are standardized. At 6 a.m.in each district, offense reports writtenduring the previous 24 hours are entered in a PC-based data base package—a practice instituted long beforeICAM for the purpose of producingdistrict “24-hour” reports. To enhancethe data consistency, the user selectsvalues from predefined lists ratherthan simply typing in values. Forexample, if the offense is a burglary,the user selects “burglary” from thelist of offenses rather than typing inthe word “burglary.” Once these dataare entered, the data-entry clerk follows a three-step procedure: (1) executing a “geocode” routine on thedata, during which the latitude andlongitude of the location of each offense are computed; (2) executing a“copy” routine that extracts the offense data and writes it to a diskette;and (3) executing a “load” routine thatcopies the new offense data from thediskette to ICAM. These proceduresensure that ICAM data are, at most,24 hours old.The importance of the geocode step inthis process should be emphasized. Asnoted earlier, some addresses stored inpolice files may be initially unmappable because the underlying street mapsare incomplete or inaccurate. A teamof researchers from Loyola Universityin Chicago encountered this problemin 1991 when they attempted to mapthe location of homicides in Chicagousing the U.S. Bureau of the Censuscomputerized street files (i.e., TIGERfiles). The researchers found missing
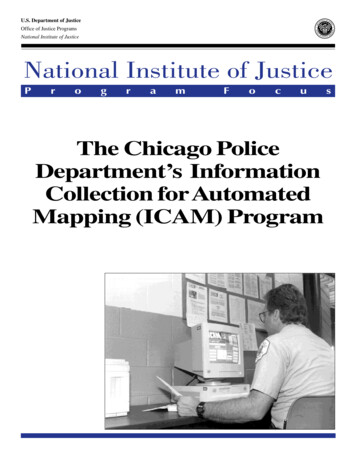
PROGRAM FOCUSICAM’s Information ScreensA query on criminal damage to vehicles would result in a map and tabular data.streets near the boundary of the city,unnamed and misnamed streets, andincorrect or missing address ranges.They corrected these problems andadded important landmarks to theTIGER files.20The researchers provided these improved files to the ICAM development team, who refined them evenfurther. About 95 percent of the offenses entered at the district stationsare geocoded automatically by thecomputer.21Use and Impactof ICAMICAM has fulfilled two of the keyrequirements for successfully implementing CAPS; it has provided: Police officers with an automatedtool for analyzing timely and accuratecrime information.A query on the top ten offenses in one beat does not generate a map but, instead,produces a simple list and graph. An effective and convenientmechanism for sharing informationwith the community.Support for ICAM. As a result,ICAM has earned enthusiastic supportfrom high-ranking city and CPD officials. Mayor Daley, who attended 10of the 25 district unveiling ceremoniesfor ICAM, has said, “ICAM is the bestthing to come from the police department in years.”22 CPD SuperintendentMatt Rodriguez has pointed to ICAMas the epitome of decentralized decisionmaking: “[ICAM] goes a longway to making the officer the chief ofpolice of his beat.”23 CAPS Co-ProjectDirectors Barbara McDonald andCharles Ramsey have seen ICAMProgram Focus 9
PROGRAM FOCUSExhibit 2ICAM Mapping Features: Options Once the Query is RunOptionCommentPanning and ZoomingThe section of the map shown on the screen can be moved in any direction (panning), or thedistance across the displayed section of the map can be changed (zooming).View Details of OffensesA tabular view of the data is produced (see “ICAM’s Information Screens”). The data elementsinclude: address, house or apartment number, case report number, crime code, primary offenseclassification, secondary offense classification, whether the offense is a Part 1 index crime, date,beat, start and end times, location code, type of location, number arrested, four analysis fieldsused to flag special offenses (e.g., domestic violence, gang-related offenses), offender descriptionor name, vehicle make, vehicle model, vehicle year, and the beat in which the vehicle was taken.Print MapThe map can be printed. A disclaimer is shown at the bottom of the printout indicating that theclassification of the offense is based only on the facts known at the time the offense was reported(see exhibit 3). Printed maps can be shared with the community.Print Tabular Viewof DataThe tabular view of the data can be printed. However, because the offense information availablein ICAM is unverified, printed tabular views of the data are not shared with the community.Add Vacant Buildingsto the MapThe locations of vacant buildings can be added to the map.Add Schools to the MapThe locations of schools can be added to the map.Add Establishments withThe locations of establishments with liquor licenses can be added to the map.Liquor Licenses to the MapAdd “EL” Stops to theMapThe locations of Chicago Transit Authority elevated (EL) railway stops can be added to the map.Radius SelectA list of all offenses within a specified distance from a specified location on the map can begenerated (e.g., all offenses within 1,000 feet of a school) and displayed in a table.Area SelectA list of all offens
The Dallas and Los Angeles Police De-partments are among the more active users of this technology. Dallas. The Dallas Police Department has developed what might be called a "text-only" version of ICAM. Located at each police substation, a "walk-up-and-use" system produces a list of reported offenses that meet specified criteria. Once a .