Transcription
MathematicsMathematicsMathematicsEnglish Language Artscom mon core6Did you know that racecarsPerformanceCoachreach top speeds of 235 miles per hour?That’s four times the speed of a normalcar on a highway! You may not be able tomove that fast, but Performance Coachwill power up your performance on yourtests this year!6common corePerformanceCoachcom mon core6PerformanceCoachStudent Editionwww.triumphlearning.comSample LessonPhone: (800) 338-6519 Fax: (866) 805-5723 E-mail: customerservice@triumphlearning.comTo order, call 800-338-6519 orvisit www.triumphlearning.com.ISBN-13: 978-1-62362-808-6900009 781623 628086313NASE G6 MATH SE cvr.indd 1313NASEPerformance Coach2/14/14 10:41 AM
CONTENTSStandardsLetter to the Student . . . . . . . . . . . . . . . . . . . . . . . . . . . . . . . . . . . . . . 4DOMAIN 1: Ratios and ProportionalRelationships . . . . . . . . . . . . . . . . . . . . . . . . . . . 5Lesson 1Understanding Ratios . . . . . . . . . . . . . . . . . . . . . . . . . . . . 66.RP.1Lesson 2Equivalent Ratios . . . . . . . . . . . . . . . . . . . . . . . . . . . . . . 136.RP.3.aLesson 3Solving Unit Rate Problems . . . . . . . . . . . . . . . . . . . . . . 236.RP.2, 6.RP.3.bLesson 4Percents . . . . . . . . . . . . . . . . . . . . . . . . . . . . . . . . . . . . . . 326.RP.3.cLesson 5Using Ratios to Convert Measurements . . . . . . . . . . . . 426.RP.3.dDomain 1 Review . . . . . . . . . . . . . . . . . . . . . . . . . . . . . . . . . . . . . . . . . 50DOMAIN 2: The Number System . . . . . . . . . . . . . . . . . . . . 57Lesson 6Dividing Fractions and Mixed Numbers . . . . . . . . . . . . 586.NS.1Lesson 7Dividing Whole Numbers . . . . . . . . . . . . . . . . . . . . . . . 676.NS.2Lesson 8Adding and Subtracting Decimals . . . . . . . . . . . . . . . . 766.NS.3Lesson 9Multiplying and Dividing Decimals . . . . . . . . . . . . . . . . 846.NS.3Lesson 10Greatest Common Factor and LeastCommon Multiple . . . . . . . . . . . . . . . . . . . . . . . . . . . . . 936.NS.4Lesson 11Understanding Positive and Negative Integers . . . . . 1026.NS.5Lesson 12Locating Rational Numbers on a Number Line . . . . . . 1106.NS.6.a, 6.NS.6.cLesson 13Ordering Rational Numbers . . . . . . . . . . . . . . . . . . . . 1186.NS.7.a, 6.NS.7.bLesson 14Absolute Value . . . . . . . . . . . . . . . . . . . . . . . . . . . . . . . 1276.NS.7.c, 6.NS.7.dLesson 15Locating Ordered Pairs on the Coordinate Plane . . . 1366.NS.6.b, 6.NS.6.cLesson 16Solving Problems on a Coordinate Plane . . . . . . . . . . 1466.NS.8Domain 2 Review . . . . . . . . . . . . . . . . . . . . . . . . . . . . . . . . . . . . . . . 156Performance Task . . . . . . . . . . . . . . . . . . . . . . . . . . . . . . . . . . 161Domain 3: Expressions and Equations . . . . . . . . . . 163Lesson 17 Writing and Evaluating Numerical Expressions . . . . . 1646.EE.1Lesson 18Writing Algebraic Expressions . . . . . . . . . . . . . . . . . . 1726.EE.2.a, 6.EE.2.b, 6.EE.6Lesson 19Evaluating Algebraic Expressions . . . . . . . . . . . . . . . . 1816.EE.2.c, 6.EE.3Lesson 20Equivalent Expressions . . . . . . . . . . . . . . . . . . . . . . . . 1886.EE.3, 6.EE.4Lesson 21Writing Algebraic Expressions for Problems . . . . . . . 1976.EE.6Duplicating any part of this book is prohibited by law. 2015 Triumph Learning, LLCPerformance Task . . . . . . . . . . . . . . . . . . . . . . . . . . . . . . . . . . . 552313NASE Mth G6 D1 PDF.indd 220/02/14 12:36 PM
StandardsLesson 22Solving Equations . . . . . . . . . . . . . . . . . . . . . . . . . . . . 2056.EE.5, 6.EE.7Lesson 23Solving Inequalities . . . . . . . . . . . . . . . . . . . . . . . . . . . 2166.EE.5, 6.EE.8Lesson 24Dependent and Independent Variables . . . . . . . . . . . 2266.EE.9Domain 3 Review . . . . . . . . . . . . . . . . . . . . . . . . . . . . . . . . . . . . . . . 235Performance Task . . . . . . . . . . . . . . . . . . . . . . . . . . . . . . . . . . 240DOMAIN 4: Geometry . . . . . . . . . . . . . . . . . . . . . . . . . . . . . 241Lesson 25 Area . . . . . . . . . . . . . . . . . . . . . . . . . . . . . . . . . . . . . . . . 2426.G.1Lesson 26Volume . . . . . . . . . . . . . . . . . . . . . . . . . . . . . . . . . . . . . 2536.G.2Lesson 27Drawing Polygons in the Coordinate Plane . . . . . . . . 2616.G.3Lesson 28Using Nets to Find Surface Area . . . . . . . . . . . . . . . . . 2706.G.4Domain 4 Review . . . . . . . . . . . . . . . . . . . . . . . . . . . . . . . . . . . . . . . 280Performance Task . . . . . . . . . . . . . . . . . . . . . . . . . . . . . . . . . . 285Duplicating any part of this book is prohibited by law. 2015 Triumph Learning, LLCDuplicating any part of this book is prohibited by law. 2015 Triumph Learning, LLCDOMAIN 5: Statistics and Probability . . . . . . . . . . . . 287Lesson 29 Statistical Variability . . . . . . . . . . . . . . . . . . . . . . . . . . . 2886.SP.1Lesson 30Measures of Center . . . . . . . . . . . . . . . . . . . . . . . . . . . 2956.SP.2, 6.SP.3, 6.SP.5.a, 6.SP.5.b,6.SP.5.cLesson 31Dot Plots . . . . . . . . . . . . . . . . . . . . . . . . . . . . . . . . . . . . 3046.SP.4, 6.SP.5.dLesson 32Measures of Variability . . . . . . . . . . . . . . . . . . . . . . . . . 3146.SP.2, 6.SP.3, 6.SP.5.a, 6.SP.5.b,6.SP.5.cLesson 33Histograms . . . . . . . . . . . . . . . . . . . . . . . . . . . . . . . . . . 3246.SP.4Lesson 34Box Plots . . . . . . . . . . . . . . . . . . . . . . . . . . . . . . . . . . . . 3346.SP.4Domain 5 Review . . . . . . . . . . . . . . . . . . . . . . . . . . . . . . . . . . . . . . . 344Performance Task . . . . . . . . . . . . . . . . . . . . . . . . . . . . . . . . . . 349Glossary . . . . . . . . . . . . . . . . . . . . . . . . . . . . . . . . . . . . . . . . . . . . . . . . 351Math Tools . . . . . . . . . . . . . . . . . . . . . . . . . . . . . . . . . . . . . . . . . . . . . 3613313NASE Mth G6 D1 PDF.indd 320/02/14 12:36 PM
ELL Support Have students add cluster, dot plot,frequency, and gap to their dictionaries. Suggest thatstudents draw a dot plot with a cluster and a gap andlabel them. Record below the dot plot the frequency ofeach value. Have students review mean, median, mode,and range in their dictionaries. Have them find thesevalues for the example dot plot they drew.The cognate for frequency in Spanish is frecuencia.u Example 1Ask students to pretend they had the data set in a listinstead of a dot plot. Ask: How would you find themean? (Add all the data values and divide by the totalnumber of data values.) Explain that this dot plot isa way of displaying all the scores without having towrite out a list of scores. When reviewing Step 2, ask:How does the dot plot make finding the mean easierthan using a list of the scores? Journal PromptMP1 How would the mean changeif one score of 100 changed to a score of 50? Would thischange also affect the median and mode? If so, how?u Example 2in their tables for which there are no data values, e.g., 51.Explain that this is not wrong, but when making the dotplot they will need to include those values on the numberline. Ask: How many dots should you put above a valuethat is not in the data set? (none)u Example 3There are different strategies a student could use toeliminate the plots that do not show the given data.Remind students that, no matter how they eliminatechoices, they should always double-check the choicethat remains as the correct answer. Ask: How manyvalues are in this data set? (16) How can you use thisnumber to eliminate dot plots? (Eliminate dot plot B,since it has only 15 dots.) Does Choice C have thecorrect number of data values? (yes) Review checkingthe data on the correct dot plot in Step 3.u Example 4Explain that the data set that is set up in Step 1 is notthe only data set that would work, but finding onedata set that shows the mean and median to be 25 isall that is needed. Ask: Would the median still be 25if the data set were changed to 10, 10, 10, 10, 24, 26,27, 30, 43, 60? (yes) If the mean is 25, what must thesum of all the data be? (10 3 25 5 250) Could thedata set be 10, 10, 10, 10, 24, 26, 27, 30, 43, 60? (yes)2 COACHED EXAMPLEAsk a volunteer to read the word problem. Discussthe meaning of the ranges for the values on thenumber line. Ask: Can you find the exact ages fromthis dot plot? (no) Can you determine how many hourseach family member played computer games in aweek? (No, we just know they played 10 or morehours.) What might be a reason for the large gapbetween 25 and 35? (People this age might spendmore time working outside their homes.) Work withstudents to ensure they have completed the sentenceframes correctly.For answers, see page A30.3 LESSON PRACTICEProblems 3 and 4 would be good problems to useas a quick check for student’s understanding of theconcepts taught in this lesson. If students are havingdifficulty on problem 6, suggest they cover up theDuplicating this page is prohibited by law. 2015 Triumph Learning, LLCchoices and make their own dot plot of the data andthen compare it to the choices.For answers, see page A30.Lesson 31: Dot Plots71DOMAIN 5Draw the students’ attention to the data list. Ask: Howmany guesses are there? (28) How does the table inStep 1 help you organize the 28 guesses? How doesknowing the frequency of each guess help you tomake a dot plot of the data? Common Error Students may not include the values
LESSON316.SP.4, 6.SP.5.dDot Plots1 GETTING THE IDEAA dot plot , or line plot, organizes and displays data along a number line. Each dot stands for a pieceof data. The frequency of each data value, or the number of times it occurs in the set, is shown by thenumber of dots above the value on the number line.This dot plot shows the number of fruit and vegetable servings eaten by students in a day. It wascreated from this data: 6, 1, 5, 5, 5, 5, 6, 2, 6, 5, 5, 2, 5, 5, 6, 6, 2Fruit and Vegetable Servings123456There are no dots above 3 on the number line. That means that no students reported eating 3 servingsa day.A cluster is a set of closely grouped data. A gap in a data set is where no data values occur. On thedot plot above, a cluster occurs at 5 and 6 servings per day. A gap occurs at 3 and 4 servings per day.It is important to use regular intervals on the number line of a dot plot so that gaps can be observed.Numbers should not be skipped just because there are no data points.By looking at a dot plot, you can quickly find the mode or modes of a data set by seeing which numberhas the most dots above it. It is clear in the plot above that the number 5 has the greatest frequency, soit is the mode of the data.To calculate the range of the data set above, we can see that the greatest value is 6 and the least valueis 1. So, the range of the data is 6 2 1 5 5.A dot plot can be used to find the measures of center of the data set it displays.304Domain 5: Statistics and ProbabilityDuplicating any part of this book is prohibited by law. 2015 Triumph Learning, LLCThere are 8 dots above 5 on the number line. That means that 8 students reported eating 5 servings a day.
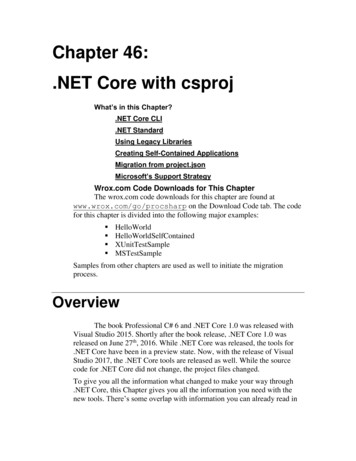
Example 1The line plot shows student scores on a math quiz. Find the mean score.Scores on Math Quiz60StrategyStep 1708090100Find the sum of the scores. Then divide by the number of scores.Record the frequency of each score. Count the number of dots above each score.There are 9 students who scored 80.There are 8 students who scored 90.There are 3 students who scored 100.Step 2Multiply each score by its frequency.9 3 80 5 7208 3 90 5 7203 3 100 5 300Duplicating any part of this book is prohibited by law. 2015 Triumph Learning, LLCStep 3Add the products to find the sum of all the students’ scores.720 1 720 1 300 5 1,740Step 4Divide by the number of scores. The number of dots is the number of scores.There are a total of 9 1 8 1 3, or 20 dots.1,740 4 20 5 87SolutionThe mean score on the math quiz is 87.Lesson 31: Dot Plots305
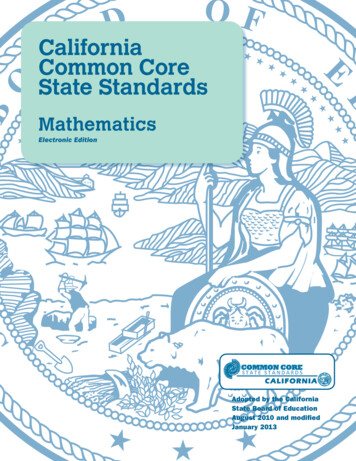
Example 2Visitors at the school fair guessed the number of marbles in a jar to try to win a prize. Their guesses areshown below. Make a dot plot for the set of 55060505855StrategyStep 1Find the frequency of each guess. Mark dots on a number line to display the data.Make a table.Count and record the number of times each number was guessed.Step aw a number line. Mark it from the least to the greatest number of guesses.The guesses ranged from 50 to 60. Mark units of one from 50 to 60.50Step 351525354555657585960Mark the frequency of each guess with dots above the number line.Mark 8 dots above 50, 1 dot above 52, 1 dot above 54, 7 dots above 55, 1 dotabove 58, 1 dot above 59, and 9 dots above 60.50Solution306515253545556The dot plot in Step 3 shows the set of data.Domain 5: Statistics and Probability57585960Duplicating any part of this book is prohibited by law. 2015 Triumph Learning, LLCGuesses for Number of Marbles
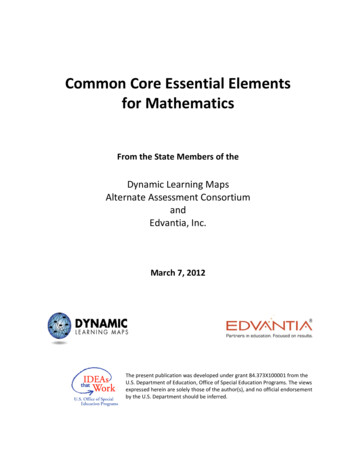
Example 3The set of data shows the number of pets that Jason’s classmates have.2521131125522221Which dot plot displays the data?Plot A0123Plot B4545012345Plot CDuplicating any part of this book is prohibited by law. 2015 Triumph Learning, LLC0StrategyStep 1123Compare the frequencies and distribution on each plot with the data.Look at the range of the data.The responses for number of pets ranged from 1 to 5.Plot A shows dots above 0. The answer cannot be Plot A.Step 2Look at the mode of the data.Plot B shows a mode of 1. Plot C shows a mode of 2.The mode for the number of pets is 2. The answer cannot be Plot B.Step 3Check that the data in Plot C matches the given data.There are 5 students with 1 pet, 7 students with 2 pets, 1 student with 3 pets, and3 students with 5 pets. No students have 0 or 4 pets.SolutionPlot C displays the data.Lesson 31: Dot Plots307
Example 4A dot plot shows the weights of the dogs owned by ten students. The heaviest dog weighs 60 pounds.No dog weighs less than 10 pounds. Is it possible for the mean and median of this data to be 25?StrategyStep 1Create a data set in order to produce the desired outcome.List possible data values from least to greatest that would have a median of 25.Use four data values less than 25. Remember that there are no data values lessthan 10.Make the middle two numbers 25 so that the median is 25.Make the tenth number 60 to represent the heaviest dog.10, 10, 10, 10, 25, 25,Step 2,,, 60Write an equation for the mean to find the unknown values.Use your data set and the mean of 25 to write and solve an equation.The sum of the known data values is 10 10 10 10 25 25 60, or 150.There are three unknown data values. Let x represent the sum of the threeunknown data values.(150 1 x) 10 5 25Multiply both sides by 10.150 1 x 5 250 Subtract 150 from both sides.x 5 100Step 3Select three values greater than or equal to 25 whose sum is 100.The remaining three values could be 25, 25, and 50.Solution308Yes, it is possible for the data set described to have a mean and median equal to 25.Domain 5: Statistics and ProbabilityDuplicating any part of this book is prohibited by law. 2015 Triumph Learning, LLCThe data set for the dot plot could be 10, 10, 10, 10, 25, 25, 25, 25, 50, and 60.
2 COACHED EXAMPLEFive students asked the members of their family if they play 10 or more hours of computergames in a week. They sorted the results by age and displayed the data on a dot plot, includinga dot for each person who played at least 10 hours in a week.Computer Game Playing by 4546–50What observations about the data help you describe the relationship between playing computergames and age?Clusters of data occur between the ages of 11 and 25 and between the ages ofand.The most frequent ages of family members who play computer games for 10 or more hours arebetweenand.The second most frequent are agesto.There is a gap in the frequency of responses for ages betweenThe mode of the data is the agestoDuplicating any part of this book is prohibited by law. 2015 Triumph Learning, LLCThe median of this data is the ages betweenand.and.What conclusions might be made about the families’ computer game playing and leisure time?Lesson 31: Dot Plots309
3 LESSON PRACTICE1The dot plot shows the typical sizes for birds Daniel saw on his bird watching trip. Select True orFalse for each statement.Small Wild Bird Sizes (in inches)56789A. Daniel did not see any 8-inch birds. True FalseB. The mode for the data is 7. True FalseC. The median for the data is 6. True FalseD. The mean for the data is 7. True FalseStudents interviewed the musicians in a youth orchestra. They asked the musicians howmany years they had taken music lessons. Use the dot plot to answer questions 2 and 3.526781011.Select the statements about the music lesson data that are true. Circle all that apply.A. The musician who has studied the longest is 12 years old.B. The data has more than one mode.C. The median for the data is 8.D. Twelve students took music lessons for 8 or more years.E. There is a gap in the data.31012Find the mean for the data.The mean number of years of music lessons is39Domain 5: Statistics and ProbabilityDuplicating any part of this book is prohibited by law. 2015 Triumph Learning, LLCYears of Music Lessons
4On Pep Rally Day, Chloe counted the number of people in each classroom who wore theschool colors. Each classroom has 28 students. The table below shows her data.Fourth-grade classes20 20 18 20 20Fifth-grade classes19 19 18 19Sixth-grade classes25 25 26 25 25Use Chloe’s data to draw a dot plot. Be sure to give your dot plot a title.Duplicating any part of this book is prohibited by law. 2015 Triumph Learning, LLC5A dot plot shows the number of home runs that ten baseball players hit in one season. Thebest hitter had 12 home runs. Four students hit 2 homeruns. The median and mean are both 6.Could the dot plot show the following data set for this season? Select Yes or No.A. 2, 2, 2, 2, 6, 6, 7, 9, 10, 12 Yes NoB. 2, 2, 2, 2, 6, 6, 8, 9, 11, 12 Yes NoC. 2, 2, 2, 2, 6, 6, 8, 8, 10, 12 Yes NoD. 2, 2, 2, 2, 6, 6, 9, 9, 9, 12 Yes NoE. 2, 2, 2, 2, 6, 6, 9, 9, 10, 12 Yes NoLesson 31: Dot Plots 311
6Sofia wants to buy some new inline skates, so she compares the prices of different models. Thisdata shows the cost of children’s inline skates at a sporting goods es of Inline SkatesPlot A30354045Plot B5055605055603035404550556030354045Part AWhich of the dot plots displays the data correctly?Plotdisplays the data.Part BFor each of the incorrect dot plots, describe what is wrong.312Domain 5: Statistics and ProbabilityDuplicating any part of this book is prohibited by law. 2015 Triumph Learning, LLCPlot C
7Jose and Michele are playing a video game. Their scores are shown on the dot plots. Whosemean score and median score are closer together? Show your work. Compare any clusters orgaps in the dot plots. Interpret your findings.Jose’s Scores150200250300100150200250300Duplicating any part of this book is prohibited by law. 2015 Triumph Learning, LLC100Michele’s ScoresLesson 31: Dot Plots313
common core Performance Coach Performance Coach Mathematics 6 common core Performance Coach 6 Student Edition www.triumphlearning.com Phone: (800) 338-6519 Fax: (866) 805-5723 E-mail: customerservice@triumphlearning.com ISBN-13: 978-1-62362-808-6