Transcription
Deorari , AIIMS 2008BLOOD GAS ANALYSIS
Deorari , AIIMS 2008Contents1. Introduction, indications and sources of errors2. Terminology and normal arterial blood gases3. Understanding the print outs4. Details about(i)pH(ii)Oxygenation, oxygen saturation, oxygen content, alveolar gas equation, indices ofoxygenation(iii)Carbon dioxide transport, Pco2 total CO2 content, and bicarbonate levels(iv)Base excess and buffer base5. Simple and mixed disorders6. Compensation mechanisms7. Anion Gap8. Approach to arterial blood gases and exercises9. Arterial blood gases decision tree10. Practical tips for sampling for ABG.2
Deorari , AIIMS 2008AbbreviationsABEActual base excessABGArterial blood gasAaDO2Alveolar to arterial oxygen gradientBaro/PBBarometric pressureBBBuffer baseBEBase excessBEecfBase excess in extracellular fluidBPDBronchopulmonary dysplasiaCH Concentration of hydrogen ionCO2Carbon dioxideECMOExtra corporeal membrane oxygenationFiO2Fraction of inspired oxygenHCO3BicarbonateH2CO3Carbonic acidMAPMean airway pressureO2CTOxygen content of bloodPaCO2Partial pressure of carbon dioxide in arterial bloodPaO2Partial pressure of oxygen in arterial bloodpAO2Partial pressure of oxygen in alveolipH2OWater vapour pressurePPHNPersistent pulmonary hypertension in newbornRBCRed blood corpuscles3
Deorari , AIIMS 2008RQRespiratory quotientSatSaturationSBEStandard base excessSt HCO-3/SBC Standard bicarbonateTCO2Total carbon dioxide content of bloodTHbATotal haemoglobin concentrationUACUmbilical artery catheter4
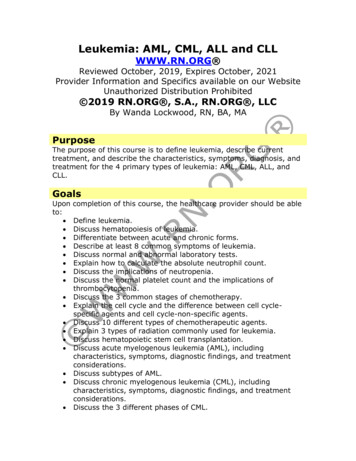
Deorari , AIIMS 2008The terminology of arterial blood gas (ABG) is complex and confusing. It is madeworse by the printouts generated by recent microprocessors. Basically the machinesPco2mm HgTotal-CO2 mMol/I Plasma6060505040403535303020HCO3 mEq/I Plasma 30Base ExcessmEq/I blood or plasmapH 25 15 10 .6 140150535
Deorari , AIIMS 2008measure pH, carbon dioxide and oxygen. All other parameters are derived based onsoftware in machine which can be obtained manually if one knows how to use Siggaardndersen Nomograms (given above).Goals of ABG in newborn is to characterize the type of disorder, quantify themagnitude and assess the nature and extent of compensation.Indications for ABG(1) Severe respiratory or metabolic disorders(2) Clinical features of hypoxia or hypercarbia(3) Shock(4) Sepsis(5) Decreased cardiac output(6) Renal failure(7) Ideally any baby on oxygen therapy(8) Inborn errors of metabolismCollection of SamplesIdeal artery for sampling in newborn is radial or umbilical artery. One must perform“Allen Test” to ensure collateral blood supply by ulnar artery before puncturing radialartery. If sample from umbilical artery catheter (UAC) is being taken, one should assurefree flow of blood and remove three to four times dead space volume before sample istaken. Indwelling arterial line may only be put if round the clock facilities for ABGestimation are available considering this as a potent source of infection.6
Deorari , AIIMS 2008Arterialised capillary samples are comparable to arterial blood (Table I). If capillarysample (100-150 micro L) is being taken from prewarmed heel, let the capillary fill fromthe tissue site from where blood is oozing out (figure I). Avoid squeezing and first dropof blood. Rotate the capillary in palm . to mix anticoagulant with blood. Care should betaken not to include any air bubble in the capillary.Venous blood is good for HCO-3 estimation but bad for pH, pCO2 and pO2. Whiledrawing venous sample make sure that no tourniquet is applied, artery is not compressedand sample is drawn against the flow of blood towards heart.Table I : Comparison of Blood Gas Analysis at different eRecommendationGoodFairBadPrecautions for collection of blood sample(1) Heparin is acidic and lowers pH. Use heparin of lower strength (1000 units per mlinstead of 5000 units per ml) or heplock solution.(2) Use small volume of heparinised saline just for lubricating syringe and plunger. Ifvolume is more, dissolved oxygen in haparinised saline may increase pO2.(3) Avoid air bubble and let syringe fill spontaneously.(4) It is desirable to use a glass syringe as plastic syringes are permeable to air.7
Deorari , AIIMS 2008(5) Sample may be collected in a heparinised capillary from hub of needle used topuncture artery.The sample should be processed immediately, preferably within 30 minutes. Blood isa living medium. The cells consume oxygen and produce CO2. Drop in pO2 dependson initial pO2. If the latter is very high, significant drop may be noticed. The changesare as depicted in Table II. Slush of ice (not cubes) should be used for storing samplestill processing. The sample should be shaken, homogenised before putting inmachine.Table II: Changes in ABG every 10 minutes in vitro37 C4 CpH0.010.001pCO20.1 mm Hg0.01 mm HgpO20.1 mm Hg0.01 mm Hg* It is obvious that blood sample should be stored at 4 C, if it cannot be processedimmediately for minimal error.Terminology of ABGAcidosispH 7.3AlkalosispH 7.5HypercapniapCO2 50 mm HgHypocapniapCO2 30 mm HgHypoxiapO2 50 mm HgHyperoxiapO2 70 mm Hg*Acidemia and alkalemia refer to blood while acidosis, alkalosis to tissue pH.8
Deorari , AIIMS 2008Normal Neonatal ABG valuesPH7.35 – 7.45pCO235 – 45 mm HgpO250 – 70 mm HgHCO320 – 24 mEq/LBE 5ABG values vary with age of neonate and even with gestational age (Table III, IV).Table III: ABG values based on neonatal agePre-birth(Scalp)5 minafter birth1-7 daysafter birthpH 7.207.20-7.347.35-7.45pCO2 5035-4535-45pO225-4049-7370-75Sat% 50 80 90HCO3 1516-19209
Deorari , AIIMS 2008Printout generated by blood gas machine10
Deorari , AIIMS 2008Table IV: Target blood gas values 28 wks28-40 wksTerm infantwith PFCInfantwith -70PH 7.25 7.257.50-7.607.35-7.45Understanding the printout (Appendix – II).BARO:It denotes barometeric pressure at site where machine is installed. It varies from place toplace and it is determined by automated barometer in the machine. Barometric pressureis required for calculation of alveolar oxygen pressure.THb A:Haemoglobin (Hb) of patient. A few machines measure haemoglobin, others need thisinformation to be fed. If no information is fed, machine may assume any Hb or it may beat mercy of technician. Haemoglobin is required to calculate oxygen content (O2 CT)of blood.Temp:Patient temperature has to be fed into machine because the machine measures all valuesat 37 C. Temperature affects pH, pCO2 and pO2. Hence, it is desirable to havevalues corrected for patient temperature.BE (ABE); BeEcf (SBE); BBBE refers to actual base excess in variance from (above or below) total buffer base (BB).Normal BB is 48-49 mmol/L. If BB is 40, it means buffer base is reduced by nearly 811
Deorari , AIIMS 2008mmol/L, or BE is –8 (also called base deficit). If BB is 60, it means buffer base isincreased by nearly 12 mmol/L, or BE is 12.BB is dependent on haemoglobin, as 25% of BB is constituted by haemoglobin buffer.Fifty percent of BB is contributed by bicarbonate and 25% by other buffers (proteins,phosphate, sulphate).HCO3 (ABC); st HCO3 (SBC); TCO2TCO2 is sum of HCO-3 and amount of CO2 dissolved in plasma. For each mm HgpCO2 , 0.03 ml CO2 is dissolved per 100 ml of plasma. As HCO-3 values change withCO2 levels, st HCO-3 is used to denote value of HCO-3 , independent of CO2 changes (i.e.at pCO2 of 40 and temperature of 37 C).St. pH:It is the pH adjusted for temperature of 37 C and pCO2 of 40 mm of Hg. This wouldrepresent pH value purely due to metabolic status.CH :Concentration of hydrogen ion in nmol/L at 37 C and patients temperature.O2 CT:It is the sum of oxygen bound to haemoglobin oxygen dissolved in plasma. For eachgm saturated Hb, 1.34 ml O2 is bound to hemoglobin and for each mm Hg pO2 0.003 mloxygen is dissolved per 100 ml of plasma.O2 sat:Proportion/percentage of hemoglobin which is saturated with oxygen.Aa DO2 :Alveolar to arterial oxygen gradient. Normal value is 5 to 15 mm Hg.12
Deorari , AIIMS 2008RQ:Amount of CO2 liberated per minute divided by amount of O2 utilised per minute.Normal values are 200 ml/250 ml 0.8.FiO2:Inspired oxygen fraction concentration. This value has to be fed to machine, it is requiredfor calculation of alveolar oxygen concentration.DBE/dTHB:It is called hemoglobin indicator. The normal value of this parameter is 0.32. If this valueis more than 0.32 then it indicates, the hemoglobin of the patient should be measuredaccurately in order to calculate exact base excess.Details about pHpH pK log (HCO3/H2 CO3) (Henderson-Hasselbach euqation)pK constant, it is the pH value at which H2CO3 is 50% dissociated i.e.concentration of HCO3- and carbonic acid in body are equal.PK 6.1 for H2CO3.Normal ratio HCO-3/H2CO3 20/1 and hencepH 6.1 log 20 6.1 1.3 7.4pH Normal 7.35-7.45Ideal 7.4 2 S.D.Alkalosis 7.5Acidosis 7.3Severe acidosis 7.213
Deorari , AIIMS 2008If pH is 7.25 stimulation of respiratory centre occurs but if 7.0 depression will occur.Relationship of pH and pCO2pCO2 elevation of 10 mm Hg decreases pH by 0.08, while pCO2 decrease of 10mmHg increase pH by 0.08.The effect of buffers on pHBuffers stabilize pH. Hemoglobin, bicarbonate and protein are the principal buffers ofblood. Extravascular space does not have hemoglobin and hence the buffering capacity isless than that of blood. Because we have no measure of extra and intracellular bufferingcapacity, it is difficult to predict how much pH will change when the concentration ofacid or CO2 changes. The equation CO2 H2O H2CO3 H HCO-3 shows that anyaddition or subtraction of H or of HCO-3 ions causes a change in CO2 level. By changingventilation, CO2 concentration can be altered. The Henderson Hasselbach equation can beused to calculate one variable only if the other two are known; for example, we cancalculate (HCO-3) if pH and (H2CO3) are known. The equation cannot be used to predictwhat will happen if only one variable changes and if we know nothing about the othertwo. Although, we can estimate what might happen in response to an acid-load orventilatory change, we cannot be accurate.OxygenationNormal values of arterial oxygen tension in term neonates is 50-70 mm of Hg and inchildren 70-100 mm of Hg. Spurious hypoxia may be noted in situations with increasedcells (polycythemia), delay in processing, venous blood or in a febrile patient. Althoughuniversally used, paO2 monitoring has recognized shortcoming. Validity of values areoptimal when blood gas samples are obtained from indwelling catheters under quiet,14
Deorari , AIIMS 2008resting conditions. In a crying neonate due to pain of percutaneous puncture valuesobtained may not reflect steady state conditions. paO2 values vary considerablythroughout the day in sick neonates. Intermittent sampling produces only a limited viewof a single point in time. Transcutaneous (TcPO2) monitors are useful for judging trendsin oxygenation during management of acute lung disease. These monitors measure skinsurface pO2 (not paO2), which under proper conditions is closely correlated with arterialpO2. The TcPO2 sensor combines a miniature blood gas electrode with a servo controlledprobe. The sensor is applied to the skin in a way that excludes any effects ofenvironmental air on values measured. The technique depends on heating the skin at thesensor site to 43.5 C to 44 C. This increases the tissues pO2 as oxygen diffuses to theskin surface. With these operating temperatures and proper calibration, skin surface pO2at the electrode site correlates closely with central arterial pO2.In certain clinical circumstances, however, correlation is poor and TcPO2 mayunderestimate paO2. Such conditions include circulatory insufficiency, inadequateelectrode temperature, improper calibration and lack of user expertise, patient age greaterthan 10 weeks (skin thickness factor), and use of vasodilator agents. Maturation andthickening of skin with increasing postnatal age limits the use of transcutaneousmonitoring to neonates. All of these artifacts of measurement result in underestimation ofarterial pO2.Under usual circumstances TcPO2 should be in the 40 to 80 mm Hg range. There is atime lag between measured TcPO2 and paO2 values. As a result, oxygen concentrationshould not be continuously raised and lowered in attempts to “chase” fluctuating TcPO215
Deorari , AIIMS 2008values. The FiO2 and management plan selected should be designed to minimizefluctuations of TcPO2 values as much as possible without constant manipulations of FiO2.Table VI: Causes of hypoxemiaCauses of HypoxemiaDisordersHypoventilationLoss of respiratory drive, Mechanicalinterference with lung inflationVentilation/perfusion mismatchParenchymal lung diseaseRight-to-left shuntCongential heart disease, Persistentpulmonary hypertensionMethemglobinemiaAbnormal hemoglobin, Nitrate toxicity(following No)Oxygen saturationAmount of oxygen that is combined with hemoglobin divided by the amount of O2that can be combined with Hb i.e. % of saturation of Hb. Pulse oximetry is useful formonitoring trends in oxygenation. This technique is less complex and does not requirecalibration or the level of user sophistication that TcPO2 monitors do. The techniquemeasures peripheral hemoglobin O2 saturation (SaO2). Movement artifacts may at times,severely limit the applicability of this techniques. Artifacts of saturation measurementmay also occur in the presence of high-intensity light, 50% fetal Hb, .Pulse oximetrydoes not measure the paO2 and, thus is relatively insensitive in detecting hyperoxemia.This is particularly important in the small premature. In acute lung disease, the range ofdesirable hemoglobin saturation as measured by the pulse oximeter is 88 to 93%. Normalsaturation being 95-98%.16
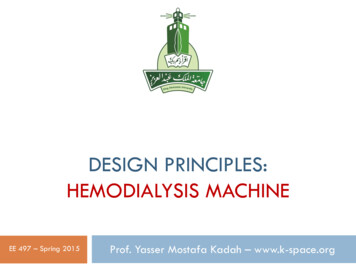
Deorari , AIIMS 2008Clinical cyanosis becomes evident if saturation is 75%. At paO2 of 40 mm Hg 75% ofhemoglobin A is saturated, while at paO2 27 mm Hg 50% of hemoglobin A is saturatedPercentage O2 saturation of hemoglobin(P50) and at paO2 of 60 mm Hg 90% of hemoglobin A is saturated.Po2(mm Hg)% Sat ofHbDissolvedO2 PO2(mm Hg)OXYGEN DISSOCIATION CURVE17
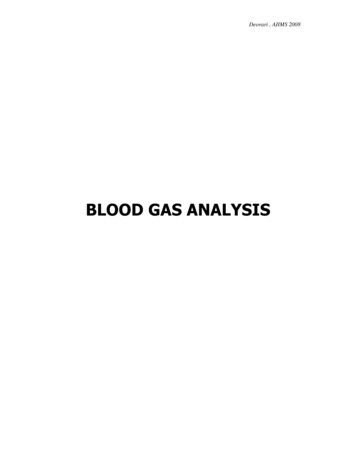
Deorari , AIIMS 2008Effect of temperatureEffect of pHEffects of Temperature and pH on Oxygen Dissociation CurveOxygen dissociation curve is sigmoid shaped which plateaus off at pO2 70 mm Hg.Thus a patient with very high pO2 may have saturation 97-99% (Figure II). The positionof the oxy-hemoglobin dissociation curve is affected by changes in type of hemoglobin,pH, temperature, and concentrations of 2,3-diphosphoglycerate (2,3-DPG) (Table V).Fetal hemoglobin binds O2 more avidly than does adult hemoglobin and tends to shift thecurve to the left. As a result, the paO2 at which hemoglobin is 50% saturated (P50) isdecreased. This shift benefits the fetus since it favors O2 uptake at the low O2 tensions inplacenta. During the first months after birth, the oxy-hemoglobin dissociation curvebegins to shift to the right, and between 4 and 6 months of age it is similar to that of theadult.18
Deorari , AIIMS 2008Table V: Factors affecting the position of the oxyhemoglobin dissociation curveShift Curve to theLeft and P50(Impair Oxygen Delivery)Shift Curve to theRight and P50(Improve Oxygen Delivery)- Alkalosis- Acidosis- Temperature- Temperature- 2, 3 – DPG concentrations- 2, 3 –DPG concentrations- Fetal hemoglobin- Adult hemoglobinThe curve may shift to right due to pH, pCO2 , temperature, 2-3 DPG andadult haemoglobin indicating less firm affinity of oxygen to haemoglobin while it mayshift to left due to pH, pCO2, temperature, 2-3 DPG and HbF thus indicatingmore firm binding of oxygen to haemoglobin thus resulting in tissue hypoxia (Figure-III).O2 Content (O2 CT and significance)It is concentration of total oxygen in the blood (expressed as vol. %).1 gm of Hb combines with 1.34 ml of oxygen. Each 100 ml of blood has 0.003 ml ofdissolved oxygen for each 1 mm Hg of O2 tension.O2CT O2 in saturated Hb Dissolved O2 in plasmaPatient with anemia may have normal saturation because of cardiac compensation butdecreased oxygen content as less hemoglobin is available for transporting oxygen.Oxygen delivery.Oxygen delivery to the tissues is the product of arterial oxygen content and cardiacoutput, and it is directly affected by changes in paO2,. Hemoglobin concentration, andcardiac output. A decrease in any one of these components can be offset to some extentby increases in the others.19
Deorari , AIIMS 2008Oxygen consumption is equal to the cardiac output times the difference betweenarterial O2 content and venous O2 content. Oxygen consumption can be affected by bothO2 delivery and by the ability of the tissues to extract O2 from blood. The differencebetween arterial O2 content and venous O2 is a measure of effectiveness of O2 delivery totissues. An increase in the gradient between arterial and venous O2 contents infers thatdelivery is inadequate and that the tissues are increasing extraction to maintain O2 tensionand increase extraction is limited, since a minimum gradient of oxygen tension must bemaintained to facilitate diffusion of oxygen into cells and mitochondria. If mixed venousO2 tension is too low, O2 delivery to mitochondria will be compromised andO2consumption will decrease as the cell switches from aerobic to anaerobic metabolism.This inefficiency results in ATP depletion and ultimate cell death. In addition, anaerobicmetabolism generates two molecules of lactic acid for every molecule of glucosemetabolized, resulting in tissue lactic acidosis. Therefore, the appearance of significantamounts of lactic acid in arterial blood ( 3 umol/L) is indicative of inadequate O2delivery to the cellular mitochondria.Calculation of oxygen content difference of arterial blood and venous blood at rightatrial level tells how much oxygen is being utilized by tissue. Because of total shut downin cellular enzymatic function in septic shock, no oxygen utilization occurs. Hence, theoxygen content of venous blood is same as that of arterial.Alveolar Gas Equation (AaDO2)Alveolar oxygen can be calculated by following formulapAO2 PiO2 - PACO2 FiO2 (1-FiO2 )20
Deorari , AIIMS 2008RWhere PiO2 is partial inspired oxygen pressure and equals (PB-H2O) (FiO2). For mostclinical purposes, R is assumed to be 0.8 and a modified equation given below is usedpAO2 (PB-PH2O) (FiO2) -PaCO20.8or when FiO2 is greater than 0.6PAO2 (PB – PH2O) (FiO2) – PaCO2(PB: Barometric pressure; PH2O : Water vapour pressure).Alveolar oxygen partial pressure in an individual breathing room air (FiO 2 0.21)with arterial pCO2 of 40 mm of Hg is (760-47) (0.21) –40/0.8 713 0.21 – 40/0.8 149-50 99 mm Hg.In an infant who is breathing 50% oxygen, (FiO2 0.5) and has an arterial pO2 of 150and pCo2 of 36, the calculated Alveolar pO2 will be:0.5 (760 mm Hg – 47 mm Hg)–36 311 mm Hg0.8AaDO2 will be 311 – 150 161 mm Hg while the arterial to alveolar pO2 ratio, will be150/311 0.48.In normal person breathing room air, the AaDO2 is less than 10 mmHg. But in aneonate due to higher physiological dead space , this may be upto 25-35 mm of Hg . It isabout 200 while breathing 100% oxygen. Large gradients (high AaDO2) are noted incongenital cyanotic heart disease with shunts exceeding 50%, meconium aspiration21
Deorari , AIIMS 2008syndrome and persistence of fetal circulation. AaDO2 620 for 12 hr on FiO2 100% is anindication for ECMO in West, because risk of mortality is 80%.An advantage of using arterial pO2 to alveolar pO2 ratio (a/ApO2) instead of AaDO2 isthat the ratio does not change with varying inspired oxygen concentration. In healthyadult the ratio a/ApO2 is more than 0.8.In infants with the severe RDS the a/ApO2 ratio could fall to as low as 0.1 to 0.2. Inaddition, high arterial pCO2 values indicate reduced ventilation. As baby recovers fromRDS the a/ApO2 improve gradually from low (0.1 to 0.3) to normal (0.7 to 0.9). A valueof 0.22 of arterial to alveolar oxygen ratio is indication for administering surfactant.Oxygenation IndexMAP x FiO2 x 100Postductal pO240 – mortality risk 80-90%25-40 – Moratlity risk 50-60%If oxygenation index 40, it is a indication for use of ECMOCarbon dioxide transportCarbon dioxide transport helps in excreting large amounts of CO2 continuously fromhigh body concentrations to low atmospheric concentrations. Carbon dioxide is carried inseveral forms: dissolved in plasma as bicarbonate in equilibrium with dissolved CO2, is inthe form of plasma or red cell bicarbonate. Carbon dioxide is 20 times more soluble inblood than oxygen and its dissociation curve is nearly linear over physiologic ranges. Asa result, large amounts of CO2 can be carried in blood and removed from the body withrelatively small changes in partial pressure of carbon dioxide in blood.22
Deorari , AIIMS 2008Carbon dioxide and oxygen interact in the blood to enhance each other’s loading andunloading capabilities where concentration extremes exist. The bindings of CO2 tohemoglobin in the tissues augments unloading of oxygen from capillary blood-the Bohreffect. On the other hand, the binding of oxygen to hemoglobin in the alveolar capillarybed augments CO2 unloading from capillary blood into the alveolar the Haldane effect.PaCO2Partial pressure of carbon dioxide in arterial blood. Normal value is 35-45 mm Hg(Ideal 40 mm Hg).Normal paCO2 of venous blood 45 mmHgpaCO2 is indicative of alveolar ventilation.If paCO2 30 Respiratory alkalosispaCO2 50 Respiratory acidosisHigh CO2 is the most important respiratory centre stimulant. If paCO2 65 therespiratory centre becomes insensitive to CO2. In persistent pulmonary hypertension ofnewborn (PPHN) values of pCO2 40-50 mm of Hg with normal pH and pO2 50-70 mm ofHg are acceptable but not ideal. . In bronchopulmonary dysplasia a high pCO2 (45-55 mmof Hg) may be acceptable as long as pH is 7.25 and oxygenation normal. In situation ofpCO2 rise, partial tube blockage, decreased minute ventilation or ventilation – perfusionmismatch should be thought.CO2 contentThe partial pressure of CO2 (the pCO2) is measured in torr (mm Hg). Torr is thenconverted into millimoles of H2CO3 by assuming that for every torr of pCO2 at 37 C,there is 0.03 mmol of H2CO3. The sum of bicarbonate and carbonic acid is the CO2content.23
Deorari , AIIMS 2008CO2 content HCO-3 H2CO3(at pCO2 of 40 mmHg and HCO3 – of 24 mmol/L) 24 40 X 0.03 24 1.2 25.2 mmol/LMeasuring the CO2 content in bloodMajority (95%) of CO2 is inside RBC in form of HCO-3 and carbamino-compound,only 5% is dissolved in plasma.In clinical practice, CO2 content is assumed to be largely bicarbonate (which is usuallytrue) and, therefore; it reflects a base excess (if CO2 content is high) or deficit (if CO2content is low). Note that there is a problem with this way of interpretation. Assume onegets a report that the CO2 content is 12 mEq/1. These 12 mEq/1 are the sum of (HCO-3 )and (H2 CO3).Table VII: CO2 content can mislead(HCO-3)pCO2 x 0.03pHA1026.79B11.80.27.87A- Represents a mix respiratory metabolic acidosisB- is a respiratory alkalosis insufficiently compensatedA CO2 content, therefore, has to be interpreted cautiously. A simultaneousdetermination of pCO2 or pH eliminates the uncertainty.CO2 content is a more complete measure of CO2 present in the plasma in variousforms, but it has no additional advantage over HCO-3 and it follows the same changes ofHCO-3 , which is more accurately measured in acid base disorders.24
Deorari , AIIMS 2008Actual bicarbonate (HCO-3 )HCO-3 in plasma(n) 22-24 mEq/L 20 Acidosis 24 AlkalosisCO2 up and down rulePartial pressure of carbon dioxide may change the levels of bicarbonate depending ondegree and duration of CO2 rise.Relationship between HCO-3 & PaCO2(1) For acute elevation in PaCO2 over 40 mmHg, HCO-3 increases by 1 mEq/L for each10 mmHg paCO2.(2) For acute decrease in paCO2 below 40 mmHg, HCO-3 decreases by 2mEq/L for each10 mm of Hg decrease in paCO2.(3) For chronic elevation in paCO2 over 40 mm of Hg HCO-3 increases 4 mEq/L for each10 mm of Hg increase in paCO2.Standard bicarbonate concentration (SBC)(22-26) mEq/LIt is the concentration of the HCO-3 in the plasma from blood l which is equilibrated tobring the paCO2 to 40 mm of Hg at 37 C i.e. it overcomes the changes in HCO-3 due torespiratory causes and reflects a non-respiratory acid-base change.Under ideal condition SBC HCO3 (n) variation 2 mEq/L. If respiratory acidosis ispresent, HCO3 SBC (because this blood will have a pCO2 40 mm of Hg and therefore25
Deorari , AIIMS 2008when equilibrated to 40 mmHg, some of the CO2 will leave the blood. Hence SBC will belowered).If respiratory alkalosis is present HCO3 SBC (because during equilibration to 40mm some CO2 gets absorbed and therefore SBC increases).Remember following(1) SBC Low – Metabolic acidosisHigh – Metabolic alkalosis(2) Difference between actual HCO3- and SBC indicates respiratory acidosis if HCO3 SBC Respiratory alkalosis if HCO3 SBC(3) When HCO3 SBC then respiratory balance is present-When both are low but equal then compensated metabolic acidosis(4) When SBC is / then HCO3 must also / But /N/ HCO3 - may be associated with (n) SBCActual base excess (ABE)Refers to actual base excess above or below total buffer base (BB). It is in-vitroexpression which mainly reflects non respiratory portion of acid-base.When CO2 accumulates as a result of impaired respiration, the following reactionsoccurCO2 H2O H2CO3 HCO3- H Hb - H HHb26
Deorari , AIIMS 2008The decrease in amount of Hb- buffer is equal to the amount of HCO3- released inthe reaction. Therefore, total amount of buffer anion content will not change.Therefore, changes in the paCO2 will not change base excess.Hence, ABE is a indicator of metabolic status. It attempts to quantify the patientstotal base excess or deficit. Expressed as mmol/L of base above or below the (n)buffer base range. The base excess allows an estimate how much base (if BE isnegative) or acid (if BE is positive) is necessary to bring a liter of blood to pH 7.4.Standard base excess (SBE) buffer base (BB)SBE is same as ABE except that it is an in-vivo measurement which is dependenton the equilibration of the interstitial or ECF compartment of the body and not onlythe blood with CO2.Unlike the ABE – which is the BE in the whole blood in vitro, where bufferingcapacity is due to bicarbonate and hemoglobin, the in-vivo buffering capacity is lessthan in vitro because actually equilibration to the new level CO2 takes place not onlyin the blood but also in the interstitial space. Since the extra-cellular volume of thebody contains about three times more extra-vascular (free of hemoglobin buffer) thanintravascular (rich in hemoglobin buffer) volume, some clinicians like to report thestandard base excess, a base excess assuming hemoglobin of 5 g/dl. This representsthe average buffering capacity of the total extra-cellular volume. Intracellular buffersplay an important role after a disturbance has persisted for some time, particularly insevere acid-base derangements. In such situations, standard base excess does notprovide a useful guide to therapy, one has to titrate until the desired result is achieved.27
Deorari , AIIMS 2008Microprocessors in modern automated analyzers use algorithms that automaticallycalculate variables such as bicarbonate and standard base excess by deriving theblood’s buffering capacity from known hemoglobin values. If an apparatus displayingBE is not available the Siggaard-Andersen Alignment Nomogram allows us to useeither CO2 content with pCO2 or pH, or pH and pCO2 to find bicarbonate.Additionally, it can be used to determine a base excess for well or poorly bufferedsystems. It is simple to use. Just draw a straight line through any two of the knownvariables (pH, pCO2, CO2 content) and read off not only the actual bicarbonate, butalso BE for any appropriate hemoglobin concentration. For standard BE, use 5ghemoglobin/dl blood, unless the patient is severely anemic (Appendix-I)Significance of base excessTotal buffer base (BB) in a neonate is 48-49 mmol/L. Half of this is due to HCO3-,25% due to haemoglobin buffer and another 25% due to protein, sulfate, phosphatebuffers.A value of BE of 5 is considered normal. Abnormal pH with BE -5 (baseddeficit 5) without any decompensation in a stable neonate does not need treatment.Abnormal pH with BE -5 (base deficit 5) with significant imbalance needstreatment. Treatment of neonatal metabolic acidosis consists of general supportivecare and specific measures directed to treat underlying cause. Treatment ofhypothermia, hypovolemia, (anemia, hypoxia and electrolyte disturbances) willusually correct metabolic acidosis secondary to asphyxia or poor tissue perfusion.Antibiotics should be given if sepsis is suspected. Many infants require ventilatorysupport. Bicarbonate is considered by some to be unnecessary and even harmful,28
Deorari , AIIMS 2008leading to changes in cerebral blood flow and paradoxically to increasedcerebrospinal fluid or intracellular acidosis.Simple disorderIn simple acid base disorder pCO2 and HCO3- levels change in the same direction.Simple disorderpHpCO2HCO3-Metabolic acidosis Metabolic alkalosis Respiratory acidosis Respiratory alkalosis The Mixed DisturbanceIf a patient with respiratory insufficiency develops metabolic acidosis, he loses hisability to compensate and a mixed respiratory-metabolic acidosis supervenes.Correspondingly, a mixed respiratory-metabolic alkalosis is also po
Deorari , AIIMS 2008 11 Table IV: Target blood gas values 28 wks 28-40 wks Term infant Infant with PFC with BPD PaO 2 45-65 50-70 80-100 60-80