Transcription
New Jersey Department of EducationEducator Preparation Provider2014 Annual ReportWilliam Paterson UniversityUnit-Level ReportI. BACKGROUNDEducator Preparation Provider (EPP) DescriptionLocation:Wayne, NJInstitution Type:PublicII. CERTIFICATION AND EMPLOYMENTA. Overall Certification and EmploymentWilliam Paterson UniversityAll EPPs State-wideIndividuals obtainingNJ CEAS* betweenSeptember 1, 2010and August 31, 2012IndividualsPercentagePercentageemployed asemployed asemployed asteacher in NJteacher in NJ Public teacher in NJ PublicPublic Schools in Schools in SchoolSchools in SchoolSchool Year 2013- Year 2013-2014Year 2013-20142014**69033348%47%* Individuals completing a traditional route, college- or university-based program obtain a 'Certificate ofEligibility with Advanced Standing' (CEAS)** as of October 15, 2013Data Source: TCIS, NJSMARTData Source Notes :Certification data is submitted to the NJDOE by EPPs and gathered from the NJ Department of Education’sTeacher Certification Information System (TCIS)Employment data is submitted to the NJDOE by school districts and gathered from New Jersey’s studentand staff-level Standards Measurement and Resource for Teaching data system (NJSMART)Higher Education data is submitted to the NJDOE by Institutes of Higher Education and collected from theOffice of the Secretary of Higher Education's Student Unit Record system (NJSURE). Not all Institutes ofHigher Education submit data to the NJSURE database.
B. State of Residence, Certification and EmploymentWilliam Paterson UniversityIndividuals obtainingNJ CEAS betweenSeptember 1, 2010and August 31, 2012All EPPs State-wideIndividualsPercentagePercentageemployed asemployed asemployed asteacher in NJteacher in NJ Public teacher in NJ PublicPublic Schools in Schools in SchoolSchools in SchoolSchool Year 2013- Year 2013-2014Year 2013-2014201424052%38%State of residence461reported as outside ofNJ while enrolled inprogramData Source: TCIS, NJSURE, NJSMART"-" results when at least one number falls below 10C. Number of Endorsements Obtained and EmploymentWilliam Paterson UniversityIndividuals obtainingNJ CEAS betweenSeptember 1, 2010and August 31, 2012Obtained OneEndorsementObtained TwoEndorsementsObtained Three or MoreEndorsementsData Source: TCIS, NJSMART407All EPPs State-wideIndividualsPercentagePercentageemployed asemployed asemployed asteacher in NJteacher in NJ Public teacher in NJ PublicPublic Schools in Schools in SchoolSchools in SchoolSchool Year 2013- Year 2013-2014Year 2013-2014201420049%44%25712348%51%261038%53%2
D. Certification in Teacher Shortage Area and EmploymentWilliam Paterson UniversityAll EPPs State-wideNumber ofNumber ofPercentagePercentageindividuals holding at individuals holdingemployed asemployed asleast one CEASat least one CEAS teacher in NJ Public teacher in NJ Publicobtained betweenemployed asSchools in SchoolSchools in SchoolSeptember 1, 2010teacher in NJYear 2013-2014Year 2013-2014and August 31, 2012‡ Public Schools inSchool Year 20132014Teacher Shortage Area17511063%57%‡Individuals may obtain multiple Certificates of Eligibility with Advanced Standing. Therefore, the totalnumber of CEASs may add up to more than the total number of individuals prepared.Data Description : ‘Teacher Shortage Area’ is defined by the U.S. Department of Education and New Jerseyas Math, Science, Foreign Languages, Bilingual/Bicultural, ESL and Special EducationData Source: TCIS; NJSMART3
E. Certification Endorsement Area and EmploymentWilliam Paterson UniversityAll EPPs State-wideNumber of CEASsNumber ofPercentagePercentageobtained between Individuals Holdingemployed asemployed asSeptember 1, 2010Specific CEASteacher in NJ Public teacher in NJ Publicand August 31, 2012‡Employed asSchools in SchoolSchools in Schoolteacher in NJYear 2013-2014Year 2013-2014Public Schools inSchool Year 20132014‡Elementary SchoolTeacher in Grades K - 633815145%47%Preschool throughGrade 3Elementary School withSubject MatterSpecialization:Mathematics in Grades5 - 8†Elementary School withSubject MatterSpecialization: Sciencein Grades 5 - 8†922830%37%281554%60%211152%61%Elementary School withSubject MatterSpecialization: SocialStudies in Grades 5 - 810330%57%Elementary School withSubject MatterSpecialization: LanguageArts/LiteracySpecialization in Grades5-8281554%58%‡Individuals may obtain multiple Certificates of Eligibility with Advanced Standing. Therefore, the totalnumber of CEASs may add up to more than the total number of individuals prepared.†Indicates teacher shortage areaData Source: TCIS; NJSMART4
E. Certification Endorsement Area and Employment (continued)William Paterson UniversityAll EPPs State-wideNumber of CEASsNumber ofPercentagePercentageobtained between Individuals Holdingemployed asemployed asSeptember 1, 2010Specific CEASteacher in NJ Public teacher in NJ Publicand August 31, 2012‡Employed asSchools in SchoolSchools in Schoolteacher in NJYear 2013-2014Year 2013-2014Public Schools inSchool Year 20132014‡Elementary School with22100%68%Subject MatterSpecialization: WorldLanguage/Spanish inGrades 5 - 8†Teacher ofSupplementalInstruction in Readingand Mathematics,Grades K-8†Students withDisabilities†Blind or VisuallyImpaired†Deaf or Hard of Hearing:Oral/AuralCommunication†Deaf or Hard of Hearing:Sign LanguageCommunication†00N/ANo CEAS Awarded1207865%55%00N/A100%00N/A67%00N/A67%English as a %57%Education†Mathematics†181372%69%Biological Science†9667%68%‡Individuals may obtain multiple Certificates of Eligibility with Advanced Standing. Therefore, the totalnumber of CEASs may add up to more than the total number of individuals prepared.†Indicates teacher shortage areaData Source: TCIS; NJSMART5
E. Certification Endorsement Area and Employment (continued)William Paterson UniversityAll EPPs State-wideNumber of CEASsNumber ofPercentagePercentageobtained between Individuals Holdingemployed asemployed asSeptember 1, 2010Specific CEASteacher in NJ Public teacher in NJ Publicand August 31, 2012‡Employed asSchools in SchoolSchools in Schoolteacher in NJYear 2013-2014Year 2013-2014Public Schools inSchool Year 56%211152%65%00N/A9%211152%41%00N/ANo CEAS AwardedEarth Science†Physical al sh†Chinese†ArtSpeech Arts %45%Health and Physical914549%45%EducationHealth Education00N/A20%Physical Education00N/A48%Driver Education612846%53%Technology iness‡Individuals may obtain multiple Certificates of Eligibility with Advanced Standing. Therefore, the totalnumber of CEASs may add up to more than the total number of individuals prepared.†Indicates teacher shortage areaData Source: TCIS; NJSMART6
E. Certification Endorsement Area and Employment (continued)William Paterson UniversityBusiness: AccountingAll EPPs State-wideNumber of CEASsNumber ofPercentagePercentageobtained between Individuals Holdingemployed asemployed asSeptember 1, 2010Specific CEASteacher in NJ Public teacher in NJ Publicand August 31, 2012‡Employed asSchools in SchoolSchools in Schoolteacher in NJYear 2013-2014Year 2013-2014Public Schools inSchool Year 20132014‡00N/ANo CEAS ness:Keyboarding/Data Entry00N/A100%Business: ComputerApplications andBusiness-RelatedInformation Technology00N/A100%Family and ConsumerSciencesFamily and ConsumerSciences: Child andFamily DevelopmentFamily and ConsumerSciences:Foods/Nutrition andFood ScienceFamily and ConsumerSciences: Apparel,Textiles, and Interiors00N/ANo CEAS Awarded00N/ANo CEAS Awarded00N/ANo CEAS Awarded00N/ANo CEAS AwardedMarketing00N/A33%‡Individuals may obtain multiple Certificates of Eligibility with Advanced Standing. Therefore, the totalnumber of CEASs may add up to more than the total number of individuals prepared.Data Source: TCIS; NJSMART7
F. Praxis II Results: Average Scale ScoreWilliam PatersonUniversityAll IndividualsObtaining CEASfrom NJ EPPsAverage ScaleScoreAverage ScaleScoreElementary SchoolElementary EducationTeacher in Grades K - 6 Content Knowledge(0014; 5014)159162Teacher of Preschoolthrough Grade 3Early Childhood:Content Knowledge(0022; 5022)173174Elementary School withSubject MatterSpecialization:Mathematics in Grades5-8Elementary School withSubject MatterSpecialization: Sciencein Grades 5 - 8Middle SchoolMathematics (0069)169169Middle School Science(0439)159158169168CertificationPraxis II Test(Test Number)Elementary School with Middle School SocialSubject MatterStudies (0089; 5089)Specialization: SocialStudies in Grades 5 - 8Data Source: TCIS"-" results when count of tests falls below 108
F. Praxis II Results: Average Scale Score (continued)William PatersonUniversityAverage ScaleScoreAll IndividualsObtaining CEASfrom NJ EPPsAverage ScaleScoreElementary School with Middle School EnglishSubject MatterLanguage Arts (0049;Specialization: Language 5049)Arts/LiteracySpecialization in Grades5-8167172Teacher of Mathematics Mathematics: ContentKnowledge (0061;5061)150155Teacher of EnglishEnglish Language,Literature andComposition ContentKnowledge (0041;5041)171176Teacher of SocialStudiesSocial Studies:Content Knowledge(0081; 5081)164168CertificationPraxis II Test(Test Number)Data Source: TCIS"-" results when count of tests falls below 109
G. Cumulative GPAWilliam PatersonUniversityAll EPPs StatewideObtained NJ CEASbetweenSeptember 1, 2010and August 31,2012Obtained NJ CEASbetweenSeptember 1, 2010and August 31,20123.343.56Data Source: NJSURE"-" results when count of GPAs falls below 1010
NOTE: All data reported in Sections III and IV is in relation to Number Employed asteacher in NJ Public Schools in School Year 2013-2014III. PLACEMENTA. School ClassificationEmployed Completersworking in:William Paterson UniversityAll EPPs State-wideEmployed in NJ Public Percentage of AllSchools in SY ’13-‘14Employed in NJPublic Schools inSY ’13-‘14Percentage of AllEmployed in NJPublic Schools inSY ’13-‘14All Teachers StatewidePercentage of AllEmployed in NJPublic Schools inSY ’13-‘14Focus School5115%10%10%Priority School93%3%3%Reward School10%1%2%Not Classified27282%86%86%Data Description: 'Focus School' is a school that has room for improvement in areas that are specific to theschool. Focus Schools receive targeted and tailored solutions to meet the school’s unique needs, includingLow Graduation Rates, Largest Within-School Gaps, Lowest Subgroup Performance'Priority School' is a school that has been identified as among the lowest-performing five percent of Title Ischools in the state over the past three years, or any non-Title I school that would otherwise have met thesame criteria.'Reward School' is a school with outstanding student achievement or growth over the past three years.Data Source: NJSMARTB. District Factor Group (DFG)William Paterson UniversityEmployed Completersworking in school inDFG:All EPPs State-wideAll Teachers StatewidePercentage of AllEmployed in NJPublic Schools inSY ’13-‘1417%10%8%11%11%13%16%4%2%2%4%Employed in NJ Public Percentage of All Percentage of AllSchools in SY ’13-‘14Employed in NJEmployed in NJPublic Schools inPublic Schools inSY ’13-‘14SY ational Technical62%1%Other309%7%***All DFG 'A' schools are deemed Teacher Shortage AreasData Description: DFGs represent an approximate measure of a community's relative socioeconomic statusNote: Percentages may not add to 100% as some schools do not have a DFG classificationData Source: NJSMART11
C. Teacher Eligibility for Loan ForgivenessWilliam Paterson UniversityAll EPPs State-wideEmployed in NJ Public Percentage of AllSchools in SY ’13-‘14Employed in NJPublic Schools inSY ’13-‘14Percentage of AllEmployed in NJPublic Schools inSY ’13-‘14All Teachers StatewidePercentage of AllEmployed in NJPublic Schools inSY ’13-‘14Teaching in School with15847%48%44%Eligiblility for FederalTeacher LoanForgiveness ProgramData Description: Eligibility defined as working in school with school population of at least 30% studentsFree or Reduced Price LunchData Source: NJSMARTD. CountyEmployed Completersworking in:AtlanticBergenBurlingtonCamdenCape sexUnionWarrenData Source: NJSMARTWilliam Paterson UniversityAll EPPs State-wideEmployed in NJ Public Percentage of AllSchools in SY ’13-‘14Employed in NJPublic Schools inSY 03%52%319%00%11234%00%72%82%103%31%Percentage of AllEmployed in NJPublic Schools inSY 1%7%1%All Teachers StatewidePercentage of AllEmployed in NJPublic Schools inSY %7%1%12
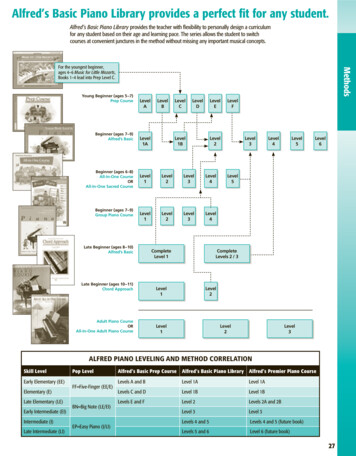
E. Placement MapMaps demonstrate percentage of hired completers in each of New Jersey's countiesData Source: NJSMART13
F. Classroom Assignment: Teacher Shortage AreaEmployed Completersworking in:Teacher Shortage AreaWilliam Paterson UniversityAll EPPs State-wideEmployed in NJ Public Percentage of AllSchools in SY ’13-‘14Employed in NJPublic Schools inSY ’13-‘149428%Percentage of AllEmployed in NJPublic Schools inSY ’13-‘1434%All Teachers StatewidePercentage of AllEmployed in NJPublic Schools inSY ’13-‘1434%Data Description : ‘Teacher Shortage Area’ is defined by the U.S. Department of Education and New Jerseyas Math, Science, Foreign Languages, Bilingual/Bicultural, ESL and Special EducationData Source: NJSMARTG. Classroom Assignment: Content AreaEmployed Completersworking in:William Paterson UniversityAll EPPs State-wideEmployed in NJ Public Percentage of AllSchools in SY ’13-‘14Employed in NJPublic Schools inSY ’13-‘14165%Percentage of AllEmployed in NJPublic Schools inSY ’13-‘145%All Teachers StatewidePercentage of AllEmployed in NJPublic Schools inSY ’13-‘145%Early ChildhoodEducation (PK-K)Elementary ife and Physical134%6%6%Sciences†Foreign Language and124%2%4%Literature†Bilingual/ %Social Sciences and206%6%5%HistoryEnglish Language and3611%2%9%LiteracyPhysical, Health, and4313%7%6%Safety EducationFine and Performing165%5%6%ArtsCareer and Technical00%0%0%EducationOther52%2%3%†Indicates teacher shortage area.Data Source: NJSMARTNote: Percentages may not add to 100% as some individuals' classroom assignments may not be reportedby district14
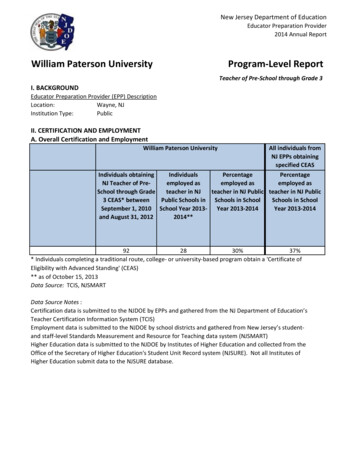
IV. TEACHER INFORMATIONA. Demographics: GenderFemaleMaleWilliam Paterson UniversityAll EPPs State-wideEmployed in NJ Public Percentage of AllSchools in SY ’13-‘14Employed in NJPublic Schools inSY ’13-‘1425677%7723%Percentage of AllEmployed in NJPublic Schools inSY ’13-‘1478%22%All Teachers StatewidePercentage of AllEmployed in NJPublic Schools inSY ’13-‘1477%23%100%Gender80%60%William Paterson UniversityAll EPPs40%Statewide20%0%FemaleMaleData Source: NJSMART15
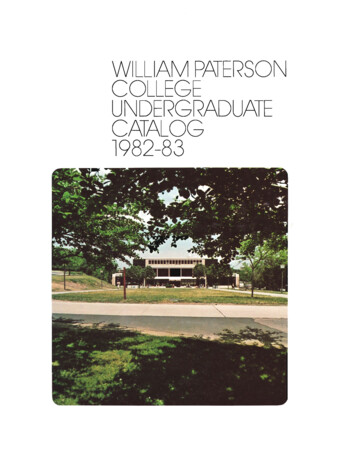
B: Demographics: Race and EthnicityAmerican ite100%90%William Paterson UniversityAll EPPs State-wideEmployed in NJ Public Percentage of AllSchools in SY ’13-‘14Employed in NJPublic Schools inSY ’13-‘1410%10%185%4213%10%Percentage of AllEmployed in NJPublic Schools inSY ’13-‘140%3%4%8%0%All Teachers StatewidePercentage of AllEmployed in NJPublic Schools inSY ’13-‘140%2%7%6%0%86%85%27683%Race and Ethnicity80%70%60%50%40%30%20%10%William Paterson UniversityAll EPPsStatewide0%Data Source: NJSMART16
C. CompensationWilliam PatersonNorth RegionCentral RegionSouth RegionUniversityMedian Salary 50,283 51,078 52,244 49,250Data Description: North Region includes: Bergen, Essex, Hudson, Morris, Passaic, Sussex, and WarrenCounties. Central Region includes: Hunterdon, Mercer, Middlesex, Monmouth, Somerset, and UnionCounties. South Region includes: Atlantic, Burlington, Camden, Cape May, Cumberland, Gloucester, Ocean,and Salem Counties.Note: Data for specified EPP is on individuals obtaining NJ CEAS between September 1, 2010 and August 31,2012 following completion of specified EPP's program and employed as teacher in NJ Public Schools asof October 15, 2013Data for specified region is on individuals from any NJ EPP obtaining NJ CEAS between September 1,2010 and August 31, 2012 and employed as teacher in NJ Public Schools in specified region asof October 15, 2013Data Source: NJSMART17
NOTE: All data reported in Section V and VI is in relation to individuals who Obtained NJCEAS between September 1, 2010 and August 31, 2012, and taught in NJ Public Schoolsin SY 2012-2013V. EDUCATIONA. Transfer StudentWilliam Paterson UniversityIndividuals obtainingNJ CEAS betweenSeptember 1, 2010and August 31, 2012All EPPs State-wideIndividualsPercentagePercentageemployed asemployed asemployed asteacher in NJteacher in NJ Public teacher in NJ PublicPublic Schools in Schools in SchoolSchools in SchoolSchool Year 2013- Year 2013-2014Year 2013-2014201415549%46%Reported as Transfer318Into College orUniversityData Source: TCIS, NJSURE, NJSMART"-" results when at least one number falls below 1018
B. Area of StudyWilliam Paterson UniversityIndividuals obtainingNJ CEAS betweenSeptember 1, 2010and August 31, 2012All EPPs State-wideIndividualsPercentagePercentageemployed asemployed asemployed asteacher in NJteacher in NJ Public teacher in NJ PublicPublic Schools in Schools in SchoolSchools in SchoolSchool Year 2013- Year 2013-2014Year 2013-2014201417547%52%00%57%EducationLiberal Arts andSciences, GeneralStudies and Humanities371-English Language andLiterature/Letters473268%56%Mathematics andStatisticsBiological andBiomedical SciencesPhysical SciencesSocial SciencesHistoryPsychologyComputer andInformation Sciencesand Support ServicesForeign Languages,Literatures, andLinguisticsMulti/ /A68%30%37%45%100%16--60%00N/A55%Visual and PerformingArtsBusiness, Management,Marketing, and RelatedSupport Services331545%47%---29%Data Source: TCIS, NJSURE, NJSMART"-" results when at least one number falls below 10 and above 019
B. Area of Study (continued)William Paterson UniversityIndividuals obtainingNJ CEAS betweenSeptember 1, 2010and August 31, 2012Area, Ethnic, Cultural,Gender, and GroupStudiesNatural Resources andConservationCommunication,Journalism, and RelatedProgramsFamily and ConsumerSciences/HumanSciences0Homeland Security, LawEnforcement,Firefighting and RelatedProtective ServicesAll EPPs State-wideIndividualsPercentagePercentageemployed asemployed asemployed asteacher in NJteacher in NJ Public teacher in NJ PublicPublic Schools in Schools in SchoolSchools in SchoolSchool Year 2013- Year 2013-2014Year ata Source: TCIS, NJSURE, NJSMART"-" results when at least one number falls below 10 and above 0VI: PERSISTENCEWilliam Paterson UniversityIndividuals obtainingNJ CEAS betweenSeptember 1, 2010and August 31, 2012Taught in SY 2012-2013295All EPPs State-wideIndividualsPercentagePercentageemployed asemployed asemployed asteacher in NJteacher in NJ Public teacher in NJ PublicPublic Schools in Schools in SchoolSchools in SchoolSchool Year 2013- Year 2013-2014Year 2013-2014201423379%81%Data Source: TCIS, NJSMART20
William Paterson University Unit-Level Report I. BACKGROUND Educator Preparation Provider (EPP) Description Location: Wayne, NJ Institution Type: Public II. CERTIFICATION AND EMPLOYMENT A. Overall Certification and Employment All EPPs State-wide Individuals obtaining NJ CEAS* between September 1, 2010 and August 31, 2012 Individuals employed as