Transcription
Performance Improvementin Public HealthLos Angeles CountyDepartment of Public HealthDivision of Quality ImprovementPLANDOACTSTUDY
Presentation ObjectivesReview the DPH approach to QualityImprovement (QI) and PerformanceImprovement (PI) Describe the goals and activities ofthe department-wide PI Team Discuss current DPH PI efforts
DPH Quality Improvement Division Includes— Office of the Medical Director(Quality Improvement)Organizational Development andTrainingNursing AdministrationHealth Education AdministrationPublic Health InvestigationPhysician AdministrationOral HealthQuality Professional PracticeScience ReviewService Quality (deferred)
What is PerformanceImprovement?Performance Improvement is a continuousprocess where information and data from anagreed upon set of performance goals andmeasures are reviewed to:1.2.3.Inform managers on the effectiveness of current effortsReport on successes in meeting program goalsPrioritize department resources
The “4 Ts” of QI/PI Training Technical Tools TrackingAssistance
Overview of Performance Improvement (general concepts)Planning for and Measuring PerformanceThe 4-Step Model for ImprovementUsing Logic Models and Process MapsPreparing for Public Health Department gMandatesData TrendsProgress ReviewsAnnual Quality ReportKey Indicators of Health ReportAccreditationToolsTechnicalAssistanceMeasure Selection and UpdatesLong-Term Standard/Target SettingDeveloping Data Collection SystemsGraphs and GIS MapsPlan-Do-Study-Act (PDSA) ModelResults Accountability Principles (modified for Public Health)Structure-Process-Outcome ApproachHealthy People 2010/2020Action Plan Development
PerformanceImprovementTeam
Performance Improvement Team:Overall Goal Create PI processes andtools that: awareness of the linkbetween key strategies andrelated outcomesImprove departmentmanagement and businessdecisions accountability to internaland external partnersPLANDOACTSTUDY
Performance Improvement Team:2010 Goals Adopt a department-wide approach toperformance improvement that is integratedwith the DPH Strategic Plan and track progressAssess data sharing capacity between programsand plan for a centralized reporting systemCreate educational workshops for performanceimprovement training needs across thedepartment
Tool #1PDSA ModelPLANDOACTSTUDY
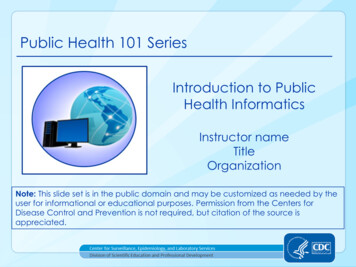
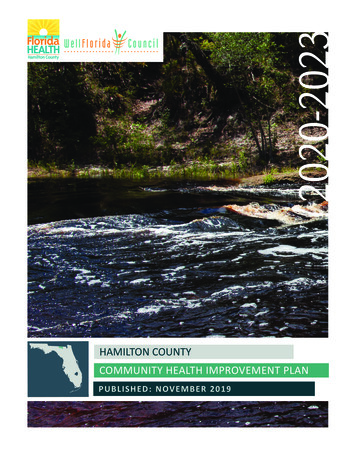
Tool #2Results AccountabilityPOPULATION INDICATORS(measures of population-levelhealth outcomes)ANDPERFORMANCE MEASURES(measures of programeffort and output)Public HealthMeasures
Tool #3Structure-Process-Outcome Structure – “Conditions” under which public healthservices are provided to include material resources,human resources, and organizational characteristicsProcess – “Activities” that constitute and supportthe delivery of public health servicesOutcome – “Changes” (desirable or undesirable) inindividuals and populations that result from thedelivery of public health servicesAdapted from: Avedis Donabedian. An introduction to quality assurance in health care.Oxford University Press, 2003: pp. 46-47.
DPH PerformanceImprovement Efforts
Multiple DPH PerformanceImprovement EffortsStructureCounty LevelDepartment LevelProgram/SPA LevelProcessOutcomeShort-TermLong-TermPerformance Counts!Operational MeasuresIndicatorsPublic HealthReport Card“Key Indicators of Health”andOther ReportsPublic Health MeasuresPerformance MeasuresPopulation Indicators
Integration of Efforts 1.2.3.National EffortsHealthy People 2010/2020Accreditation of LHDCDC Guidelines orPerformance Measures 1.2. 1.2. 1.2.State EffortsPerformance MeasuresMandates and RegulationsCounty EffortsPerformance Counts!County Progress ReportDepartment EffortsPublic Health MeasuresPublic Health Report Card
PI—Key Indicators of HealthReport Report is based on resultsfrom several surveys thatprovide local-level dataHealthy People 2010targets are used as thecomparison or“Standard” value toachieveShows results bygeographic anddemographic criteria
PI—Public Health Report Card
PI—Public Health Report Card
PI-Public Health Measures Los Angeles County Public Health approachnamed the Public Health MeasuresBased on the Results Accountability Framework*Emphasis on program-level performance linkedto “shared” population-level health outcomesIntegrated with Healthy People 2010,NACCHO/Accreditation Standards, theCommunity and Clinical Guides, grant metricsand guidelines*Friedman, Mark. “Trying Hard is not Good Enough: How toProduce Measurable Improvements for Customers and Communities.”2005. Trafford Publishing. Victoria, BC, Canada. www.raguide.org
Public Health Measures Championed as a QI effort in 200240 Public Health units identified “populationhealth indicators” linked to programperformance measures to follow over timeHealthy People 2010 objectives often identifiedand used as the “Standard” to achieve over time
Public Health MeasuresPOPULATION INDICATORS(measures of population-levelhealth outcomes)ANDPERFORMANCE MEASURES(measures of programeffort and output)Public HealthMeasures
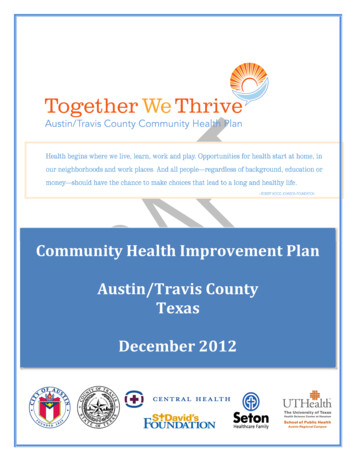
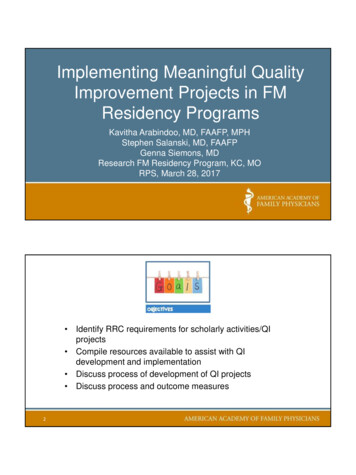
Public Health MeasuresPopulation HealthProgram Goal 1IndicatorStrategy 1Goal 1Measure 1IndicatorStrategy 2Goal 2Measure 2NACCHOStandardsFederal, State,or Community GuideClinical GuideOther Sources
Example: Immunization ProgramPopulation Goal To reduce morbidity and mortality from vaccine-preventablediseases by improving immunization levelsPopulation IndicatorPercentage of children, ages 19-35 months, who are fully immunized with oneof the series of the Advisory Committee on Immunization Practices (ACIP)recommended vaccinesEffective, Evidence-Based Strategies (selected subset)1. Change provider behavior through systems change—Provider recall/remindersystems in clinics2. Change provider behavior through education—multi-component interventionswith education3. Increase demand and access to immunizations—reduce out-of-pocket costsProgram Performance Goal (NACCHO Standard 9)Performance MeasurePercent of Immunization Program public and nonprofit clinic partners whoroutinely meet the Standards for Pediatric Immunization Practices for provider andclient recall/reminder systems
Summary The Quality Improvement Division has 4 functionalareas in which it focuses its effortsPerformance Improvement is the area that linksstrategic planning and outcome measurement to ensureprogram successTools include PDSA, “Results Accountability”, andStructure-Process-OutcomeThe Performance Improvement Team assists thedepartment in developing new tools and processes tointegrate performance improvement efforts acrossNational, State, County, and Department levels
Applying PerformanceImprovement to DailyOperationsPLANDOACTSTUDY
Presentation Objectives Understand how strategic planning goals andobjectives can be translated into measurement ofpopulation-level outcomes and daily operationsDescribe key components of the PDSA modelProvide an interactive learning session to helpyou develop a strong PI effort in your Programor SPA
The PDSA Model PLANConnect and link goals tomeasurable outcomesDOImplement evidence-basedactivities tracked with datacollectionSTUDYEvaluate progress towardstandards/long-term targetsACTRespond to what results tell usPLANDOACTSTUDY
PDSA ModelLink Goals to MeasurableOutcomes Determine prioritiesand goals Select PopulationIndicators andPerformance Measures Set standards/long-term targetsRespond to whatthe results tell usImplement evidencebased interventions andrespond to mandatesPLANDOACTSTUDYEvaluate progress towardPopulation Indicator andPerformance Measure standards
Determine Priorities and Goals1.2.What are the prioritypublic health issues inLos Angeles County?What are the behaviorsand outcomes relatedto these issues that wewant for people wholive in LA County?SPA/ProgramStrategic PlanDPH Strategic PlanCounty Strategic Plan
Linking Indicators and Measures3. How can we measure these conditions?POPULATION INDICATORS(measures of population-levelhealth outcomes and behaviors)ANDPERFORMANCE MEASURES(measures of programeffort and output)Public HealthMeasures
Population Indicators Longer life spanIncreased quality of lifeIncreased health equityLess diseaseLess premature deathHealthier choicesSafer environmentHealthier homesPOPULATION-LEVELHEALTH OUTCOMES& BEHAVIORS
Population Indicators Percent of students who had at least one drinkof alcohol in the past 30 daysRate of foodborne illness hospitalizations eachyear (per 100,000)Percentage of children covered by healthinsuranceDeath rate from colorectal cancer
Resources Healthy People 2010http://www.healthypeople.gov/ DPH Key Indicators of Health Report Other Indicator ReportsOlder Americans: Key Indicators of Well-Being American Children: Key Indicators of Well-Being
Performance Measures1.2.3.4.5.Who are our clients?Which services do weprovide to our clients?What evidence-basedstrategies will lead topositive change in ourclients?How can we measure ifour clients are better off?How can we measure ifwe are delivering serviceswell?QuantityInput /EffortQualityHowHow WellMuch Did Did WeWe Do? Do It? (%)(#)OutputHowQuality of/ EffectMuchChange?Change?(%)(#)
Performance Measures Policies CreatedPeople InformedPartners EngagedSurveillance PerformedInvestigations CompletedIncreased Access to ServicesClient satisfactionMEASURES OFPROGRAMEFFORT & OUTPUT
Performance Measures Percent of outbreaks (excluding scabies)investigated within standard timeframePercentage of children under 6 years whoparticipate in fully operational population-based[immunization] registriesNumber of cities that adopted a policy thatprohibits smoking in outdoor areas
Performance Measures Framework3 Core Functions (1988)AssessmentPublic HealthMission1. Protect Health2. Prevent Disease3. Promote Health &Well-Being10 EssentialServices (1994)Policy DevelopmentAssurance10 Standards for LocalHealth Departments(NACCHO, 2005)11 Domains for Local PublicHealth Accreditation(PHAB, 2009)
NACCHO Standards Monitor health status of the communityProtect people from health hazardsGive people information to make healthy choicesEngage the community to solve health problemsDevelop and advocate for public health policiesEnforce laws and regulationsHelp people receive health servicesMaintain a competent public health workforceEvaluate and improve programsContribute to and apply public health researchCore Business Functions (DPH re/accreditation/opdef.cfm
Ideal PIs/PMs Prioritization Criteria1)2)3)Evidence CriteriaEvidence CriteriaData CriteriaOther RationaleData CriteriaOther RationaleIDEAL INDICATOR OR MEASURE
Strategic Plan ProgressReporting Template
2010 Annual Performance Report Internal report of selected Population Indicatorsand Performance MeasuresIncludes:Traditional Report Card results NEW Program Performance Snapshots In-Person Progress Review with Dr. Fielding
Questions?PLANDOACTSTUDY
Small Group ExerciseYou are the Director of the Chronic Disease Divisionat your local County Department of Public Health.The Health Officer is championing interventionsthat will decrease obesity throughout the County.She wants you to create a set of priority objectivesand performance metrics based on the bestscience. Your objectives and metrics will be usedto engage stakeholders, pursue fundingopportunities, and assess overall effectiveness andefficiency of your prioritized interventions.
Performance ImprovementPDSA ModelLink Goals to MeasurableOutcomes Determine prioritiesand goals Select PopulationIndicators andPerformance Measures Set standards/long-term targetsRespond to whatthe results tell usImplement evidencebased interventions andrespond to mandatesPLANDOACTSTUDYEvaluate progress towardPopulation Indicator andPerformance Measure standards
Rapid-Cycle PDSA Projects
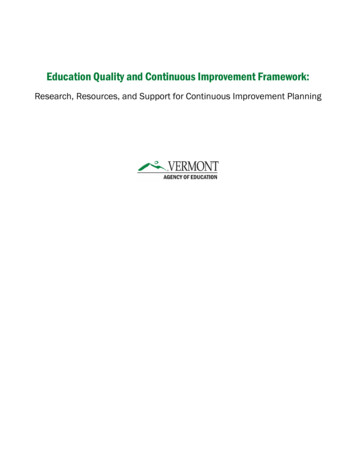
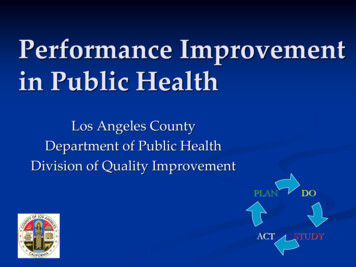
Example: Telephone Hotline ActivationVirginia Department of Public HealthTrigger:Threat topublic healthor emergencyRequesthotlineSet upcall centerAuthorizeactivationDevelopmessagesRecruitand veaccurateinformation
Hotline # and message publicizedvia:Media-paid-freeReferralSourcesLA CO DPH/DHSResources-211-community liaisonRNs-LA CountyHelps-other hotlines-Schools-DHS/PPP Clinics-DPSSOther sWorkforce/EOCWoman has #Call takertrainingWoman calls hotline# of new callers/weekDatacollectionCall answeredEducation(risk assessment)% of callers whoseinformation needs are metIncrease in CVDawarenessPopulation Rate ofCVD risk factorsPopulation Rate ofCVDAssess eligibility &make appointmentWoman has ongoingaccess to preventivehealth servicesReduced CVD Risk factors among target populationReduced CVD rates among low income womenWoman attendsappointment% of womenofferedappointment whoattend
Use PDSA Cyclesto Test and Implement ChangesAct: Take actionbased on the newknowledgeStudy: Comparepredictions to the testresultsPlan the details of thetest and predict theoutcome of the testActPlanStudyDoDo: Conduct the testand collect data
Using Repeated PDSA cycles over timeleads to changes that result in improvementThe Breakthrough Series: IHI’s Collaborative Model for Achieving Breakthrough Improvement. IHIInnovation Series white paper. Boston: Institute for Healthcare Improvement; 2003
Department-Level Operations CEO and DPH set apriority of completing moreemployee PerformanceEvaluations on time Performance Measureestablished on PH ReportCard in 04-05 Baseline is 36%andStandard is set at 100%PLAN Current supportiveinterventions are continuedwith more frequent andfocused reminders forless compliant supervisorsACTDO CEO and DPH HRsend out reminders tosupervisors and HealthOfficer reinforces thisPriority with ExecutiveTeamSTUDY Evaluation of trend datashows an improvement to66% on the 05-06 PH ReportCard Standard of 100% not achieved
Program-Level Operations IP set a prioritythat as many children aspossible are fully immunized Population Indicatorand Performance Measureestablished in approvedPublic Health Measures Standards chosen(80% fully immunizedReach 4000 providers) IP implements an evidencebased provider educationalintervention for 2 yearsPLANDOACTSTUDY Continue with acceleratedprovider educational efforts Set new standard/target Consider new or additionalinterventions Evaluation of 2 year trend datashows that the intervention reached6096 providers in year 1 but only 3673providers in year 2 Immunization rates stable at 80%
Annual TimelineJanFebMarAdd/Modify/DropPublic HealthMeasuresAprMayDataCollectionJuneJulySelect FY PriorityIndicators nProgress Reviews with Health Officer(scheduled throughout the year)Performance Improvement Training(offered throughout the year)PDSA Improvement ProjectsNovDecPrepare CEO andDPH PerformanceReports
Summary The PDSA Model is central to PI efforts andcan be applied to daily operations and long-termsuccessProgress toward improved health behaviors andoutcomes is captured in Populations IndicatorsAssessing the output of our core daily activitiesis captured in Performance MeasuresFuture Skill building workshops on how to usethe PDSA model are being developed
Summary The Quality Improvement Division has 4 functional areas in which it focuses its efforts Performance Improvement is the area that links strategic planning and outcome measurement to ensure program success Tools include PDSA, "Results Accountability", and Structure-Process-Outcome The Performance Improvement Team assists the