Transcription
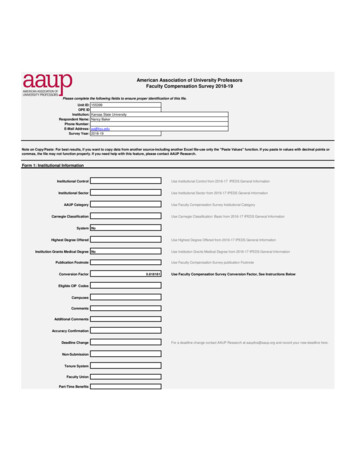
American Association of University ProfessorsFaculty Compensation Survey 2018-19Please complete the following fields to ensure proper identification of this file.Unit ID:OPE IDInstitution:Respondent Name:Phone Number:E-Mail Address:Survey Year:155399Kansas State UniversityNancy Bakerpa@ksu.edu2018-19Note on Copy/Paste: For best results, if you want to copy data from another source-including another Excel file-use only the "Paste Values" function. If you paste in values with decimal points orcommas, the file may not function properly. If you need help with this feature, please contact AAUP Research.Form 1: Institutional InformationInstitutional ControlUse Institutional Control from 2016-17 IPEDS General InformationInstitutional SectorUse Institutional Sector from 2016-17 IPEDS General InformationAAUP CategoryUse Faculty Compensation Survey Institutional CategoryCarnegie ClassificationUse Carnegie Classification: Basic from 2016-17 IPEDS General InformationSystem NoHighest Degree OfferedUse Highest Degree Offered from 2016-17 IPEDS General InformationInstitution Grants Medical Degree NoUse Institution Grants Medical Degree from 2016-17 IPEDS General InformationPublication FootnoteConversion FactorUse Faculty Compensation Survey publication Footnote0.818181Use Faculty Compensation Survey Conversion Factor, See Instructions Below0.818181Eligible CIP CodesCampusesCommentsAdditional CommentsAccuracy ConfirmationDeadline ChangeNon-SubmissionTenure SystemFaculty UnionPart-Time BenefitsFor a deadline change contact AAUP Research at aaupfcs@aaup.org and record your new deadline here.
American Association of University ProfessorsFaculty Compensation Survey 2018-19Form 2: Number, Total Salaries, and Tenure Status of Full-Time Instructional FacultyMENWOMENAcademic RankNumberofFacultyTotal ContractedSalaries ( Total ContractedSalaries ( )Not TenureTrackOn TenureTrackTenuredSection 1. Faculty on 9-Month Contracts (Regardless of Number of Salary tantInstructorLecturerNo 181027900081611100000171Section 2. Faculty on 11- or 12-Month Contracts (Actual nstructorLecturerNo RankTOTALSection 3. 9-Month Contracts Plus 11- or 12-Month Contracts (Converts 11- or 12-Month Salaries and Calculates stantInstructorLecturerNo 25000133193144100033862115106126240433
Form 3: Major Benefits for Full-Time Instructional Faculty, 2018-19If reporting by rank, use the cells below. Otherwise, use "Undifferentiated Rank" to the re ( ) No. Cov.TotalExpenditure( )ASSISTANTNo. Cov.TotalExpenditure ( )Section 1. Faculty on 9-Month Contracts (i.e., regardless of number of installments)1. Retirement2,032,9081951,899,8982351,475,5312. Medical1,513,1031881,792,6252261,537,1363. Dental67,97418780,88722566,655INSTRUCTORNo. Cov.TotalExpenditure( )LECTURERNo. Cov.TotalExpenditure( )NO RANKNo. Cov.TotalExpenditure( )Totals by RankNo. 00404004040400004,182,71860,7150196,315458,7480 480000000005. Disability000006. Tuition000007. FICA1,329,9871951,239,933235962,9788. Unemployment19,30619517,99923513,9789. Group Life0000010. Worker's Comp.62,42319558,19623545,19711. Other*145,869195135,992235105,61712. TOTAL5,171,5701955,225,5302354,207,092Section 2. Faculty on 12-Month Contracts (i.e., on actual basis, no conversion)1. Retirement913,41662447,39139451,3372. Medical538,95761294,96436333,6673. 04,205013,59731,7741,095,2590039390393939Section 3. 9-Month plus 12-Month converted** (Calculates automatically)1. Retirement2,780,2482572,265,9452742. Medical**2,052,0602492,087,5892623. Dental**92,29724794,5052614. (Optional) Medicalcombined w/dental5. Disability**6. Tuition**7. FICA8. Unemployment**9. Group Life10. Worker's Comp.11. Other*12. 84,2980002742740274274274*Benefits in kind reported under "Other" are those with cash alternatives (e.g., moving, travel, housing, etc.)**Benefits that are not computed as a percentage of salary are not subject to conversion (medical, dental, disability, tuition, unemployment, other)Please refer to instructions below for complete definitions.No. Cov.: The number of faculty included (covered) in the benefit expenditures.TotalExpenditure( )No. 180613,5570 00000004. (Optional) Medicalcombined w/dental00591,2458,582027,75064,8462,169,119No. Cov.2041971904. (Optional) Medicalcombined w/dental5. Disability6. Tuition7. FICA8. Unemployment9. Group Life10. Worker's Comp.11. Other*12. TOTALTotalExpenditure( )UNDIFFERENTIATEDRANK
Form 4: Salaries and Percentage Increase for ContinuingInstructional Faculty, 2018-19Please Note: Individuals reported in Number of Continuing Faculty should be only those who held faculty positions in BOTH 2018-19 and2017-18. This number will almost always be smaller than that in Form 2. Report individuals in the row for the rank the person held in2017-18. For those institutions not able to complete Columns B, C, or D, see the instructions and the Form 3 Estimate tab. PreviousYear (2017 - 2018) outlay is the last year's salary outlay of CURRENT continuing faculty members. Salaries of faculty that are no longerworking at your institution or newly hired in 2018 - 2019 should NOT be included in Form 4.Section 1. Full-time Faculty on 9-Month ContractsAcademic Rankin 2017-18Number of Continuing Faculty1. Professor1692. Associate2213. Assistant2094. Instructor1275. Lecturer176. No Rank7. TOTAL743Section 2. Full-time Faculty on 12-Month ContractsAcademic Rankin 2017-18Number of Continuing FacultyTotal Salary OutlaysCurrent Yr. (2018-19)Previous Yr. 1,07761,770,71960,998,015Total Salary OutlaysCurrent Yr. (2018-19)Previous Yr. (2017-18)1. Professor527,973,8832. Associate344,047,2663. Assistant424,137,8954. Instructor412,709,5145. Lecturer4274,0436. No Rank7. TOTAL17319,142,601Section 3. 9-Month plus 12-Month Converted (Calculates automatically)Academic Rankin ructorLecturerNo Rank7. TOTALNumber of Continuing 18,911,330Total Salary OutlaysCurrent Yr. (2018-19)Previous Yr. (2017-18)Percentage age age %91677,432,83176,470,9061.26%
Form 5: Administrative Compensation 2018-19Confidentiality Notice:The figures supplied in this section will be used for aggregate calculations only; they will not bepublished or disclosed for individual institutions.Base SalaryPresident/Chancellor500000Chief Academic Officer400000Chief Financial Officer240875Chief Development OfficerChief Administrative OfficerChief Counsel213207Director of Enrollment ManagementDirector of Athletics500000Supplement
Form 6: Number, Total Salaries of Part-Time Instructional Faculty and Graduate Teaching Assistants, 2017-18These figures will be used to produce a third appendix this year where each institution's data will be reported individually. Please note we are asking for data from theprevious academic year.Academic Rank1. Part-Time Per Section FacultyAcademic Rank2. Graduate Teaching AssistantsNumber ofFacultyMinimumper Section1SalaryMaximumper Section1SalaryMean Salaryfor PerSection1FacultyDo Part-Time PerSection Faculty have2Retirement Benefits?Do Part-Time PerSection Faculty have2Medical Benefits?0Number aximumSalary30,000AverageSalaryDo GTAs haveRetirement Benefits?215,604 NoDo GTAs haveMedical Benefits?2yes-all
Survey Year: 2018-19 Form 1: Institutional Information . American Association of University Professors . (Regardless of Number of Salary Installments) 1. Professor 147 16,483,076 0 0 147 48 4,968,429 0 0 48 2. Associate 138 12,243,650 1 8 129 97 7,755,284 1 1