Transcription
Proceedings of the World Congress on Engineering 2011 Vol IWCE 2011, July 6 - 8, 2011, London, U.K.Quality Improvement Practices Adopted byIndustrial Companies in PortugalIsabel S. Lopes, Eusébio P. Nunes, Sérgio D. Sousa, and Dina Esteves Abstract— In an increasingly competitive market, companieshave the need to seek and implement best practices tocontinuously improve their processes. Recently, several qualitymanagement tools and quality improvement methodologieshave emerged in literature. However, there is a gap betweentheory and practice. This study aims to assess to what extentthe methodologies and tools cited in literature are used byindustrial companies in Portugal. A questionnaire wasdeveloped to investigate both the importance, perceived byrespondents, to each tool and methodology, and its level of use.The motivational factors and barriers to their implementationwere also investigated. The questionnaire was sent to industrialcompanies of different sectors and 83 answers were analyzedbased on descriptive statistics and statistical tests. Results showevidence about the perceived importance and implementationlevel of quality improvement practices in industries in Portugal.It also contributes to understand the factors that influence theuse of such quality improvement techniques.Index Terms— Continuous improvement,improvement, Quality Tools, Questionnaires, SurveyQualityI. INTRODUCTIONOver the years there has been an increase in globalcompetition among various sectors as a result of fast,deep and frequent changes all over the world and, thereforea fast technological innovation and proliferation of offeredproducts (particularly in terms of variety and possibility ofcustomization). In this market context, to ensurecompetitiveness, companies have to continually seek bestpractices in order to improve processes, products andservices and to achieve agile and flexible costumer servicesand competitive costs.The quality of processes, products and services is animportant factor in business strategies, and therefore hasbeen changed to suit the reality that businesses face. Then,companies have to continually improve their processesthrough the implementation of adequate methodologies andtools. Several continuous improvement tools andmethodologies appear in literature, and several applicationManuscript received March 06, 2011; revised March 29, 2011.I. S. Lopes is with the University of Minho, EE-DPS, Campus deGualtar, 4710-057 Braga, Portugal (phone: 351-253604762; fax: 351253604761; e-mail: ilopes@dps.uminho.pt).E. P. Nunes is with the University of Minho, EE-DPS, Campus deGualtar, 4710-057 Braga, Portugal (e-mail: enunes@dps.uminho.pt).S. D. Sousa is with the University of Minho, EE-DPS, Campus deGualtar, 4710-057 Braga, Portugal (e-mail: sds@dps.uminho.pt).D. Esteves is with the University of Minho, EE-DPS, Campus deGualtar, 4710-057 Braga, Portugal (e-mail: dinaesteves@portugalmail.pt).ISBN: 978-988-18210-6-5ISSN: 2078-0958 (Print); ISSN: 2078-0966 (Online)cases are also found. However, comparative studies of thesetools and methodologies are scarce [1].Scott et al. [2] present a quantitative survey aboutcontinuous improvement programs adopted by the Canadianfood industry, distinguishing companies by: ownership(private and publicly-traded), size (small, medium and bigcompanies) and products (processed and non-processed).The study has revealed that 55.2% of respondentsrecognized using one or more continuous improvementmethodology, and the larger is the size of the company, thelarger is the percentage. The study also identifies themethodology used more often and the more importantmotivational factors considered by the companies that haveimplemented continuous improvement programs.Terziovski and Sohal [3] present a study undertaken inAustralian manufacturing companies as part of a widerinternational survey investigating continuous improvementpractices in Australia, Denmark, Finland, Sweden,Netherlands, and UK. The study identifies the tools moreoften used by Australian companies and the issues addressedfrequently in the continuous improvement process.In Portugal, no similar study is known. However, this typeof study allow to ascertain the current state of the practice ofQuality continuous improvement programs in the countryand identify the advantages of their implementation and thedifficulties that arise in obtaining such advantages.In order to investigate the continuous improvementpractices used by manufacturing companies in Portugal, aquestionnaire was developed with the following objectives: Find out the continuous improvement methodologies andtools known and more often used in Portuguesemanufacturing companies; Identify the motivational factors underlying theirimplementation; Identify the factors that discourage companies to adoptquality improvement methodologies and the difficultiesfaced in the implementation stage; Identify differences between companies with differentsizes and between companies which have a certified qualitymanagement system and companies which do not have.II. LITERATURE REVIEWA. Quality improvement methods and toolsQuality improvement is the basis of modern qualitymanagement systems and a requirement of ISO 9001:2008.Quality improvement can be classified into “continuousimprovement” and “discontinuous improvement”. These twotypes are also called “Continual Improvement” [4]. TheWCE 2011
Proceedings of the World Congress on Engineering 2011 Vol IWCE 2011, July 6 - 8, 2011, London, U.K.PDCA cycle and Kaizen techniques are examples of theformer which continuously seek for small improvementswhereas, quality improvement projects and six-sigmaprojects are examples of the latest and seek for drasticimprovements or innovations. Companies can use both typesof quality improvement. Bunney and Dale [5] argue that “theuse of quality tools and techniques (QTs) is a vitalcomponent of any successful improvement process” p.188.To increase the effectiveness and efficiency of qualityimprovement companies should use established QTs.Many QTs are generally accepted by most authors andpractitioners. For example, the seven basic quality tools andmany others are described in [6] or [7]. However,organizations may not benefit from the use of every tool andthere are some authors that suggest the way to select theappropriate tool [8].Empirical data of Portuguese small and medium-sizedenterprises (SMEs) [9] suggest that SMEs’ managersrecognize the importance of QTs but only a few tools have asignificant use. Terziovski and Sohal [3], concluded thatorganizations use more frequently the basic quality tools andless frequently techniques like FMEA (Failure Mode andEffect Analysis) or QFD (Quality Function Deployment).Tari and Sabater [10] also concluded that a small number oftools are used in each company, but the level of use wasdependent of the organization sector and size. This suggeststhat there are factors that can motivate or hinder the use ofsuch tools.B. Motives and barriers for quality improvementQuality improvement and QTs may be used withincertified quality management systems, and some studiessuggest that external factors are the main motive to adoptsuch quality improvement programs [11] while other studiesargue that internal factors [3] are the main motives to adoptquality improvement.Assuming the existence of successful reports of qualityimprovement (for example by quality gurus) and assumingthe existence of several motives for its adoption byindustries, there should be constraints that would not allowits generalized adoption.Adebanjo and Kehoe [12] performed a study in the UK, toidentify the problems associated with implementation ofTQM in industries. The main factors were related to: HumanResources, materials and equipment, employees’ attitude,top management, financial resources, inappropriate trainingand inappropriate methods. [13] and [14] also confirm theabove problems and other studies [15], add the culturalfactor as a potential barrier to quality improvement. Thiswork will complement and update a previous workperformed in 2003 [9].C. HypothesesThe main objective of this work is to get empiricalevidence about the current level of use of qualityimprovement programs and QTs of industries in Portugal.To determine the managers’ knowledge about qualityimprovement tools it is also an objective to ascertain theperceived importance of each quality tool. The firsthypothesis is that industrial companies in Portugal useISBN: 978-988-18210-6-5ISSN: 2078-0958 (Print); ISSN: 2078-0966 (Online)quality improvement programs (H1a) and QTs (H1b). Thelevel of perceived importance of each qualitymethodology/tool is higher than its level of use withincompanies (H2a/H2b). There are factors that can trigger theadoption of QTs (H3a), and factors that can hinder suchadoption (H3b). There are factors that can hinder the use ofsuch quality improvement tools and techniques (H3c). Theresults of previous hypotheses may be affected by the type ofcompany (i.e. if it is certified or non-certified) (set of H4hypotheses) and may be dependent on company’s size (set ofH5 hypotheses).III. METHODSA. QuestionnaireA questionnaire was developed based on literature review.All the questions were organized in four sections. Sectionone includes general information about the respondents.Section two intends to ascertain whether companies havequality improvement programs implemented and theimportance attributed to each programs, such as: TotalQuality Management (TQM), Six Sigma and TotalProductive Maintenance (TPM). A four point scale was usedfor the level of implementation and for the level ofimportance (1-none, 2- low, 3- moderate, 4- high). Themotivation for the adoption of quality programs was alsoascertained in this section. The degree of agreement with theproposed motivational factors was registered based on a fourpoint scale (1- strongly disagree, 2- disagree 3- agree, 4completely agree).In section three, several QTs are listed to investigate thefrequency of use and the degree of importance considered byrespondents for each tool.In order to ascertain the barriers to the adoption of qualitymethodology, section four presents a list of barriers cited inliterature. In the same section, another list for barriers onimplementation of quality methodology was made to beanswered by firms who have already implemented somemethodology.B. SampleBefore sending the questionnaire to companies, a pilotsurvey was made to test the validity of the questionnaire andto detect errors in the formulation of questions. Thequestionnaire was analyzed by experts in qualitymanagement and by nine practitioners. Based on theprovided opinions, some changes were made to improveinformation gathering, mainly in some questions about thebarriers of implementation/adoption and in therecommendation for filling. Then, the final version of thequestionnaire was sent by email to one thousand companiesselected randomly. After 5 days, telephone calls were madeto companies who had not yet returned the questionnaire toimprove the response rate. 83 completed questionnaires werereturned, resulting in a response rate of 8.3%.65% of questionnaires were completed by the qualitydirector of the company, 5%, by the production director, 5%by the CFO and the remaining 25% by people with otherpositions in the company. Most respondents (58%) performfunctions in their current positions for over five years, 28%WCE 2011
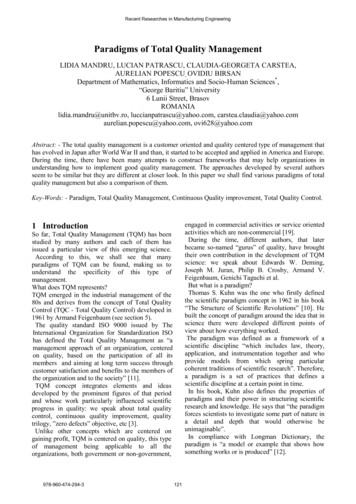
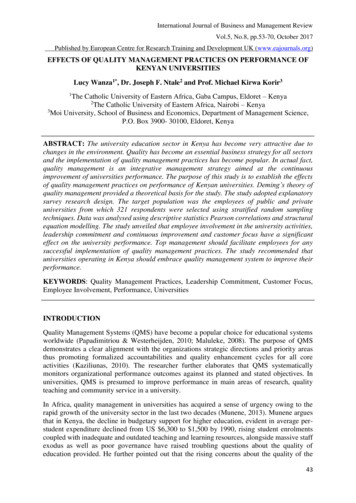
Proceedings of the World Congress on Engineering 2011 Vol IWCE 2011, July 6 - 8, 2011, London, U.K.of respondents have their current positions for 2, 3 or 5 yearsand 14% for less than 2 years. By these results, it can bestated that most respondents have acquired sufficientexperience and knowledge about the process of qualitymanagement in the company to respond coherently to thequestionnaire.Several sectors of activity are covered by the study: 27%of firms surveyed belong to the food sector, 20% belong tothe metallurgical/mechanical engineering, 12% belong to thesector of components for the automotive industry, 11% fortextile sector, 2% to the sector of wood products and, finally,20% are from other sectors.Information about firms dimension was also gathered. Thestudy includes companies of different sizes: 42% of thesurveyed companies have between 51 and 250 full-timeemployees, 35% have between 10 and 50 and 23% havemore than 250. No surveyed company has fewer than 10employees.C. Data analysisData analysis was based on means for each response. Thet-test was also used to test hypotheses of differences inmeans. All t-tests performed use a significance level of 0.05.Since it was supposed that firms certified by a qualitymanagement standard are more familiar with themethodologies and QTs than non-certified companies, theresults obtained for the certified companies were comparedwith results for non-certified companies. From the returnedquestionnaire, it was noted that 80% of the surveyedcompanies have a certified quality management system.It was also supposed that the size of the organization mayinfluence the use of methodologies and tools, themotivational factors and the barriers to the adoption orimplementation of quality programs. Therefore, the resultsfor companies with different sizes were compared using ttest: companies that employ between 10 and 50 full-timeemployees (small companies), those that employs between50 and 250 full-time employees (medium companies), andthose with more than 250 employees (large companies).IV. RESULTS AND DISCUSSIONIn the following sections, the results and their analysis arepresented in the order they appear in the questionnaire. Thefirst section refers to the importance and use of qualityimprovement methodology and tests the differences inresults between certified and non certified companies andbetween companies with different sizes.In the section B, the same analysis is made for theMethodologyCycle PDCATQM5STPMKaizen8DSix-sigmaEFQMMeanStandard 20motivational factors that lead to the implementation ofquality improvement practices (methodologies and tools).Using the same approach, section C presents analysis ofresults for quality management tools and section D, analysisof results for the barriers in the adoption and during theimplementation of quality Programs.A. Quality MethodologiesFor each considered quality methodology the mean of theresults was calculated for the perceived importance andimplementation level (columns designated by “global” inTable I). The considered quality methodologies are listed inthe first column of table I. The means of the results forcertified and non certified companies, for small, medium andlarge companies are also presented.From the analysis of the table, some conclusions can bedrawn: (i) all the cited methodologies were consideredimportant by companies (mean above 3), highlighting thePDCA methodology as the most important, (ii) the degree ofimplementation of these methodologies in business appearsto be lower than the given importance - only the PDCAcycle has a mean value above 3, (iii) Six-sigmamethodologies and EFQM are those with a lower level ofimplementation. These results may be related to the fact thatthese methodologies are more demanding in terms ofimplementation, requiring a higher level of quality maturity.Regarding the means for certified companies, it can beadded that the methodology with the higher mean for theperceived importance and implementation is the PDCAcycle followed by TQM. This result is coherent since thequality management standard is based in TQM and in thePDCA cycle. For non-certified companies, the mostimportant methodology is 5S followed by PDCA cyclewhich are also the most implemented methodologies.For small companies, PDCA cycle and 5S are also themost important methodologies. For medium and largecompanies, the most important are PDCA cycle and TQM.For large companies, the same mean was obtained for TQMand Kaizen. Concerning the implementation, the PDCAcycle is highlighted for all size with mean values above 3.Overall, the level of perceived importance is 3.38 and theimplementation level is 2.28. Values greater than 2 indicatethat the quality methodology is used.TABLE IIMPORTANCE AND USE OF QUALITY METHODOLOGIESImportance (mean)Implementation level (mean)non certif. 5051 - 250 250Globalcertif.non certif. 5051 - 20,350,450,48ISBN: 978-988-18210-6-5ISSN: 2078-0958 (Print); ISSN: 2078-0966 (Online) 2503,752,562,562,382,382,562,001,882,510,57WCE 2011
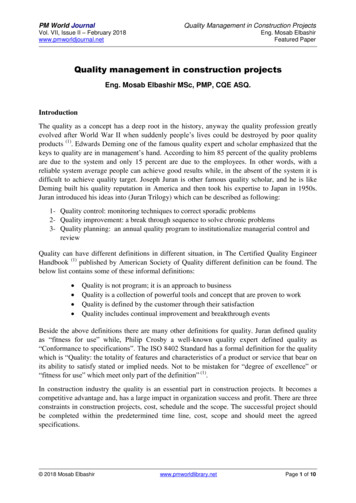
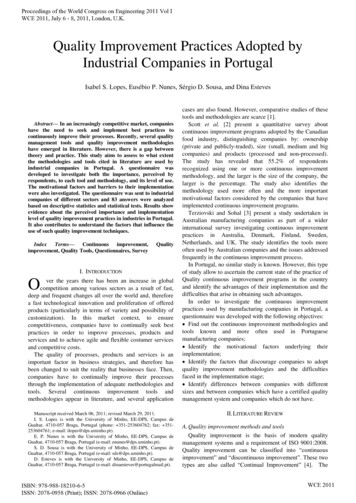
Proceedings of the World Congress on Engineering 2011 Vol IWCE 2011, July 6 - 8, 2011, London, U.K.This suggests that there is no evidence to reject hypothesisH1a, thus industrial companies in Portugal use some qualityimprovement methodology. Hypothesis H2a regarding thedifference between the perceived importance and level ofimplementation was tested based on a t-test which indicatesthat the level of implementation is lower than the perceivedimportance.To test differences between certified and non-certifiedcompanies, the following hypotheses are considered:H4 i m: the level of perceived importance of qualitymethodology is the same for certified and non-certifiedcompanies; and H4 u m: the level of use of qualitymethodology is the same for certified and non-certifiedcompanies. Performed t-tests indicate that the level of use incertified companies is higher.Similar analysis was made regarding company sizeconsidering the following hypotheses: H5 i m sm: the levelof perceived importance of quality methodology is the samefor small and medium-size companies; H5 i m sl: the levelof perceived importance of quality methodology is the samefor small and large-size companies; and H5 i m ml: thelevel of perceived importance of quality methodology is thesame for medium and large-size companies. Similarhypotheses were performed for use (H5 u m sm;H5 u m sl; H5 u m ml). Performed t-tests indicate thatthere is no evidence of differences between companies withdifferent sizes.B. Motivational FactorsThe bibliography identifies a set of motivational factorsthat guide the companies towards the adoption andimplementation of quality improvement practices(methodologies and tools). The selected motivational factorsconsidered in the questionnaire are listed in the first columnof Table II. Table II shows the mean results for the level ofconcordance of respondents for each motivational factor,ordered by decreasing levels of concordance. The shadowsin Table II identify the top five motivational factors. Themean level of concordance is 3.40.Concerning certified and non-certified companies, thefollowing hypothesis was tested: H4 c mf: the level ofconcordance with motivational factors is the same forcertified and non-certified companies.T-test results indicate that H4 c mf is not rejected.Similar analysis was made regarding company sizeconsidering the following hypotheses: H5 c mf sm: thelevel of concordance with motivational factors is the samefor small and medium-size companies; H5 c mf sl: thelevel of concordance with motivational factors is the samefor small and large-size companies; and H5 c mf ml: thelevel of concordance with motivational factors is the samefor medium and large-size companies.T-tests results indicate that only H5 c mf sl is rejected,suggesting that the level of concordance is higher in largecompanies compared to small ones.C. Quality ToolsThe QTs presented to respondents are listed in Table III.Table III also shows the mean for the perceived importanceand implementation level of each quality tool. The list isordered by decreasing level of QTs’ implementation. Themost important QTs are also the ones with higher level ofuse. This reveals coherence in answers. Overall, the level ofperceived importance is 3.36 and the implementation level is2.68. This suggests that there is no evidence to rejecthypothesis H1b, thus it can be supposed that industrialcompanies in Portugal use QTs. Hypothesis H2b regardingthe difference between the perceived importance and level ofimplementation was tested based on a t-test Which indicatesthat the level of implementation is lower than the perceivedimportance.To test differences between certified and non-certifiedcompanies, the following hypotheses are considered:H4 i qt: the level of perceived importance of QTs is thesame for certified and non-certified companies; andH4 u qt: the level of use of QTs is the same for certifiedand non-certified companies. T-tests were performed, to testdifference between means. Test results indicate that H4 i qtis not rejected; H4 u qt is rejected, indicating that the levelof use of QTs is higher in certified companies.TABLE IIMOTIVATIONAL FACTORS FOR THE IMPLEMENTATION OF QUALITY IMPROVEMENT PRACTICESConcordance (mean)Motivational factorsQuality improvement of product/serviceImprove company’s imageTop management initiativeIncrease customer focusReduction of non-conformitiesCustomer requirementInvolvement of people“door” to new marketsCost reductionsAccomplish delivery datesLead time reductionIncreasing production volumeFinancial fundingMeanStandard deviationISBN: 978-988-18210-6-5ISSN: 2078-0958 (Print); ISSN: 2078-0966 (Online)globalcertif.non certif. 5051-250 72,883,580,26WCE 2011
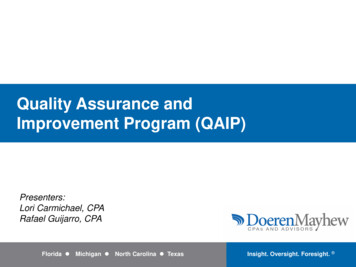
Proceedings of the World Congress on Engineering 2011 Vol IWCE 2011, July 6 - 8, 2011, London, U.K.TABLE IIIPERCEIVED IMPORTANCE AND IMPLEMENTATION LEVEL OF QUALITY TOOLSPerceived Importance (mean)Quality ToolsFlowchartCheck sheetDashboardBrainstormingStatistical Process Control (SPC)HistogramPareto AnalysisWho, What, Where, When, HowQuestionnaireBenchmarkingIshikawa DiagramCause-and-effect matrixControl chart5 WhysFailure modes and effects analysis (FMEA)Nominal group techniqueDesign of Experiments (DOE)Quality function Deployment (QFQ)Mistake-ProofingScatter DiagramFactor AnalysisTree DiagramArrow DiagramProcess decision program chart (PDPC)Relations DiagramMatrix DiagramAffinity DiagramMeanStandard deviationnonglobal 0,29 083,092,913,400,28Similar analysis was made regarding company sizeconsidering the following hypotheses: H5 i qt sm: the levelof perceived importance of QTs is the same for small andmedium-size companies, H5 i qt sl: the level of perceivedimportance of QTs is the same for small and large-sizecompanies, and H5 i qt ml: the level of perceivedimportance of QTs is the same for medium and large-sizecompanies. Similar hypotheses were performed for use(H5 u qt sm; H5 u qt sl; H5 u qt ml).T-tests results indicate that H5 i qt sl and H5 u qt slare rejected, suggesting that the importance and level of useis higher in large companies compared to small ones. Basedon t-tests H5 i qt ml and H5 u qt ml are rejected,indicating that the importance and level of use is higher inlarge companies compared to medium-sized companies.D. Continuous improvement programsTables IV and V present the barriers to the adoption andimplementation of quality improvement programs,respectively, and the results obtained in this study.1) Barriers to adoptionTable IV shows the mean results for the level ofconcordance of each barrier to the adoption of continuousimprovement programs (first column). Overall, the level ofconcordance with barriers to adoption is 2.32. Valuesgreater than 2 indicate a concordance with presentedbarriers. So, there is no evidence to reject hypothesis H3a.ISBN: 978-988-18210-6-5ISSN: 2078-0958 (Print); ISSN: 2078-0966 on level (mean) 1,912,081,821,551,441,561,671,502,200,49 2,342,212,082,002,002,001,921,752,630,52 ,272,081,732,970,56Concerning certified and non-certified companies, thefollowing hypothesis was tested: H4 c ba: the level ofconcordance with barriers to adoption continuousimprovement programs is the same for certified and noncertified companies. A t-test was performed and resultindicates that H4 c ba is not rejected.Similar analysis was made regarding company sizecomparing mean values with the following pairs: small andmedium-size companies, small and large-size companies,and medium-size and large companies. T-tests wereperformed and the result indicates that there are nosignificant differences between the average values.2) Barriers to implementationTable V presents results identical to those presented inTable IV, obtained in this case for the barriers to theimplementation of Quality improvement programs. From theanalyses of these results (similar to those conducted withTable IV), we emphasize a significant difference of meanresults between medium and large companies, verifying thehighest mean value in medium-sized companies.V. CONCLUSIONThis study reveals that Portuguese companies recognizethe usefulness of QTs and methodologies. However, itsperceived importance is higher than its level of use. Theperceived importance and the level of use of QTs andmethodologies are higher in large-sized companiesWCE 2011
Proceedings of the World Congress on Engineering 2011 Vol IWCE 2011, July 6 - 8, 2011, London, U.K.TABLE IVBARRIERS TO THE ADOPTION OF QUALITY IMPROVEMENT TOOLSConcordance (mean)BarriersEmployees resistance to changeHigh cost of the implementationLow level of employee involvementLow level of employee knowledgeLack of top management commitmentLack of Human Resources with specific knowledge on QualityLow level of knowledge on Quality of top managementNot recognizing the advantages of implementing quality improvementprogramsMeanStandard deviationglobalcertif.non certif. 5051-250 ,332,270,332,530,332,290,282,420,352,180,43TABLE VBARRIERS TO THE IMPLEMENTATION OF QUALITY IMPROVEMENT TOOLSConcordance (mean)BarriersEmployees resistance to changeImplementation only in some company departmentsLow level of employee involvementLack of communication between employeesDifficulty on monitoring processesLow level of employee trainingLow level of employee knowledgeLack of top management commitmentLow level of knowledge on Quality of top managementMeanStandard deviationcompared to small and medium-sized companies. The levelof use of QTs and methodologies is higher in certifiedcompanies. The study highlights the main motivationalfactors that lead to the implementation of qualityimprovement practices (methodologies and tools) and themain barriers for its adoption and faced during theimplementation.The PDCA cycle is generally the methodology consideredthe most important by companies and is also the mostlyused. Its spread may be associated with the fact thatstandards such as OSHA 18000, ISO 14000 and ISO 9000are based in PDCA cycle. This methodology is also simpleto understand and explain, since it indicates a logicalsequence. It can also be supposed that 5S is also a popularmethodology for the same reason. Methodologies thatrequire more investment in resources such as Six Sigma andEFQM are less implemented.The performed survey allowed to draw some generalconclusions, however some further analysis are required tounderstand the advantages and disadvantages (or limitations)considered by companies for the methodologies and tools.From this study, an interesting question arises: whycompanies prefer one tool or methodology instead another?Comparative study about quality tools and methodologiesare scarce in literature.globalcertif.non certif. 5051-250 [13][14]REFERENCES[1][2]Kumar, M., Antony, J., (2008), Comparing the Quality ManagementPractices in UK SMEs, Industrial Management and Data System,108(9): 1153-1166Scott, B., Wilcock
A. Quality improvement methods and tools Quality improvement is the basis of modern quality management systems and a requirement of ISO 9001:2008. Quality improvement can be classified into “continuous improvement” and “discontinuous improvement”. These two types are also