Transcription
SIP TemplatePlanning Year 2017-2018Implementation September 2018-June 2021Gildo Rey ElementarySchool Improvement PlanSchool Improvement Plan Adopted by the Auburn School Board of Directors oninsert school board approval date here.September 2017-June 2022Auburn School District Strategic Plan111/1/2017
SIP TemplateAspiration:As an active citizen in a global society, each student will thrive as a champion for self, family, community andhumanity.District Goal 1: Engage: Connect students to their schools and learning.1. Build student, family and community relationships and partnerships.2. Create safe and supportive learning environments that result in high levels of daily attendance andengagement.3. Involve students in establishing ownership for their own learning.4. Enrich and support the whole child through a range of curricular and extracurricular opportunities.District Goal 2: Educate: Ensure relevant learning, high achievement and graduation for each student.1. Hold ourselves accountable for each student’s learning and graduation.2. Ensure all students experience relevant and rigorous instruction.3. Ensure equitable access to learning opportunities.District Goal 3: Empower: Enable students and staff to thrive now and in the future.1. Ensure each student has a personally relevant PK-12 educational program.2. Ensure students achieve competency in communication, critical thinking, collaboration, creativity,character and civics in addition to core academic skills.3. Elevate professional practice by investing in staff and leaders.SchoolGildo Rey ElementaryDate of SIP Team District Goal Review:SIP Team Members:Phyllis CarltonELL Certificated StaffAnnMarie PagoriaTitle I SpecialistLenny HollomanPrincipalKarine RasmussenInstructional SpecialistLisa HornDistrict RepresentativeNelda TrujilloParent RepresentativeDianna Linville2-3 Grade Level Rep.Shawn WelshSpecialist RepresentativeAshley LorenzanoK-1 Grade Level Rep.Gelinda WilliamsAsst. PrincipalMaki MatsunoSpecial EducationKristina Olson4-5 Grade Level Rep.2
SIP TemplateSchool Improvement Team Signatures 2017-2018Date Submitted:Date of School BoardApproval:NameTitle/PositionLenny HollomanPrincipalGelinda WilliamsAsst. PrincipalNelda TrujilloParentSerenity FaasaoStudentFelipe MendozaStudentLisa HornDistrict RepresentativePhyllis CarltonStaffDianna LinvilleStaffAshley LorenzanoStaffMaki MatsunoStaffKristina OlsonStaffAnnMarie PagoriaStaffKarine RasmussenStaffShawn WelshStaffSignatureEach team must include staff, students, families, parents, and community members.Signatures for Approval311/1/2017
SIP TemplateDepartment of Student LearningHeidi HarrisAssistant Superintendent StudentLearningJulie DeBoltExecutive Director High School/PostSecondary ProgramsVicki BatesAssistant SuperintendentTechnologyDepartment of School ProgramsRyan FosterAssociate Superintendent PrincipalLeadership and School ProgramsRhonda LarsonAssistant Superintendent FamilyEngagement and Student ServicesSuperintendentAlan SpicciatiSuperintendentSchool BoardAnne BaunachSchool BoardLaurie BishopSchool BoardRobyn MulengaSchool BoardRyan Van QuillSchool BoardRay VefikSchool BoardAuburn School District MissionIn a culture of equity and excellence we engage, educate and empower each student for success beyondgraduation.Auburn School District VisionAs an active citizen in a global society, each student will thrive as a champion for self, family, community andhumanity.4
SIP TemplateSchool MissionThe mission of the Gildo Rey community is to provide academic and social opportunities in a safe and positiveenvironment dedicated to the belief that all students will reach their greatest potential.School VisionAt Gildo Rey we value the uniqueness of each child. We work together with the strong belief that “all of ourkids are all of our kids”. We hold the expectation that each child can achieve to high levels with appropriatesupport and instruction.Background InformationWAC 180-16-220Requirements for School Improvement PlanEach school shall be approved annually by the school board of directors under an approval process determined by the districtboard of directors and “At a minimum the annual approval shall require each school to have a school improvement plan that isdata driven, promotes a positive impact on student learning, and includes a continuous improvement process that shall mean theongoing process used by a school to monitor, adjust, and update its school improvement plan.” School Improvement plans mustinclude a brief summary of use of data to establish improvement; acknowledging the use of data which may include DIBELS,MAP, ELPA21, Credit Attainment, Enrollment in Honors/AP Courses, CEE Perceptual Data, SAT/ACT, Discipline, and MSP orHSPE.Stakeholder InputThe SIP Team was comprised of members representing all grade levels, certificated learning teams and otherstakeholders in our Gildo Rey Elementary Learning Community. We began this process on October 3, 2017 andmet officially 16 times; whole staff, SIP Team, or in break out SIP team groups through June 2018. Wereviewed our comprehensive school-wide data including achievement, demographics, and attendance data withall staff and discussed our noticings, wonderings, perceived celebrations, and perceived challenges. Ourbuilding leadership team used this information to build a culture of collective responsibility for the achievementof all of our students. This will require our staff to focus on the articulation of the skills and concepts needed forstudents to be successful, ECE through grade 5. Through research, discussion, and collaboration the SIP teamdrafted three SMART Goals to guide our focus for the next three years and presented them to staff along withproposed action plans. Staff used the Gildo Rey Decision-making model to vote on and reach consensus on thegoals and action plans. The SIP team continues to meet and plan evidence of implementation, evidence ofimpact, leadership responsibilities and staff trainings to support our SIP goals and action plans.Highly Qualified Staff – SWT 2 & 3/LAPAll of the staff at Gildo Rey Elementary meet the highly qualified requirements set out in the NCLB mandates.High Quality, Highly Qualified Teachers – SWT 2 & 3/LAPSupport for teacher growth and retention includes: district new teacher mentor program, monthly meetings withthe principal, Instructional Specialist coaching and model teaching, instructional framework collaboration withbuilding administration throughout the year, and a highly collaborative professional learning community.511/1/2017
SIP TemplateCOMPREHENSIVE NEEDS ASSESSMENT – SWT 1/LAPExecutive SummaryDemographic DataThe staff reviewed demographic data for the years 2012-2017. The data was disaggregated by low income,SPED, ELL, and race and ethnicity. The trends most notable in the data are as follows:Enrollment:Gildo Rey’s Pre K- 5 enrollment has increased steadily over the last five years from 531 in 2012-2013 to 627 in2016-2017.* Enrollment based on October 1 count.YearEnrollmentChange2012-13531 682013-14562 362014-15600 332015-16604-92016-17627 23Mobility:Mobility rates have increased over the last three years, bringing mobility back to comparable numbers in 201213. During the 2014-2015 school year, 77 new students enrolled. In 2015-2016, 80 new students enrolled andin 2016-2017, 139 new students enrolled.6YearMobility Rate2012-1334%2013-1430%2014-1525%2015-1624%
SIP Template2016-1731%Free and Reduced Lunch:The number of students who applied and qualified for free and reduced lunch is higher than the state and districtaverages. From 2012-2013 to 2016-2017 the percent of students identified as Free/Reduced decreased 88.3% to74.3%YearWA StatePercentageASDPercentageGildo ReyPercentageGildo ReyChange2010-1143.752.180.4 22011-1245.553.682.7 1.62012-1346.155.588.3 c Data:Over the last 5 years (October 2012 to October 2016) trends in the ethnicity data show that the percent ofstudents identified as two or more races increased from 6.6 % to 8.6%. The percent of students identified asHispanic increased from 50.8% to 56.6%. The percent of students identified as White decreased from 25% to20.4%. The the percent of students identified as African American decreased from 5.0% to 3.4%. Over the lastfour years there has been very little change in the ethnic makeup of the student population. Hispanic studentsstill comprise the majority of students enrolled followed by white students and then students of two or 0.3%
SIP c .2%12620.4%2 or moreraces346.6%488.6%528.7%559.3%538.6%Special Education:From 2012-2013 to 2016-2017 the percent of students identified as SPED increased from 10.4% to 10.7%.Over the last four years, Special Education enrollment has increased from 9.8% in 2013-14 to 10.7% in 014-15569.6%2015-166410.7%2016-176610.7%*Numbers based on May 1 count.English Language Learners:From 2012-2013 to 2016-2017 the percent of students identified as ELL increased from 38.6% to 40.5%. Overthe last 5 years the number of ELL students has increased from 205 (38.65) in 2013-14 to 251 (40.5%) in 201617, although the percentage has remained relatively stable.Year#/%Students2012-1320538.6*Numbers based on May 1 7%2016-1725140.5%
SIP TemplateDisciplineDiscipline data has not been tracked or collected on a regular basis. Baseline data was collected during the2016-2017 school year and will continue to be tracked.AttendanceThe staff reviewed attendance data for the school years 2014/2015 - 2016/2017. The trends most notable in thedata are: The average attendance rate was consistently lower among the Native Hawaiian ethnic group than allother racial and ethnic groups from 2014-2015 to 2016-2017. Overall the average yearly attendance rate has been less than 95%. In 2014-2015 the average dailyattendance rate was 93.07%. In 2015-2016 the average daily attendance rate was 93.36%. In 2016-2017the average daily attendance rate was 92.96%. The Hispanic ethnic group has the highest average yearly attendance rate at 94% each year.9YearAttendance 6%2016-1792.96%11/1/2017
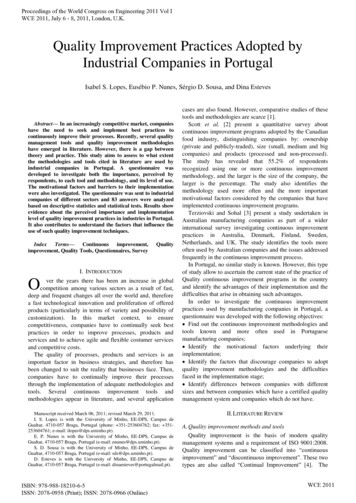
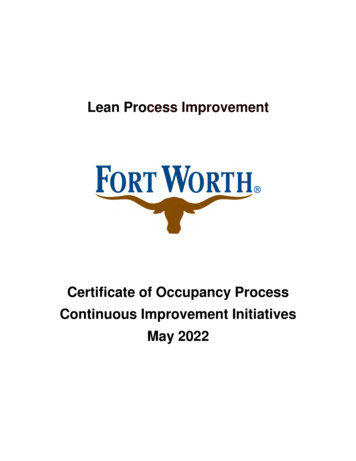
SIP TemplateData Analysis- DIBELSThe staff reviewed DIBELS data for the years 2010-2016, disaggregated by ELL, gender, grade level, and raceand ethnicity. The most notable trend is that between 2010 and 2016 benchmark scores decreased at all gradelevels. Between 2013 and 2016 the number of students in the intensive category has increased at each gradelevel.10
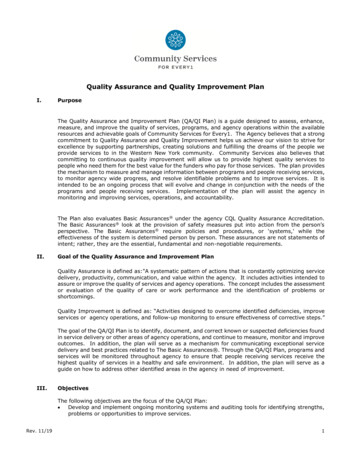
SIP TemplateELL DIBELS Data:1111/1/2017
SIP TemplateData Analysis- ELPA21 (ELL Data)The staff reviewed ELL program enrollment and transition data for the years 2013-2017. The trends mostnotable in the data are:The percentage of ELL students has remained steady from 2013-2017 ranging from 42% to 44%. Schoolwidein 2016-17, 23.8% of ELL students transitioned out of ELL, which is an increase over previous years. (12% in2013-14; 14% in 2014-15; 15% in 2015-16).Data Analysis- CEE Perceptual SurveyThe SIP team reviewed CEE Perceptual survey data including staff, parent and student results. The sample sizefor the multiple year comparison was inconsistent which made the comparison less reliable. The N sizesinclude:N 4584Educational Effectiveness Survey, Student Edition12
SIP TemplateWhile there is no single solution for all schools, research on effective schools identified common characteristicsof high-performing schools known as the 9 Characteristics. Successful schools engaged in improvementactivities focus on these characteristics of “organizational and educator capacity” to create and improve thesystem(s) that ultimately drive performance outcomes. Understanding the perceptions of your studentpopulation is essential to inform changes for improvement. The Characteristics, “Curriculum, Instruction, andAssessment” and “Focused Professional Development”, are professional activities conducted amongst the adultschool community and are rarely viewed by students. Thus questions regarding those Characteristics are not apart of the survey.The trends most notable in the student data are: Students feel our school has high standards and expectations. Students have a positive perception of a supportive learning environment. Parent and community involvement is our lowest performing area.Educational Effectiveness Survey, Parent EditionWhile there is no single solution for all schools, research on effective schools identified common characteristicsof high-performing schools known as the 9 Characteristics. Successful schools that are engaged in improvementactivities focus on these characteristics of “organizational and educator capacity” to create and improve thesystem(s) that ultimately drive performance outcomes. The Characteristic, “Focused ProfessionalDevelopment”, is a professional activity conducted amongst the adult school community and is rarely viewedby parents. Thus questions regarding this Characteristic are not a part of the survey.The trends most notable in the parent data are:1311/1/2017
SIP Template Parents’ perceptions across all eight characteristics surveyed are high (all above 80%). Parents feel our school has high standards and expectations.14
SIP TemplateEES Staff Survey Research FrameworkThe Center for Educational Effectiveness brings together leading research to create the EducationalEffectiveness Survey (EES)—a formative and diagnostic tool designed to stimulate and inform conversationsfor improvement within your organization. The research framework includes: Effective organizations Organizational trust Culturally responsive teaching District support for improvement Attributes of effective instructional practice1511/1/2017
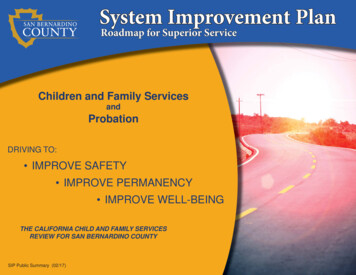
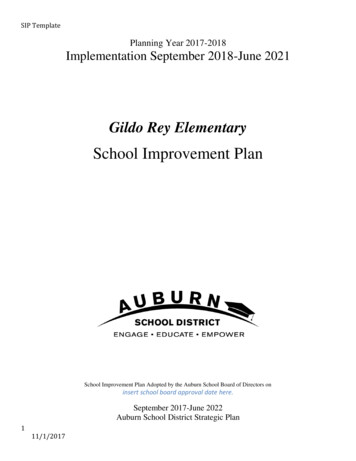
SIP TemplateThe trends most notable in the staff data are: There is significant variance in the N size over the three years surveyed. From 2012 to 2016 there is a downward trend in all 11 areas surveyed.SBA ELA (MSP)Between 2013 to 2017 there was a downward trend with the percent of all students proficient on theMSP/Smarter Balanced Assessment in ELA. From 2013 to 2017 the percent of all students proficient in 3rdgrade decreased from 84% to 64%. In 4th grade the percent of all students proficient decreased from 88% to67%. In 5th grade the percent of all students proficient decreased from 83% to 62%.16
SIP TemplateBetween 2013 to 2017 there was a downward trend with the percent of proficient ELL students on theMSP/SBA in ELA. From 2013 to 2017 the percent of ELL students proficient in 3rd grade decreased from86% to 38%. In 4th grade the percent of ELL students proficient decreased from 76% to 46%. In 5th grade thepercent of ELL students proficient decreased from 56% to 23%.1711/1/2017
SIP Template18
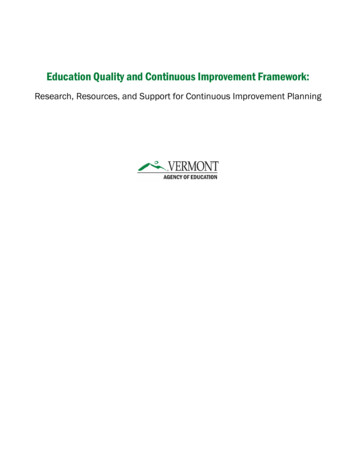
SIP TemplateSBA Math (MSP/EOC)Between 2013 to 2017 there was a downward trend with the percent of all students proficient on theMSP/Smarter Balanced Assessment in Math. From 2013 to 2017 the percent of all students proficient in 3rdgrade decreased from 90% to 73%. In 4th grade the percent of all students proficient decreased from 93% to82%. In 5th grade the percent of all students proficient decreased from 88% to 71%.1911/1/2017
SIP TemplateBetween 2013 to 2017 there was a downward trend with the percent of proficient ELL students on theMSP/SBA in Math. From 2013 to 2017 the percent of ELL students proficient in 3rd grade decreased from82% to 51%. In 4th grade the percent of ELL students proficient decreased from 90% to 70%. In 5th grade thepercent of ELL students proficient decreased from 74% to 49%.20
SIP Template2111/1/2017
SIP TemplateMSP Science/EOC BiologyThe staff reviewed SBA science data for the years 2014-2015, 2015-2016, and 2016-2017. The trends mostnotable in the data are: The percentage of students meeting standard has decreased from 67.7% in 2014-2015 to 52.6% in 20162017. The percent of students scoring at a level 1 has increased from 11% in 2014-2015 to 27% in 2016-2017. The percent of students scoring at a level 3 has decreased from 41% in 2014-2015 to 33% in 2016-2017. All ethnic groups have decreased in percentage passing from 2014-2015 to 2016-2 017 with theexception of white.22
SIP Template2311/1/2017
SIP TemplateParent Engagement – SWT 2/LAPAdministrators and teachers explicitly communicate with families regarding achievement, attendance, back-toschool nights, and volunteering at school. Additional activities also include:Activities during Fall: Building-wide Open House Recruiting parents volunteers Partnering for Student Academic Success Night (Curriculum Night) PTA Bingo Night Parent/Teacher Conferences Book Fair Report Cards Parent CEE Survey (paper/pencil or online)24
SIP TemplateActivities during Winter: Holiday Giving Event Food Drive Report cards Recruiting parents volunteers PTA Meetings Family Dance NightActivities during Spring: Kindergarten Orientation Kindergarten Family Night Family BBQ Run-a-thon/Hawk run (fundraiser for PTA) Kids’ Day (through Family Engagement Liaison w/summer giveaway materials) Multicultural Night (through Family Engagement Liaison) Volunteer Recognition Report Cards Math Fact Flash Cards and summer materials/resources sent home 5th grade & Kindergarten GraduationActivities all year long: Phone, email contacts Award Assemblies (for Citizenship, Achievement, Attendance, etc.) Parent library Conferences as requested/needed Student materials PTA general and/or board meetings School newsletters Flyers, website posts and Facebook posts and reminders to inform of upcoming activities/events After school clubs Academic Technology Access (MobyMax, CODE.org, Typing Agent, Library website links) Library reading programs (Bookit, Mr. Welsh’s Top Picks, PTA monthly reading logs) Skyward Parent AccessActivities outside of school: McTeacher Night Soccer for Success King County Library Summer Reading Program PTA events including Skate NightsStudent Transitions – SWT 2 & 3/LAP2511/1/2017
SIP Template ECE to elementary: The ECE teacher initially meets with school administration, specialists, support staffand kindergarten teachers to communicate the most appropriate placement for each child as well asneeded support for students transitioning from ECE to kindergarten. All identified services aremaintained across that transition as noted in individual IEPs. At a second meeting, parents are invited tojoin their child’s educational team in the planning process. In addition, ECE kids have the opportunity tojoin kindergarten classrooms for some days in the spring to build familiarity with Kindergarten teachersand procedures. Selected incoming kindergarteners are also invited to summer school, where readinessskills are taught over a period of three weeks. In the fall of students’ kindergarten year, families areinvited in for individual meetings with their child’s kindergarten teacher. During this meeting familieshave the opportunity ask questions, teachers begin initial student assessments, and students have theopportunity to see their classroom and meet their teacher in the safety of their parents presence. Thisinitial meeting serves as the foundation for ongoing home-school communication and an ongoing schoolfamily partnership. Elementary to middle school: Information relevant to parents of 5th grade students who transition tomiddle school is included in a designated section in the school newsletter. Every year, Gildo Rey 5thgraders visit Mt. Baker Middle School in an effort to make transition to middle school easier. They get afirst impression of the building and meet the middle school teachers, administrators and the principal.Transitioning students and their parents are invited to an information night with a Q and A opportunitywith the Gildo Rey principal.Assessment Decisions – SWT 3/LAPAssessments are administered and analyzed regularly at Gildo Rey. Ongoing formative assessments aredeveloped and analyzed within grade level teams and in cross grade level Professional Learning Communities.Instructional decisions are made based on student success in meeting specific learning targets and CommonCore State Standards (CCSS). These assessments, both from curriculum materials and teacher-created materials,are used to guide instruction and determine student placement within intervention, benchmark, and/orenrichment groups.Summative assessments, including end of unit tests, DIBELS, ELPA21 and SBA are all analyzed at thebuilding-wide level. Results are used to provide feedback on success of instructional strategies and curricularmaterials.DIBELS data is analyzed formally at least every 6 to 8 weeks by the instructional staff. For the majority ofstudents, ongoing progress monitoring using DIBELS also occurs on a monthly basis. Our mid-year dataprovides information regarding students continuing to grow and red flags on students not growing or studentsthat are in need of further intervention. Careful analysis at the student level leads to instructional changes.Effective, Timely Assistance – SWT 2 &3/LAPStudent data is collected throughout the year, with benchmark assessments in reading and math occuring Fall,Winter, and Spring and progress monitoring occurring weekly to monthly. At Gildo Rey, we use a braided26
SIP Templateservices model, aligning our ELL, SPED, and Title resources with the classroom teacher teams and working asa cohesive team to look at student need and provide services accordingly. Every 6 to 8 weeks, the instructionalteam for each grade level (Title, SPED, ELL, classroom teachers, TOSA, Instructional Specialist,Administrators) meet to review the data on a student by student basis. Students are rank ordered by the mostrecent data collected (DIBELS, SBA interims, EasyCBM, math module/domain assessments, etc). This rankorder is then used to facilitate the discussion of placement into Differentiated Instruction (DI) groups for bothreading and math. The grade level rank orders also identify students that are ELL and/or require SPED services.These considerations are taken into account as students are placed in DI groups (either Title, ELL, or SPED).Every student in our building participates in a DI Reading group (5 days per week) and a DIMath group (4-5days per week depending on grade level). Students who are below benchmark are placed in groups with fewerstudents and highly skilled teachers, using materials and programs that are designed for Tier 2 and 3 learners.Additionally, the most struggling learners are also identified through the rank order to receive triple dip readinginstruction (30 minutes, 4 days per week). Additionally, extended day reading and/or math programs are alsoavailable to provide further instruction for targeted groups of students based on benchmark and progressmonitoring data.Prioritized ChallengesThe school SIP team completed a comprehensive data review. Historical data from as far back as 2010 wasreviewed to identify trends in student achievement. The SIP team shared data with all staff at the data carousel.Staff reviewed data for DIBELS, SBA ELA, SBA Math, and attendance for all students as well as datapertaining to the subgroups of ELL and SPED. Within small groups, teams analyzed each category of data toidentify and prioritize the challenges noted in the data. After the data carousel, the SIP team used the stafffeedback to draft SMART Goals and the building decision making model was implemented in approving theSMART goals and action steps.MathMath MSP/SBA showed a downward trend overall from 2013 to 2017 from 90.3% average in 2013 to 75.3%average in 2017. Our SBA average pass rates were 15 percent below MSP pass rates.Our special education population had a more significant deficit in student SBA passing rates as compared to thepass rates of all students and all other subgroups.The SBA claim data showed our students were stronger in concepts & procedures (claim 1) than problemsolving (claim 2 and 4) and communicating & reasoning (claim 3). The claim data discrepancy trend was moreextreme with our ELL subpopulation.ELA2711/1/2017
SIP TemplateBoth MSP/SBA data showed a downward trend overall from 2013 to 2017 from 85% average in 2013 to 64.3%average in 2017.Our special education population had a more significant deficit in student SBA passing rates as compared to thepass rates of all students and all other subgroups.SBA claim data showed we have fewer students above benchmark in writing (claim 2) than the other claims(Reading, Listening & Speaking, and Research).DIBELs showed a similar trend, from 85.6% average in 2013 to 65% average in 2017.EquityAn achievement gap exists in subgroups across ELA, Math, and Science. Subgroups that exhibit the greatestdiscrepancy are ELL, Pacific Islander, Special Education, and students that qualify for free and reduced lunch.The overall average yearly attendance rate has been less than 95% and was consistently lower among the NativeHawaiian ethnic group than all other racial and ethnic groups.Mobility rates have increased over the last three years, bringing mobility back to comparable numbers in 201213.SMART Goal 1:By June of 2021, 92% of the students at Gildo Rey will reach proficiency on the state ELAassessment.SMART Goal 2:28
SIP TemplateBy June of 2021, 94% of the students at Gildo Rey will reach proficiency on the state Mathassessment.SMART Goal 3:By June of 2021, current ELL students at Gildo Rey will perform at the same proficiency levelas all students as measured by the DIBELS assessment.2911/1/2017
SIP TemplateSMART Goal 1Subject Area: ELATarget Population: (basedon demographic, disciplineand attendance data analysis)Our Reality: (based onassessment data analysis)Our SMART Goal: (basedon target population and yourreality)All of Gildo Rey’s Pre K- 5 students are the target population. Enrollmenthas increased steadily over the last five years. The mobility rates have increasedover the last three years, and the number of students who applied and qualifiedfor free and reduced lunch is higher than the state and district averages. Thepercent of students identified as free/reduced remains high at approximately 75%.The ethnic data trends show an increase in two or more races, and an increase inour hispanic students, while our percent of Special Education students remainsrelatively stable. Over the last six years the percent of student being served asELL has increased to approximately 41%. The average daily attendance remainsat approximately 94%.Over the last five years there was a downward trend with the percent of allstudents proficient on the MSP/Smarter Balanced Assessment in ELA.By June of 2021, 92% of the students at Gildo Rey will reach proficiency onthe state ELA assessment.Action Step SWT 2 & 3/LAPAction PlanWe will teach the CCSS using a balanced literacyapproach, implementing district adopted and buildingcreated materials.Evidence of ImplementationAugust:Wonders training--overview, AnitaArcher, LID (District level)August:“State of the Union” data overview andSIP review (whole staff)Introduce Focus 5- how it relates to coreand DI instruction. Preferential Seating Teach to Mastery Frequent student interaction Use formative and summativedata to make instructionaldecisions.30Evidence of ImpactAdministrators will seeteachers using Wondersmaterials and Anita Archer’sinstructional strategies in theclassroom throughwalkthroughs, observations,and PLC conversations.Administrators and teacherswill engage in ongoingconversation around data andwill be able to identify focus5 students in the building.Administrators will seeteachers implementingstrategies to support focus 5students.LeadershipResponsibilityASD DSL willprovideprofessionaldevelopmentrelated to Wondersmaterials.BuildingAdministratorswill participate in/facilitate datameetings andconversations andmonitorimplementation ofFocus 5 throughwalk throughs andobservations.PDLID Day; August28thRetreat, August27th6 Building Hours(shared with SmartGoal 3 Gildo ReyWay)
SIP TemplateAugustWhat is balanced literacy? Writing Intro CCSS grade levelstandards and verticalalignment Common graphicorganizers and language Wonders and Step Up ToWriting K-1 Writing Continuum Foundational Skills Close Reading Comprehension Role of DI Unit planning/standardsalignmentSeptemberInformational WritingK-2 Analysis of student writing and/orwriting rubrics3-5 Analysis of student writingAuthor’s CraftAdministrators will seeevidence of implementationof balanced literacy in allcore classrooms.Evidence includes: teacherlesson plans, classroomobservations andwalkthroughsTeachers will implementbalanced literacy in all coreclassrooms.Administrators will see theagreed upon informationalwriting strategies,instructional routines, graphicorganizers, in lesson plans,walkthroughs, classroomobservations, and PLCconversations.Teachers will implement theagreed upon informationalwriting strategies,instructional routines, graphicorganizers, assessments, etc.BuildingAdministratorswill communicatebuilding tights forbalanced literacyinstruction.6 Bldg hours,August 30thELA CurriculumAdoptionCommitteeMembers willfacilitate PD.IS/Title Specialistwill find writingsamples andwriting guidingquestions tosupport PLC leadsStaff MeetingBuildingAdministratorswill provide staffwith writingsamples andguiding questionsa week prior tostaff meetingPLC leads willfacilitate PD andtable talk.IS/Title Specialistwill supportim
District Goal 1: Engage: Connect students to their schools and learning. . data driven, promotes a positive impact on student learning, and includes a continuous improvement process that shall mean the ongoing process used by a school to monitor, adjust, and update its school improvement plan." School Improvement plans must include a brief .