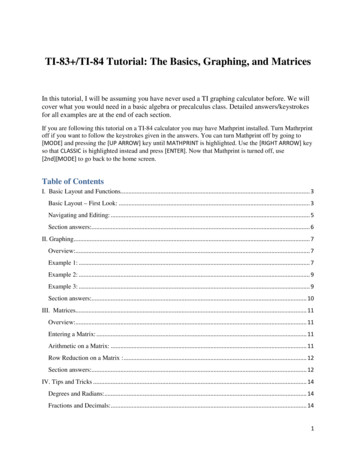
Transcription
TI-83 /TI-84 Tutorial: The Basics, Graphing, and MatricesIn this tutorial, I will be assuming you have never used a TI graphing calculator before. We willcover what you would need in a basic algebra or precalculus class. Detailed answers/keystrokesfor all examples are at the end of each section.If you are following this tutorial on a TI-84 calculator you may have Mathprint installed. Turn Mathrprintoff if you want to follow the keystrokes given in the answers. You can turn Mathprint off by going to[MODE] and pressing the [UP ARROW] key until MATHPRINT is highlighted. Use the [RIGHT ARROW] keyso that CLASSIC is highlighted instead and press [ENTER]. Now that Mathprint is turned off, use[2nd][MODE] to go back to the home screen.Table of ContentsI. Basic Layout and Functions. 3Basic Layout – First Look: . 3Navigating and Editing: . 5Section answers:. 6II. Graphing . 7Overview:. 7Example 1: . 7Example 2: . 9Example 3: . 9Section answers:. 10III. Matrices. 11Overview:. 11Entering a Matrix: . 11Arithmetic on a Matrix: . 11Row Reduction on a Matrix : . 12Section answers:. 12IV. Tips and Tricks . 14Degrees and Radians: . 14Fractions and Decimals: . 141
Recalling Previous Answers: . 14Section answers:. 15V. Troubleshooting . 16Changing Brightness: . 16Hanging Calculation/Not Responsive: . 16Resetting Memory:. 16Error Screens:. 16VI. - Conclusion . 182
I. Basic Layout and FunctionsBasic Layout – First Look:Before you even turn on your calculator, look at how it is organized.The TI-83 can be divided roughly into three sections: Graphing is along the top row, advancedfunctions and menus is the top middle, and the scientific calculator takes up the bottom half.Above every key you’ll see a secondary function in yellow lettering (blue on a TI-84) or greenlettering. To access them, press the [2nd] or [ALPHA] keys first. This is the equivalent of shift on akeyboard.3
In the bottom half you have basic operations and constants. I’ve marked a few common ones.It is important to note that there is a difference between “negative” and “minus”. Negative hasone operand and minus has two operands. For instance, “2 minus 1” versus “negative 2 minus 1”.Turn the calculator on in the lower left-hand corner. (Turn it off again with the [2nd] key.) Thescreen you see when you first turn on the calculator is called the home screen. The home screenis where most calculations are carried out. Simply type out the operations you want and hit[ENTER]. You can always reach the home screen again from any menu with the [QUIT] function([2nd][MODE]). And you can always clear the home screen by hitting [CLEAR] twice.4
Try calculating the following examples on the home screen:1) 3-3 02) -9 6(8-5) 93) 1 (1 .05)14 2.9799315994) log5(48) 2.4053124275) 6.022E23/1.6E-14 3.76375E37(Basic Arithmetic)(Basic Arithmetic)6)(Basic Arithmetic)4 (1 0.5)7 3 .25(Exponents)(Logs)(Scientific Notation)Navigating and Editing:To move the cursor around the home screen and any menus, use the arrow keys. Also, as statedbefore, use [2nd][MODE] to quit back to the home screen whenever you wish.One advantage of a graphing calculator is that you can correct mistakes. Use [CLEAR] to delete aline entirely. [DEL] deletes the character your cursor is on. [INS] changes the cursor to begininserting what you type rather than overwriting.When you’ve made a mistake on a long calculation, try editing it rather than retyping it entirely.It will save time and help to familiarize yourself with the controls.5
Section answers:1) [3][-][3][ENTER]2) [(-)][9][ ][6][(][8][-][5][)][ENTER]3) [1][ ][(][1][ ][.][0][5][)][ ][1][4][ENTER]4) [LOG][4][8][)][/][LOG][5][)][ENTER]5) (-)][1][4][ENTER]or[(][6][.][0][2][2][*][1][0][ ][2][3][)][/][(][1][.][6][*][1][0][ ][(-)][1][4][ENTER]6) [(][4][-][(][1][ ][.][5][)][)][/][(][7][ ][3][)][ENTER]6
II. GraphingOverview:Everything related to graphing is in the top row of keys. Very quickly, here is a summary of whatthey do. You won’t be using all these menus equally, and I’ve bolded the most important ones. Itwill be easier to see how they interact through the examples. Y : Enter the equations to graph.Stat Plot: Set options for plots.Window: Manually set the window boundaries.Tblset: Options for the Table.Zoom: Preset window boundary options.Format: Options for the appearance of the graphing window.Trace: Brings up a cursor so you can “trace” a line using the arrow keys.Calc: Menu with a list of available graphing commands.Graph: The graphing window itself. Table: Table of x and y coordinates for each line.It is important to know how to change the boundaries of the graphing window, so that you canview lines that are out of range. [WINDOW] lets you manually set the boundaries, and [ZOOM] hasa variety of preset boundaries. (We will do an example in Example 1.)The most useful ZOOM commands are: Zoom In: Zooms into the blinking cursor when ENTER is pressed. Zoom Out: Zooms out from the blinking cursor when ENTER is pressed. ZStandard: Resets the window to [-10,10] [-10,10]Example 1:Let’s experiment with the windowing with some simple graphs. We will graph two linear lines7
and adjust the window to see where they intersect.1) In the [Y ] menu type 3x 4 into Y1. (The shortcut for ‘x’ is [X,T,Θ,n])2) Type -5x-40 into Y2. (Typing these equations into [Y ] means these will be graphed when[GRAPH] is selected. All equations need to be in y format.)3) Select ZStandard in the [ZOOM] menu. The two lines should be drawn on the screen4) As you can see, the intersection of the two lines is past the bottom of the screen. We will needto increase Ymin in order to see the intersection. Go to the [WINDOW] menu and change Ymin from-10 to -20.5) Select [GRAPH]. By changing the window boundary, we can now see the intersection.6) Select [TRACE]. Use this to practice navigating along the lines. Using the arrow keys, UP and DOWNswitch you from line to line. LEFT and RIGHT move you along a single line. The x and y coordinates of thecursor will show up along the bottom of the screen. The line the cursor is currently on will show up on theupper left corner of the screen.7) Select ZStandard in the [ZOOM] menu again. As you can see, the window resets to [-10,10] [-10,10].8) Select Zoom Out in the [ZOOM] menu. You should now see a small blinking cursor on thegraph. You can move the cursor around with the arrow keys. Press [ENTER] when you’re ready tozoom out, and the graph expand from where the cursor is. You should be able to see theintersection again.9) Select Zoom In from the [ZOOM] menu. Move the cursor as close to the intersection you canand hit [ENTER]. The graph should be zoomed into where the cursor was, near the intersection.8
This shows you how the [Y ], [WINDOW], [ZOOM], and [GRAPH] menus interact. [Y ] defines whatto graph, [ZOOM] and [WINDOW] define the boundaries of the graph, and [GRAPH] is where theactual graph is drawn.Example 2:Let’s carry on from the previous example by actually calculating the intersection of the two lines.Intersect and all other graphing calculations are found in the [CALC] menu.10) Select intersect from the [CALC] menu. You will see three questions in turn in the lower leftcorner: First Curve?, Second Curve?, and Guess?. Hit [ENTER] to select 3x 4 as the first curve,and [ENTER] again to select -5x-40 as the second curve. (If there are many lines, use the up anddown arrow keys as needed to select the correct lines.) Guess means to select a suitable startingpoint for the calculation. In this example, any starting point will do. After you hit [ENTER] onemore time, the point (-5.5,-12.5) should be highlighted. (Any starting point works here becausethere is only one intersection. If there is more than one intersection, it will find the one closest toyour cursor. Use the left and right arrow keys to move the cursor along a line.)Example 3:Another common calculation is to find the minimum or maximum of a function. Because straightlines don’t have minimums or maximums, let’s clear Y1 and Y2 and try a different curve.11) Clear Y1 and Y2. Enter x2 4x-3 into Y1.12) Select ZStandard in the [ZOOM] menu.9
13) Select minimum from the [CALC] menu. You will again see three questions in turn in the lowerleft corner: Left Bound?, Right Bound?, and Guess?. The Left Bound and Right Bound questionsare asking you to set the left and right boundaries of where to search for the minimum. Use theleft and right arrow keys to move the cursor to the left of the minimum (hit [ENTER]) and to theright of the minimum (hit [ENTER]). Once again, Guess means to select a suitable starting pointfor the calculation. Because there is only one minimum in this example, any starting point willdo. After you hit [ENTER] one more time, the point (-2,-7) should be highlighted. (If there is morethan one minimum, it will find the one closet to your cursor.)All the [CALC] menu commands work like this, including maximum. In the lower left corner it tellsyou what kind of input it wants. Move the cursor as needed and press [ENTER] for each input.Section answers:1) [Y ][3][X,T,Θ,n][ ][4][ENTER]2) [(-)][5][X,T,Θ,n][(-)][4][0]3) [ZOOM][6]4) [WINDOW][DOWN ARROW][DOWN ARROW][DOWN ARROW][(-)][2][0]5) [GRAPH]6) [TRACE]7) [ZOOM][6]8) [ZOOM][3][ENTER]9) [ZOOM][2][LEFT ARROW]x6 [DOWN ARROW]x1010) [2nd][TRACE][5][ENTER][ENTER][ENTER]11) [Y ][CLEAR][DOWN ARROW][CLEAR][UP ARROW][X,T,Θ,n][ ][2][ ][4][X,T,Θ,n][-][3]12) [ZOOM][6]13) [2nd][TRACE][3][(-)][5][ENTER][0][ENTER][ENTER]10
III. MatricesOverview:Everything to do with matrices is in the [MATRIX] menu. This menu has three submenus:Names: Where you store the list of matrices you’ve entered.Math: A list of matrix commands.Edit: Where you enter or change a matrix.After you’ve entered a matrix, using the Edit menu, calculations for matrices are done as usual onthe home screen by calling the variables listed on the Names menu. You can see how this worksin the following examples.Entering a Matrix:In the EDIT submenu, choose any name for your matrix and hit enter. Here you can set thedimensions of your matrix and fill in all the cells. When you are done, [QUIT] back to the homescreen.1) Enter this in matrix [A]:1 2 1[A] 2 4 1 4 4 2Arithmetic on a Matrix:All arithmetic is done on the home screen. You can call the name of a matrix through the NAMEsubmenu of the [MATRIX] menu.2) Find the inverse of the previous matrix by using [x-1]. You should get1 0.5[A]-1 2 .5 . 75 6 123) Enter this inverse into matrix [B]. Then multiply [A] and [B]. You should get:1 0 0[A] * [B] 0 1 0 0 0 1Adding and subtracting matrices works the same way:4) In matrices [A] and [B] enter:51[A] 2 4[B] 1 2 3 411
5) When you add and subtract them you should get:6 4 4 8[A] [B] [A] – [B] 4 0 2 0Row Reduction on a Matrix :More advanced commands are available in the MATH submenu of the [MATRIX] menu. The mostcommonly used is rref, which takes one matrix as a variable and returns its reduced row echelonform.For example,7) Given this system of linear equations, find x, y, and z.2x 2y-z 34x y 5-x -2y -z 2We can represent this system as a matrix. Let’s use matrix [A]:22 1 3[A] 410 5 1 2 1 2Now we can solve for x, y, and z using row reduction. After entering it into matrix [A], select rref in theMATH submenu and call matrix [A] from the NAME submenu.1 0 0 1.461538462rref([A]) 0 1 0 .8461538462 0 0 1 1.769230769Therefore,x 1.461538462y -.8461538462z -1.769230769Section answers:1) [2nd][x-1][LEFT ) [2nd][x-1][ENTER][x-1][ENTER]3) [2nd][x-1][LEFT [ENTER]12
4) [2nd][x-1][LEFT ER][1][ENTER][4][ENTER][2nd][x-1][LEFT 3][ENTER][4][ENTER][2nd][MODE]5) [2nd][x-1][ENTER][ ][2][ENTER]6) [2nd][x-1][LEFT -)][1][ENTER][2][ENTER][2nd][MODE][2nd][x-1][RIGHT ARROW][ALPHA][APPS][2nd][x-1][ENTER][)][ENTER]13
IV. Tips and TricksDegrees and Radians:You can change between degrees and radians in the [MODE] menu. To change between the two,use the arrow keys to highlight either RADIAN or DEGREE and hit [ENTER].For example,1) sin(π/6) .5(in radians)2) sin(π/6) .0091383954 (in degrees)Fractions and Decimals:You can convert between decimal and fraction by going to the [MATH] menu and using either FRAC or DEC.For example,3) .875 FRAC 7/84) 7/8 DEC .8755) . 875. 31257/8.4 FRAC 5/16.62/5 3/5Recalling Previous Answers:You can refer back to the most recent calculation with the [ANS] key. You can also recall theentire previous line with [ENTRY]. (Using [ENTRY] multiple times in a row goes further back intoyour history.) This makes it very easy to chain calculations together or make minor adjustmentsto previous lines.Use [ANS] and [ENTRY] to help in the following calculations.6) 52 2514
𝐴𝑁𝑆 5ANS 6*ANS 35 (notice how ANS is automatically added if the first character on a new lineis an operation.)7) 5 7 8 205 7 8 9 296 7 8 9 30Section answers:1) [MODE][DOWN ARROW][DOWN ARROW][ENTER][2nd][MODE][SIN][2nd][ ][/][6][)][ENTER]2) [MODE][DOWN ARROW][DOWN ARROW][RIGHTARROW][ENTER][2nd][MODE][SIN][2nd][ ][/][6][)][ENTER]3) [.][8][7][5][MATH][ENTER][ENTER]4) [7][/][8][MATH][2][ENTER]or[7][/][8][ENTER]5) [2nd][x-1][LEFT [2nd][MODE][2nd][x-1][ENTER][MATH][ENTER][ENTER]6) [5][ ][2][ENTER][2nd][x2][2nd][(-)][)][ENTER][ ][6][*][2nd][(-)][ENTER]7) [5][ ][7][ ][8][ENTER][2nd][ENTER][ ][9][ENTER][2nd][ENTER][UP ARROW][6][ENTER]15
V. TroubleshootingChanging Brightness:The screen contrast can be changed by pressing the [2nd] key and holding down the up or downarrows until the brightness is set to the desired level. Pressing up darkens the screen and pressingdown lightens the screen.Hanging Calculation/Not Responsive:If the calculator is not responding to input, check to see if it is in the middle of a calculation. Thebusy signal is a dotted line on the upper right corner of the screen. If there is a busy signal,[ENTER] pauses and unpauses a calculation, and [ON] stops it completely.Resetting Memory:You can reset the memory by going to the Memory menu, selecting Reset, and selecting AllRAM:[2nd][ ][7][ENTER][2]Error Screens:Errors on the TI graphing calculators often show themselves as an error screen. You will see ascreen with the word “ERR”, with the name of the type of error. There will be two options. Quit,which returns you to the home screen on new line, where you can start from scratch. And Goto,which returns the cursor to place where the error occurred, or the best approximation to wherethe error is, so you can correct it.This is an example of an error screen where the calculator says a DOMAIN error occurred.A full list of errors can be found online or in the manual. Common types of errors include:ERR:SYNTAXSyntax errors are usually typos. Something was entered incorrectly in a way thatcalculator cannot understand the input.Some possibilities include:1. Using the [(-)] (negative) sign instead of the [–] (minus) sign or vice versa.16
2. Mismatched parentheses.3. Incorrect use of symbols, such as trying to do 3 2 instead of 3 2.ERR:NONREAL ANSThe answer exists but it is partially or completely imaginary. For example, square rootsand logs of negative numbers are imaginary. You can allow imaginary answers by goingto MODE and selecting a bi instead of REAL.ERR:DOMAINThis tells you that the calculator understood your input, but that what you entered was notvalid. For example, you will get this error if you try to do sin-1(5) because the domain ofsin-1 is always between -1 and 1.ERR:WINDOW RANGEThis error occurs if you define a window range in WINDOW which is invalid. Forinstance, you cannot define Xmin -10 and Xmax -20 because then Xmin is greater thanXmax.17
VI. - ConclusionThat should help get you started. There are many other resources out there to help you learnmore.Google/Youtube:If you are stuck doing something specific or encounter an unknown error, 99% of thetime, you are not the first person to have similar questions. Searching “TI-83” and adescription of your goal will bring up many different walkthroughs. For example, “Ti-83finding intercepts between two lines.”Rockville’s Self-paced Calculator TutorialsThere are two tutorials, one general and one for statistics, available on Rockville’swebsite. You can use them to familiarize yourself with the capabilities of the calculator.They are at: spx?id 27975The manual:The manual lists every function and button in the calculator and what it does. There arecopies in the M.A.P.E.L Center. Alternatively, searching “TI-83 plus manual” will bringup many sites that have a copy. One example ebooksTI-Basic Developer Website: http://tibasicdev.wikidot.com/This site is designed for TI programmers, and has much of the same information the manual hasand more. You can find a list of every command on the calculator athttp://tibasicdev.wikidot.com/command-index.18
In this tutorial, I will be assuming you have never used a TI graphing calculator before. We will cover what you would need in a basic algebra or precalculus class. Detailed answers/keystrokes for all examples are at the end of each section. If you are following this tutorial on a TI-84 calculator you may have Mathprint installed. Turn Mathrprint