Transcription
NBER WORKING PAPER SERIESTHE CORONAVIRUS EPIDEMIC CURVE IS ALREADY FLATTENINGIN NEW YORK CITYJeffrey E. HarrisWorking Paper 26917http://www.nber.org/papers/w26917NATIONAL BUREAU OF ECONOMIC RESEARCH1050 Massachusetts AvenueCambridge, MA 02138April 2020The comments of the following individuals are greatly appreciated: Gil Brodsky, Peter Diamond,Denise Everett, Daniel Geselowitz, Ali Harris, Dena Harris, Kathryn Blackmond Laskey, KenLaskey, Zoe Lazarre, Marylee Maendler, Melissa Oppenheim Margolis, Heide O’Connell, BrinaSedar, Susan Goldberg Simon, Rivana Cohen Stadtlander and Mark Weinstein. The opinionsexpressed here are solely those of the author and do not represent the views of the MassachusettsInstitute of Technology, the National Bureau of Economic Research, or any other individual ororganization. The author has received no direct or indirect remuneration for this article, and hasno conflicts of interest to declare. The views expressed herein are those of the author and donot necessarily reflect the views of the National Bureau of Economic Research.NBER working papers are circulated for discussion and comment purposes. They have not beenpeer-reviewed or been subject to the review by the NBER Board of Directors that accompaniesofficial NBER publications. 2020 by Jeffrey E. Harris. All rights reserved. Short sections of text, not to exceed twoparagraphs, may be quoted without explicit permission provided that full credit, including notice, is given to the source.
The Coronavirus Epidemic Curve is Already Flattening in New York CityJeffrey E. HarrisNBER Working Paper No. 26917April 2020JEL No. I1,I12,I18,I28ABSTRACTNew York City has been rightly characterized as the epicenter of the coronavirus pandemic in theUnited States. Just one month after the first cases of coronavirus infection were reported in thecity, the burden of infected individuals with serious complications of COVID-19 has alreadyoutstripped the capacity of many of the city’s hospitals. As in the case of most pandemics,scientists and public officials don’t have complete, accurate, real-time data on the path of newinfections. Despite these data inadequacies, there already appears to be sufficient evidence toconclude that the curve in New York City is indeed flattening. The purpose of this report is to setforth the evidence for – and against – this preliminary but potentially important conclusion.Having examined the evidence, we then inquire: if the curve is indeed flattening, do we knowwhat caused to it to level off?Jeffrey E. HarrisDepartment of Economics, E52-422MIT50 Memorial DriveCambridge, MA 02142and NBERjeffrey@mit.edu
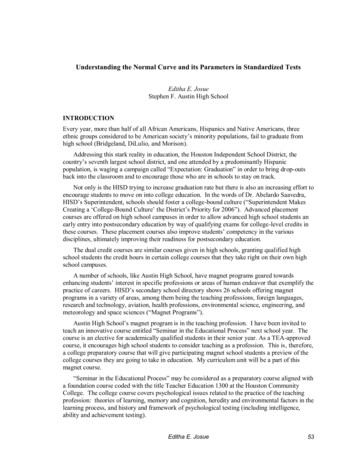
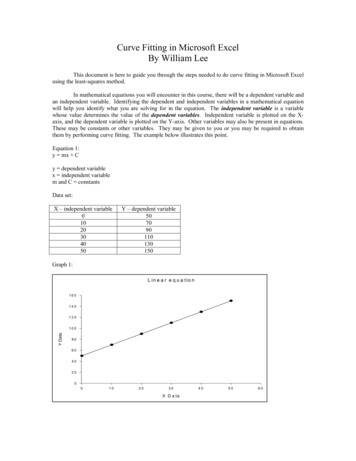
The Curve Is Already Flattening in NYCJeffrey E. Harris3-Apr-2020IntroductionNew York City has been rightly characterized as the epicenter of the coronaviruspandemic in the United States. Just one month after the first cases of coronavirus infection werereported in the city, the burden of infected individuals with serious complications of COVID-19has already outstripped the capacity of many of the city’s hospitals (Harris and Sellers 2020). Inresponse to the growing threat, Mayor de Blasio on March 16, 2020 issued an order limitinggatherings and closing numerous places of congregation. On March 21, Governor AndrewCuomo issued a statewide order that all New Yorkers except those working in essential businesshad to stay home. The objective of these social distancing measures has been to slow down thetransmission of infection – or “flatten the curve” of the epidemic – and thus relieve the burden onthe city’s healthcare system and buy time until effective treatments and possibly a vaccine can bedeveloped.As in the case of most pandemics, scientists and public officials don’t have complete,accurate, real-time data on the path of new infections. In the case of the coronavirus epidemic,data interpretation is further complicated by the fact that about half of all infected individuals areasymptomatic (that is, they have few if any symptoms) and don’t ordinarily seek medicalattention. In the absence of mandatory, comprehensive testing, it is difficult to assess exactlywhere we are in the course of the epidemic and whether the curve is indeed flattening.Despite these data inadequacies, there already appears to be sufficient evidence toconclude that the curve in New York City is indeed flattening. The purpose of this report is to setforth the evidence for – and against – this preliminary but potentially important conclusion.Having examined such evidence, we then inquire: if the curve is indeed flattening, do we knowwhat caused to it to level off?Daily Counts of Newly Reported InfectionsFigure 1 shows the main evidence in favor of a flattening of the curve. Plotted are thenumbers of new infections reported by the New York City Department of Health each day fromMarch 1–30, 2020 (New York Department of Health and Mental Hygiene 2020b). The verticalaxis gauges the numbers of infections on a logarithmic scale. The pink-colored data points coverthe period from March 1–20, while the mango-colored points cover the period from March 21onward. We prospectively chose the March 21 cutoff date to correspond to the effective date ofGov. Cuomo’s order, before we observed the subsequent data points. A straight-line has been2
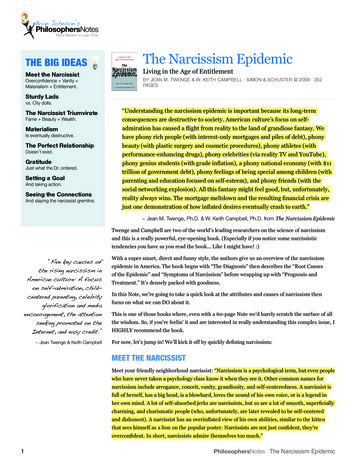
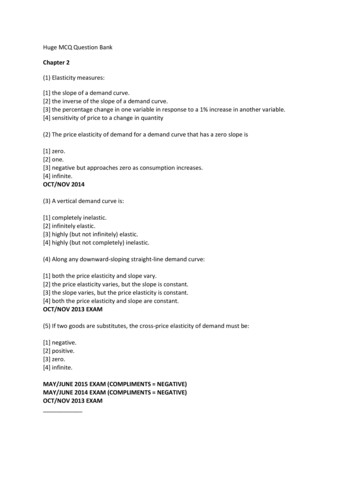
The Curve Is Already Flattening in NYCJeffrey E. Harris3-Apr-2020fitted to the data from March 1–20, based upon Poisson regression, as described further inAppendix 2. The slope of the straight line corresponds to an estimated doubling time of 1.3 days.The mango-colored points in Figure 1 show a marked deviation from the exponentialtime-path projected from the pink-colored points through March 20. The number of reported newinfections on March 30 was 4,603. If the path of the epidemic had continued at the paceNew York City10100100010000Initial Doubling Time 1.3 days1New Reported COVID 19 Cases per Dayin New York City (Logarithmic Scale)100000predicted from the fitted line, new daily infections would by now exceed 100 thousand.3/1 3/3 3/5 3/7 3/9 3/11 3/13 3/15 3/17 3/19 3/21 3/23 3/25 3/27 3/29Date Report ReceivedFigure 1. New Reported COVID-19 Cases per Day in New York City (Logarithmic Scale), Based on Date Reported.Best-fit trend line (Poisson regression) and estimated doubling time based upon observations through 3/20/2020,shown as pink data points. Observations from 3/21/2020 onward shown as mango data points.As discussed in Appendix 1, the initial exponential takeoff in Figure 1 is exactly what themost widely used mathematical model would predict for an epidemic where virtually the entirepopulation is susceptible. And the extremely short doubling time is exactly what mathematicalmodelers would expect in a population so incredibly dense as New York City. That’s because thecloser people are together, the higher is the likelihood that an infected person carrying the viruswill make contact with a susceptible person. By way of comparison, Figure 2 shows thecomparable plot for Los Angeles County (County of Los Angeles Public Health 2020), where we3
The Curve Is Already Flattening in NYCJeffrey E. Harris3-Apr-2020haven’t thus far seen a definite flattening of the curve, but where the estimated doubling timethrough March 20 was 2.6 days. The population density of Los Angeles County is about 2,500persons per square mile, in contrast to about 26,400 persons per square mile in New York City.10100Initial Doubling Time 2.6 days1New Reported COVID 19 Cases per Dayin Los Angeles County (Logarithmic Scale)1000Los Angeles County3/4 3/6 3/8 3/10 3/12 3/14 3/16 3/18 3/20 3/22 3/24 3/26 3/28 3/30Date Report ReceivedFigure 2. New Reported COVID-19 Cases per Day in Los Angeles County (Logarithmic Scale), Based on DateReported. Best-fit trend line (Poisson regression) and estimated doubling time based upon observations through3/20/2020, shown as pink data points. Observations from 3/21/2020 onward shown as mango data points.Alternative Explanation #1. Supply Constraints on TestingIf Figure 1 does not represent the actual path of new daily infections in New York City,then we need to come up with an alternative explanation. One possibility is that the apparentflattening of the mango data points is the result of supply constraints on testing. That is, thesupply of tests – including the personal protective equipment required to perform those tests –was simply inadequate to keep up with the demand. On March 20, in fact, the New York CityDepartment of Public Health issued a memo observing, “Healthcare resources must be saved totreat the sickest patients who require inpatient and critical care.” The Department directedproviders and hospitals to “immediately stop testing non-hospitalized patients for COVID-19unless test results will impact the clinical management of the patient. In addition, do not test4
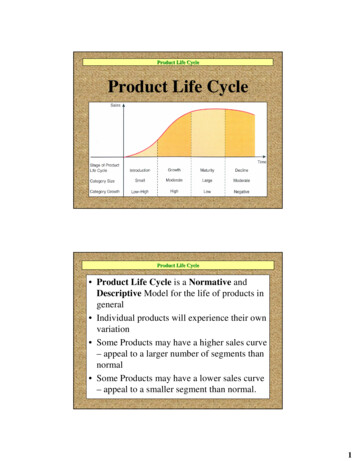
The Curve Is Already Flattening in NYCJeffrey E. Harris3-Apr-2020asymptomatic people, including HCWs [healthcare workers] or first responders.” (New YorkDepartment of Health and Mental Hygiene 2020a)The fact that the Department of Health issued such a directive does not mean that it wasfully complied with. As clinicians well know, the proviso “unless test results will impact clinicalmanagement” is just too squishy. Figure 3 addresses this question. The green-color data pointsalong the top of Figure 3 show the numbers of tests performed in New York City on each dayfrom March 8–27, 2020. The light gray-colored points show the numbers of such tests that werereported as positive, while the orange-colored points the numbers of such tests that were linkedto a patient who was ultimately hospitalized (New York Department of Health and MentalDaily Tests, Cases and Hospitalizationsin New York City (Logarithmic Scale)100100010000Hygiene 3/163/183/203/223/243/26Date Test PerformedFigure 3. Daily Counts of Tests Performed, New Cases Identified, and New Cases Hospitalized in New York City(Logarithmic Scale), Based on Date Test Performed. Observations cover tests performed from March 8–27, 2020.The horizontal axis in Figure 1 for New York City and Figure 2 for Los Angeles Countymeasured the date each test result was received. That allowed us to compare the trends in the tworegions. The further advantage of reporting by date received is that the reporting agency doesn’thave to keep updating its past case counts. The horizontal axis in Figure 3, by contrast, measures5
The Curve Is Already Flattening in NYCJeffrey E. Harris3-Apr-2020the date each test was performed. Unfortunately, displaying the data in that manner runs into amessy statistical problem (Harris 1990b). The reporting agency has to keep updating past countsevery time a new case is received. What’s worse, the most recent data points are invalid becauseall the cases haven’t yet come in. Accordingly, we have omitted the data points after March 27,which are subject to revision.The light gray-colored points in Figure 3 confirm the pattern for New York City seen inFigure 1. There is a rapid initial phase followed by a leveling off of counts of new cases. Thegreen-colored points confirm that the number of tests performed was considerably greater thanthe number of positive test results. While there is a temporary dip in the number of testsperformed during March 21–22, right after the Department of Public Health ordered providers torestrict testing, the number of tests performed daily quickly rebounded. Most important, thenumber of hospitalized cases has followed the same basic pattern – an initial takeoff followed bya plateau.Table 1 further interprets the data in Figure 3, aggregating the testing dates into five-dayintervals. The rightmost column shows that healthcare providers in New York City have not beentesting just hospitalized COVID-19 patients. If they were, new COVID-19 hospitalizations as afraction of all newly reported COVID-19 cases would be a whole lot higher than 22 percent.What’s more, the percentage would have increased markedly during the more recent interval. Infact, the ratio of hospitalized COVID-19 cases to all reported COVID-19 cases in New York Cityis entirely compatible with data reported by the Centers for Disease Control for the entire U.S.(CDC COVID-19 Response Team 2020), as well as data from Wuhan, China (Wang et al. 2020).Table 1. Number of Positive Tests, Ratio of Tests Performed to Positive Tests, and Percentage of Positive TestsLinked to Hospitalization for 5-Day Testing Intervals, New York City.Dates Performed Number of PositiveCOVID-19 /24/20–3/28/201,2348,67014,04414,461Ratio of TestsPerformed toPositive Tests3.92.21.81.5Percentage ofPositive Tests Linkedto Hospitalization22.9%16.7%19.9%22.2%6
The Curve Is Already Flattening in NYCJeffrey E. Harris3-Apr-2020As to the assertion that the supply of tests has been severely limited, the availableevidence is that the state of New York has been way ahead of other states in coronavirus testing,having screened 32,400 people by March 20 alone (Klersz 2020). By March 30, New York Cityalone had tested over 79,000 individuals – more than twice as many tests as confirmed COVID19 infections – while New York state had tested over 186,000 (Choi et al. 2020). Table 1 showsthat even during the last five-day interval, the number of tests was still 50-percent greater thanthe number of infections.Alternative Explanation #2. We’re Missing All the Asymptomatic Cases.It is widely acknowledged that many individuals infected by coronavirus have too fewsymptoms to seek medical attention, yet they can still serve as carriers, transmitting the infectionto others. That observation alone would lead us to suspect that the counts of newly diagnosedcases in Figure 1 substantially understate the true daily incidence – a statistic we could reliablyobserve only if we had universal mandatory testing. However, there is no clear reason to believethat the extent of understatement has changed significantly since the one-month takeoff periodcovered in Figure 1. So long as the ratio of undetected asymptomatic cases to detectedsymptomatic cases has remained constant, we would still observe the flattening in thelogarithmic plot in the figure even if we had complete data on all cases. Put differently, theunderreporting bias affects the magnitude but not the shape of the incidence curve.Perhaps the best data on the ratio of asymptomatic to symptomatic cases comes from theDiamond Princess cruise ship, a closed population in which everyone’s COVID-19 infectionstatus was ascertained (Russell et al. 2020). Out of a total of 3,711 tested Diamond Princesspassengers of all ages, 619 (or 13%) were infected. Among the 619 infected passengers, 301 (or49%) were asymptomatic. That gives us the rule of thumb that, for every symptomatic infectedperson seeking medical attention, there’s another asymptomatic infected person who didn’t. Inthe forecasts of the London modeling group, these asymptomatic infected people are animportant force driving the epidemic (Li, Pei, et al. 2020). They may be less infectious than theirsymptomatic counterparts, but there are so many of them.It is arguable that the ratio of undocumented asymptomatic infections to documentedsymptomatic infections depends on the age distribution of the population. But the DiamondPrincess data do not show a marked difference in this ratio by age. Among those infectedpassengers under age 70, a total of 53 percent had few or no symptoms. Among those infected7
The Curve Is Already Flattening in NYCJeffrey E. Harris3-Apr-2020passengers age 70 or more, a total of 43 percent were asymptomatic, not much different from theasymptomatic proportion in the younger group (Russell et al. 2020).In short, there is no obvious biological or economic reason why the proportion ofundocumented asymptomatic cases has changed enough to explain the marked flattening of thetrend in documented cases seen in Figure 1.Alternative Explanation #3. We’re Missing the False Negatives.Tests for coronavirus infection appear to be highly specific. That is, if the test is positive,the clinician can be confident that the patient is in fact infected. But not all tests are sensitive.Depending on the sample taken and the timing of the test, the result could be a false negative.The available data from the Wuhan outbreak indicate that tests based on a sample of the patient’ssputum taken during the first two weeks of infection are pretty sensitive, with a false negativerate in the range of 11.1–25.6%. But tests based on nasal swabs, which are the most commonthus far in the U.S., are considerably less sensitive, with a false negative rate in the range of26.7–46.4% (Yang et al. 2020). That means routine nasal swab testing could be missing a lot ofcoronavirus infections.As in our consideration of Alternative Explanation #2, the issue here is not how manygenuine cases of COVID-19 have been missed as a result of insensitive testing, but whether thepercentage of false positives has changed significantly during the month of March 2020 in NewYork City. The evidence from the Wuhan outbreak is that samples taken after the first two weeksof infection had higher false positive rates in the range of 38.9–57.1%. However, we have nodata to indicate that coronavirus testing has been significantly delayed in recent days.Alternative Explanation #4. We Need to Break Down the Data by Borough.Figure 1 aggregated the data from all five boroughs of New York City. The figure did notaddress the possibility that in one or more boroughs, the epidemic may be continuing to grow atan exponential rate comparable to the initial takeoff. The concern is heightened by reports thatsuch hospitals as Elmhurst in Queens and Columbia Presbyterian in The Bronx have beenflooded with COVID-19 patients (Hopkins 2020). What’s more, the Department of Public Healthhas released a heat map of the city showing that in certain neighborhoods of the Bronx, Queensand Brooklyn, the proportion of positive tests has exceeded 56 percent (New York Departmentof Health and Mental Hygiene 2020e). Overall, the prevalence of positive tests was 561 per8
The Curve Is Already Flattening in NYCJeffrey E. Harris3-Apr-2020100,000 population in Queens and 530 per 100,000 in The Bronx, compared to 351 per 100,000in Manhattan (New York Department of Health and Mental Hygiene 2020c).Figure 4 plots the counts of newly reported cases from March 21 onward for the fourprincipal boroughs of the city. While the daily counts are noisy, the burden of disease is greaterin Queens and Brooklyn. Still, all of the estimated doubling times are substantially longer thanthat of the initial takeoff of 1.3 days seen in Figure 1. The data points for Manhattan suggest thatNew Reported COVID 19 Cases per Dayin Four Boroughs (Logarithmic Scale)100010000incidence in this borough may in fact have reached a flat peak and leveled off.Queens, DoublingTime 8.5 DaysBrooklyn, DoublingTime 10.8 DaysBronx, DoublingTime 13.1 Days100Manhattan, DoublingTime 41.5 Days3/213/223/233/243/253/263/273/283/293/30Date Report ReceivedFigure 4. New Reported COVID-19 Cases per Day in Four New York City Boroughs (Logarithmic Scale), Based onDate Reported. Best-fit trend lines (Poisson regression) and estimated doubling times are based upon observationsfrom 3/21/2020 onward. The data and regression line for each borough are distinguished by color: lilac for Queens,cyan for Brooklyn, lime for the Bronx, and orange for Manhattan.Alternative Explanation #5. The Leaky CityNew York City has not been under complete lock down. People enter and exit. While thestreets of Manhattan area deserted, it’s not necessarily because all Manhattanites are stayinghome, but because they have fled. While there is substantial anecdotal evidence supporting thisexplanation (Leavenworth 2020, Hampton 2020, Scicchitano 2020), we have been unable to find9
The Curve Is Already Flattening in NYCJeffrey E. Harris3-Apr-2020any quantitative estimates of the magnitude of the exodus. If those who have fled the city wereless likely to be infected, the leak would have raised rather than lowered the observed incidence.For the sake of argument, let’s assume that those who fled the city were just as likely tobe infected. For this theory alone to explain the apparent flattening of the curve in Figure 1, wellover 90 percent of the population of New York City would have to have joined the coronavirusdiaspora.Alternative Explanation #6. The Rapid Initial Upswing Is Unrealistic.Is the initial doubling time of only 1.3 days in New York City unrealistic? As noted inAppendix 2, we estimated the slope of the initial takeoff to be 0.53. Using the formula inAppendix 1, we computed a doubling time of ( log 2 ) 0.53 1.3 days. In general, the longer aninfected person remains contagious, the more rapidly the epidemic grows. Data from Wuhanprovide a reasonable estimate of the average duration of infectivity of 6.5 days (Ferguson et al.2020). Using another formula in Appendix 1, we estimate that the basic reproductive number R0in New York City at the start of its epidemic was 6.5 0.53 , which comes to about 3.4. If weperform the same exercise for the Los Angeles County data in Figure 2, we get a basicreproductive number of R0 1.8 . The estimated reproductive number for Wuhan, which has apopulation density of about 11,400 persons per square mile, has been estimated to be about R0 2.2 to 2.4 (Li, Guan, et al. 2020, Riou and Althaus 2020). Accordingly, the slope of the initialtakeoff for New York City shown in Figure 1 is hardly unrealistic, and in fact is entirelyconsistent with its extraordinarily high population density in comparison even to Wuhan.Alternative Explanation #7. Heterogeneous Mixing or Super-SpreadersOne interpretation of these findings is that the apparent flattening of the incidence curvein Figure 1 is a result of extreme heterogeneity in the infectivity of the New York Citypopulation, with a small proportion of the total population – on the order of 5,000 individuals –subject to the super-spread of the virus. While there are anecdotal reports of such super-spread inthe New York City area (Williamson and Hussey 2020), we haven’t found clear evidence of amajor source comparable to the 77 COVID-19 cases reportedly emanating from the late FebruaryBiogen meeting in Boston (Marcelo and O’Brien 2020).10
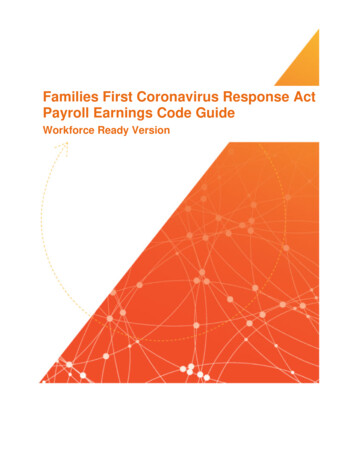
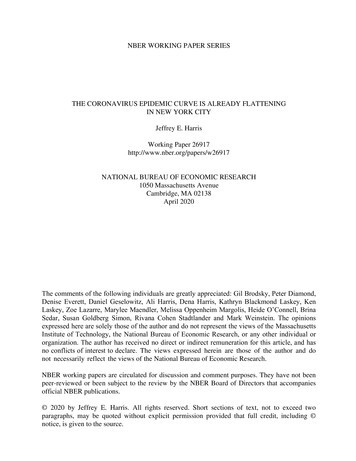
The Curve Is Already Flattening in NYCJeffrey E. Harris3-Apr-2020Alternative Explanation #8. Where Are the Supporting Ancillary Data?If the leveling off observed in Figure 1 is real, then we would expect to see the samepattern in supporting data. We’ve already looked at hospitalizations in Figure 3. The next likelycandidate would be the daily numbers of deaths in New York City. This source of data has itsown problems, not the least of which is it comes from the same agency as the case andhospitalization data, and may thus be subject to common biases. What’s more, the observedpatterns may be complicated by significant further time delays. By one estimate, it takes anaverage of 16 days from the onset of symptoms until a patient dies of complications (Muzimotoand Chowell 2020). With an incubation period from initial infection to onset of symptomsaverages 5 days (Linton et al. 2020, Li, Guan, et al. 2020), the combined time from initialinfection to death will average about three weeks.Bronx CountyNew York CountyKings CountyQueens CountyRichmond CountyFigure 5. Plots of the Percentage with Influenza-Like Illness Reported by Kinsa, Inc. in Five Counties in the NewYork City Area, February 15 – March 30, 2020.11
The Curve Is Already Flattening in NYCJeffrey E. Harris3-Apr-2020We therefore looked for an ancillary data source that is timely and independent of theNew York City Department of Health. To that end, Figure 5 above shows the trends in influenzalike illness monitored at the U.S. Health Weather Map, a compilation based on recordings ofKinsa, Inc.’s network of smart thermometers, produced in collaboration with Benjamin Dalziel atOregon State University (Kinsa 2020, Dalziel 2020). The figure displays the estimatedpercentages with febrile illness in each of the five counties comprising the New York City areaduring February 15 – March 30, 2020. The dashed blue curve, along with the surrounding lightblue confidence range, shows the typical percentage with influenza-like illness. The orange datapoints show the observed percentages in each county, and the red data points indicate where theobserved percentages fall above the confidence range.In each county, the percentages with influenza-like illness began to rise at the beginningof March, just when the influenza season was subsiding. By the middle of March, however, theprevalence of influenza-like illness has reversed itself and begins to decline toward the expectedbaseline. These patterns, derived from data wholly independent from reports of the New YorkDepartment of Health, support our findings in Figure 1.If the Flattening of the Curve is Real, How Did It Happen?None of the foregoing alternative explanations is mutually exclusive. In fact, it is entirelypossible that some of these alternative explanations are at least partially valid and that theepidemic curve in New York City is flattening. Based on the evidence reviewed here, however, itis difficult to dismiss out of hand the conclusion that the incidence of new coronavirus infectionshas indeed leveled off.This does not mean that the epidemic has reached its peak in New York City. That willhappen when the incidence of new infections clearly drops. Still, the leveling off of the incidencecurve is a key early indicator that something favorable is happening. The question foreconomists, public health practitioners and policy makers is: what’s making the curve flatten?There is certainly evidence that social distancing measures reduce transmission andflatten the curve. That includes an important study comparing the containment policies ofdifferent cities during the 1918 H1N1 influenza pandemic (Markel et al. 2007). The recentexperiences of Singapore, Hong Kong and Taiwan during the current COVID-19 pandemic,where social distancing measures were combined with aggressive case tracking, add credence tothe conclusion that public policies can be effective (Branswell 2020). In view of the five-day12
The Curve Is Already Flattening in NYCJeffrey E. Harris3-Apr-2020incubation period from infection to symptoms, the observed decline starting on March 21 inFigure 1 would thus be consistent with Mayor de Blasio’s order limiting gatherings and closinggyms and other places of congregation. It would be reinforced by subsequent orders that all NewYorkers except workers in essential businesses must stay at home.There is, however, another strand in the economics literature suggesting that peoplevoluntarily engage in avoidance behaviors once they fully perceive the risks of contagion. In astudy of the time path of the H1N1 Swine Flu epidemic of 2009 in the U.S. – when there were noquarantines or lock downs – economists could see no other explanation for their finding that theincidence of new cases fell well below the exponential path predicted from epidemiologists’classical models (Yoo, Kasajima, and Bhattacharya 2010). Similarly, the incidence of HIVreached a peak in 1983 well before the advent of the first antiviral medication in 1986 (Harris1990a, Harris 1990b) and about a year before San Francisco’s Director of Public Health orderedthe closure of fourteen bathhouses in October 1984. In the present context, ridership on NewYork City subways was already down 19 percent by March 12 and 60 percent by March 16(Metropolitan Transportation Authority 2020). In all of these cases, the critical ingredient in thepublic policy mix may have been the successful communication of consistent, clear, accurate andtimely information to millions of individuals, who responded by taking action withoutgovernment coercion. Put bluntly, what flattened the curve was no more than the naked truth.Still, the two approaches to flattening the epidemic curve are hardly incompatible, oreven distinct. The promulgation of strong social distancing measures, in fact, may be the bestway to reinforce the credibility of the risk message. The mayor’s and governor’s orders mayhave been so impactful that they needed little or no formal enforcement. With the wide publicitythat many New York City hospitals were already triaging intensive care, one also wonders howmany people would actually go back to their regular daily activities if the restrictions on socialdistancing were abruptly – and foolishly – withdrawn tomorrow.There is a third related behavioral theory that people are most motivated to take action toreduce risk when they personally come in contact with other affected individuals. For example,having a family member with a diagnosis of cancer enhances an individual’s intention to quitsmoking (Patterson et al. 2010). These considerations might help explain why we have observeda slowing of COVID-19 incidence in New York City, but not so far in Los Angeles County. InNew York City to date, about 1 out of every 226 residents is known so far to have contracted13
The Curve Is Already Flattening in NYCJeffrey E. Harris3-Apr-2020COVID-19. The probability of knowing at least one coronavirus-infected person in a social circleof 150 persons would be one-half. In Los Angeles, by contrast, only about 1 out of 4,100residents is so far known to have come down with the virus. The corresponding probability ofknowing at least one infected person in a comparable size social circle of 150 would be onlyabout 3.4 percent.As this working paper goes to press, the New York Times is running a piece entitledN.Y.C.’s 911 System Is Overwhelmed. ‘I’m Terrified,’ a Paramedic Says, with the subtitle, “Withcoronavirus cases mounting, emergency workers are making life-or
axis gauges the numbers of infections on a logarithmic scale. The pink-colored data points cover the period from March 1-20, while the mango-colored points cover the period from March 21 onward. We prospectively chose the March 21 cutoff date to correspond to the effective date of Gov. Cuomo's order, before we observed the subsequent data .