Transcription
Lecture 9: LinearRegression
Goals Develop basic concepts of linear regression froma probabilistic framework Estimating parameters and hypothesis testingwith linear models Linear regression in R
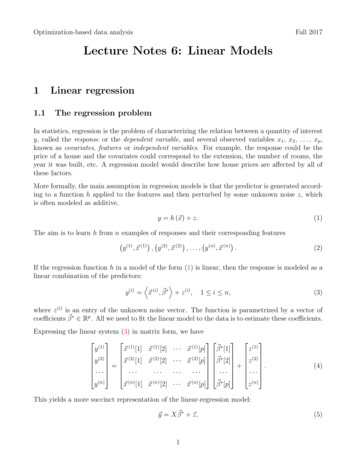
Regression Technique used for the modeling and analysis ofnumerical data Exploits the relationship between two or morevariables so that we can gain information about one ofthem through knowing values of the other Regression can be used for prediction, estimation,hypothesis testing, and modeling causal relationships
Regression LingoY X1 X2 X3Dependent VariableIndependent VariableOutcome VariablePredictor VariableResponse VariableExplanatory Variable
Why Linear Regression? Suppose we want to model the dependent variable Y in termsof three predictors, X1, X2, X3Y f(X1, X2, X3) Typically will not have enough data to try and directlyestimate f Therefore, we usually have to assume that it has somerestricted form, such as linearY X1 X2 X3
Linear Regression is a Probabilistic Model Much of mathematics is devoted to studying variablesthat are deterministically related to one anothery " 0 "1 xy!"y"x"0!!!"1 #y#xx!! But we’re interested in understanding the relationshipbetween variables related in a nondeterministic fashion!
A Linear Probabilistic Model Definition: There exists parameters " 0 , "1, and " ,2 such that forany fixed value of the independent variable x, the dependentvariable is related to x through the model equation!#y "!0 ! "1 x 2 " is a rv assumed to be N(0, # )True Regression Line!"3y"2"1!"0!!!!x!y " 0 "1 x
Implications The expected value of Y is a linear function of X, but for fixedx, the variable Y differs from its expected value by a randomamount Formally, let x* denote a particular value of the independentvariable x, then our linear probabilistic model says:E(Y x*) µY x* mean value of Y when x is x *2V (Y x*) " Y x* variance of Y when x is x *!!
Graphical Interpretationyy " 0 "1 xµY x 2 " 0 "1 x 2!!!µY x1 " 0 "1 x1!xx2x1 For example, if x height and y weight then!µ!Y x 60weight for!all individuals 60 inches tall in the population!is the average
One More ExampleSuppose the relationship between the independent variable height(x) and dependent variable weight (y) is described by a simplelinear regression model with true regression liney 7.5 0.5x and " 3 Q1: What is the interpretation of "1 0.5?The expected change in height associated with a 1-unit increase!in weight! Q2: If x 20 what is the expected value of Y?µY x 20 7.5 0.5(20) 17.5 Q3: If x 20 what is P(Y 22)?!" 22 -17.5 %P(Y 22 x 20) P ' 1( ) (1.5) 0.067#3 &
Estimating Model Parameters Point estimates of "ˆ 0 and "ˆ1 are obtained by the principle of leastsquaresnf (" 0 , "1 ) [ y i # (" 0 "1 x i )] 2!!i 1y!"0x! !"ˆ y # "ˆ x01!
Predicted and Residual Values Predicted, or fitted, values are values of y predicted by the leastsquares regression line obtained by plugging in x1,x2, ,xn into theestimated regression lineyˆ1 "ˆ 0 # "ˆ1 x1yˆ "ˆ # "ˆ x201 2 Residuals are! the deviations of observed and predicted valuese1 y1 " yˆ1e2 y 2 " yˆ 2!yy1!yˆ1!!!!e3e2e1!!x
Residuals Are Useful! They allow us to calculate the error sum of squares (SSE):nnSSE " (ei ) " (y i # yˆ i ) 22i 1i 1 Which in turn allows us to estimate " 2 :!"ˆ 2 SSEn #2! As well as an important statistic referred to as the coefficient of!determination:SSE2r 1"SST!!nSST # (y i " y ) 2i 1
Multiple Linear Regression Extension of the simple linear regression model to two ormore independent variablesy " 0 "1 x1 " 2 x 2 . " n x n #Expression Baseline Age Tissue Sex Error! Partial Regression Coefficients: βi effect on thedependent variable when increasing the ith independentvariable by 1 unit, holding all other predictorsconstant
Categorical Independent Variables Qualitative variables are easily incorporated in regressionframework through dummy variables Simple example: sex can be coded as 0/1 What if my categorical variable contains three levels:xi 0 if AA1 if AG2 if GG
Categorical Independent Variables Previous coding would result in colinearity Solution is to set up a series of dummy variable. In generalfor k levels you need k-1 dummy variablesx1 1 if AA0 otherwisex2 1 if AG0 otherwisex1 x2AA 1 0AG 0 1GG00
Hypothesis Testing: Model Utility Test (orOmnibus Test) The first thing we want to know after fitting a model is whetherany of the independent variables (X’s) are significantly related tothe dependent variable (Y):H 0 : "1 " 2 . " k 0H A : At least one "1 # 0R2kf 2(1 R ) n (k 1)Rejection Region : F" ,k,n#(k 1)!!
Equivalent ANOVA Formulation of Omnibus Test We can also frame this in our now familiar ANOVA framework- partition total variation into two components: SSE (unexplainedvariation) and SSR (variation explained by linear model)
Equivalent ANOVA Formulation of Omnibus Test We can also frame this in our now familiar ANOVA framework- partition total variation into two components: SSE (unexplainedvariation) and SSR (variation explained by linear model)Source ofVariationdfSum of SquaresMSFRegressionkSSR # ( yˆ i " y ) 2MSRMSEErrorn-2SSE # (y i " yˆ i ) 2SSRkSSEn "2Total! n-1!!!SST # (y i " y ) 2!Rejection Region : F" ,k,n#(k 1)!
F Test For Subsets of Independent Variables A powerful tool in multiple regression analyses is the ability tocompare two models For instance say we want to compare:Full Model : y " 0 "1 x1 " 2 x 2 " 3 x 3 " 4 x 4 #Reduced Model : y " 0 "1 x1 " 2 x 2 #! Again, another example of ANOVA:!SSER error sum of squares forreduced model with l predictorsSSEF error sum of squares forfull model with k predictors!(SSE R " SSE F ) /(k " l)f SSE F /([n " (k 1)]
Example of Model Comparison We have a quantitative trait and want to test the effects at twomarkers, M1 and M2.Full Model: Trait Mean M1 M2 (M1*M2) errorReduced Model: Trait Mean M1 M2 error(SSE R " SSE F ) /(3 " 2) (SSE R " SSE F )f SSE F /([100 " (3 1)]SSE F /96Rejection Region : Fa, 1, 96!
Hypothesis Tests of Individual RegressionCoefficients Hypothesis tests for each "ˆ i can be done by simple t-tests:!H 0 : "ˆ i 0H : "ˆ # 0Ai"ˆ i " iT se(" i )Critical value : t" / 2,n#(k#1)! Confidence Intervalsare equally easy to obtain:!"ˆ i t# / 2,n (k 1) se("ˆ i )
Checking Assumptions Critically important to examine data and check assumptionsunderlying the regression model OutliersNormalityConstant varianceIndependence among residuals Standard diagnostic plots include: scatter plots of y versus xi (outliers)qq plot of residuals (normality)residuals versus fitted values (independence, constant variance)residuals versus xi (outliers, constant variance) We’ll explore diagnostic plots in more detail in R
Fixed -vs- Random Effects Models In ANOVA and Regression analyses our independent variables canbe treated as Fixed or Random Fixed Effects: variables whose levels are either sampledexhaustively or are the only ones considered relevant to theexperimenter Random Effects: variables whose levels are randomly sampledfrom a large population of levels Example from our recent AJHG paper:Expression Baseline Population Individual Error
2, X 3) Typically will not have enough data to try and directly estimate f Therefore, we usually have to assume that it has some restricted form, such as linear Y X 1 X 2 X 3. Linear Regression is a Probabilistic Model Much of mathematics is devoted to studying variables