Transcription
CJASN ePress. Published on September 22, 2016 as doi: 10.2215/CJN.06210616Special FeatureStatistical Methods for Cohort Studies of CKD:Prediction ModelingJason Roy,*† Haochang Shou,*† Dawei Xie,*† Jesse Y. Hsu,*† Wei Yang,*† Amanda H. Anderson,*† J. Richard Landis,*†Christopher Jepson,*† Jiang He,‡ Kathleen D. Liu,§ Chi-yuan Hsu,§ and Harold I. Feldman*† on behalf of the ChronicRenal Insufficiency Cohort (CRIC) Study InvestigatorsAbstractPrediction models are often developed in and applied to CKD populations. These models can be used to informpatients and clinicians about the potential risks of disease development or progression. With increasingavailability of large datasets from CKD cohorts, there is opportunity to develop better prediction models that willlead to more informed treatment decisions. It is important that prediction modeling be done using appropriatestatistical methods to achieve the highest accuracy, while avoiding overfitting and poor calibration. In this paper,we review prediction modeling methods in general from model building to assessing model performance as well asthe application to new patient populations. Throughout, the methods are illustrated using data from the ChronicRenal Insufficiency Cohort Study.Clin J Am Soc Nephrol : ccc–ccc, 2016. doi: 10.2215/CJN.06210616IntroductionPredictive models and risk assessment tools are intended to influence clinical practice and have been a topicof scientific research for decades. A PubMed search ofprediction model yields over 40,000 papers. In CKD,research has focused on predicting CKD progression(1,2), cardiovascular events (3), and mortality (4–6)among many other outcomes (7). Interest in developingprediction models will continue to grow with theemerging focus on personalized medicine and theavailability of large electronic databases of clinical information. Researchers carrying out prediction modeling studies need to think carefully about design,development, validation, interpretation, and the reporting of results. This methodologic review article willdiscuss these key aspects of prediction modeling. Weillustrate the concepts using an example from theChronic Renal Insufficiency Cohort (CRIC) Study (8,9)as described below.Motivating Example: Prediction of CKDProgressionThe motivating example focuses on the developmentof prediction models for CKD progression. In additionto the general goal of finding a good prediction model,we explore whether a novel biomarker improves prediction of CKD progression over established predictors.In this case, urine neutrophil gelatinase–associated lipocalin (NGAL) was identified as a potential risk factorfor CKD progression on the basis of a growing literature that showed elevated levels in humans and animals with CKD or kidney injury (2). The question ofinterest was whether baseline urine NGAL would provide additional predictive information beyond the information captured by established predictors.www.cjasn.org Vol , 2016The CRIC Study is a multicenter cohort study ofadults with moderate to advanced CKD. The design andcharacteristics of the CRIC Study have been describedpreviously (8,9). In total, 3386 CRIC Study participantshad valid urine NGAL test data and were included inthe prediction modeling. Details of the procedures forobtaining urine NGAL are provided elsewhere (2,10).Established predictors include sociodemographiccharacteristics (age, sex, race/ethnicity, and education), eGFR (in milliliters per minute per 1.73 m2),proteinuria (in grams per day), systolic BP, bodymass index, history of cardiovascular disease, diabetes, and use of angiotensin–converting enzyme inhibitors/angiotensin II receptor blockers. In thisexample, all were measured at baseline.The outcome was progressive CKD, which wasdefined as a composite end point of incident ESRD orhalving of eGFR from baseline using the Modificationof Diet in Renal Disease Study equation (11). ESRDwas considered to have occurred when a patient underwent kidney transplantation or began chronic dialysis. For the purposes of this paper, in lieu of abroader examination of NGAL that was part of theoriginal reports (2,10), we will on focus on occurrenceof progressive CKD within 2 years from baseline(a yes/no variable).Among the 3386 participants, 10% had progressiveCKD within 2 years. The median value of urine NGALwas 17.2 ng/ml, with an interquartile range of 8.1–39.2 ng/ml. Detailed characteristics of the study population are given in the work by Liu et al. (2).We excluded patients with missing predictors (n 119),leaving a total of 3033 with a valid NGAL measurement,no missing predictors, and an observed outcome. Wemade this decision, because the percentage of missing*Department ofBiostatistics andEpidemiology and†Center for ClinicalEpidemiology andBiostatistics, PerelmanSchool of Medicine,University ment ofEpidemiology, TulaneUniversity, NewOrleans, Louisiana;§Department ofMedicine, Universityof California, SanFrancisco, California;and Division ofResearch, KaiserPermanente NorthernCalifornia, Oakland,CaliforniaCorrespondence: Dr.Jason Roy,Department ofBiostatistics andEpidemiology,Perelman School ofMedicine, Universityof Pennsylvania, 632Blockley Hall, 423Guardian Drive,Philadelphia, PA19104. Email: jaroy@upenn.eduCopyright 2016 by the American Society of Nephrology1
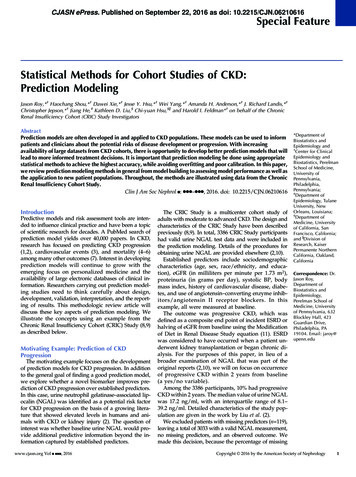
2Clinical Journal of the American Society of Nephrologydata was low, the characteristics of those with observedand missing data were similar (data not shown), and wewanted to focus on prediction and not missing data issues.In practice, however, multiple imputation is generally recommended for handling missing predictors (12,13).Prediction ModelsIt is important to distinguish between two major types ofmodeling that are found in medical research—associativemodeling and prediction modeling. In associative modeling, the goal is typically to identify population-level relationships between independent variables (e.g., exposures)and dependent variables (e.g., clinical outcomes). Although associative modeling does not necessarily establishcausal relationships, it is often used in an effort to improveour understanding of the mechanisms through which outcomes occur. In prediction modeling, by contrast, the goalis typically to generate the best possible estimate of thevalue of the outcome variable for each individual. Thesemodels are often developed for use in clinical settings tohelp inform treatment decisions.Prediction models use data from current patients forwhom both outcomes and predictors are available to learnabout the relationship between the predictors and outcomes. The models can then be applied to new patients forwhom only predictors are available—to make educatedguesses about what their future outcome will be. Prediction modeling as a field involves both the development ofthe models and the evaluation of their performance.In the era of big data, there has been an increased interestin prediction modeling. In fact, an entire field, machinelearning, is now devoted to developing better algorithmsfor prediction. As a result of so much research activityfocused on prediction, many new algorithms have beendeveloped (14). For continuous outcomes, options includelinear regression, generalized additive models (15), Gaussian process regression (16), regression trees (17), andk-nearest neighbor (18) among others. For binary outcomes, prediction is also known as classification, becausethe goal is to classify an individual into one of two categories on the basis of their set of predictors (features inmachine learning terminology). Popular options for binaryoutcome prediction include logistic regression, classification tree (17), support vector machine (19), and k-nearestneighbor (20). Different machine learning algorithms havevarious strengths and weaknesses, discussion of which isbeyond the scope of this paper. In the CRIC Study example,we use the standard logistic regression model of the binaryoutcome (occurrence of progressive CKD within 2 years).Variable SelectionRegardless of which type of prediction model is used, avariable selection strategy will need to be chosen. If we areinterested in the incremental improvement in predictiondue to a novel biomarker (like urine NGAL), then it isreasonable to start with a set of established predictors andassess what improvement, if any, the biomarker adds to themodel. Variable selection is, therefore, knowledge driven.Alternatively, if the goal is simply to use all availabledata to find the best prediction model, then a data-drivenapproach can be applied. Data-driven methods aretypically automated—the researcher provides a list of alarge set of possible predictors, and the method will selectfrom that a shorter list of predictors to include in a finalmodel. Data-driven methods include criterion methods,such as maximizing Bayesian information criterion (21), regularization methods, such as Lasso (22), and dimension reduction methods, such as principal components analysis(23), when there is a large set of predictors. Which type ofvariable selection approach to use depends on the purposeof the prediction model and its envisioned use in clinicalpractice. For example, if portability is a goal, then restrictingto commonly collected variables might be important.Performance EvaluationAfter a model is developed, it is important to quantify howwell it performs. In this section, we describe several methodsfor assessing performance. Our emphasis is on performancemetrics for binary outcomes (classification problems); someof the metrics can be used for continuous outcomes as well.Typically, a prediction model for a binary outcomeproduces a risk score for each individual, denoting theirpredicted risk of experiencing the outcome given theirobserved values on the predictor variables. For example,logistic regression yields a risk score, which is the log odds(logit) of the predicted probability of an individual experiencing the outcome of interest. A good prediction modelfor a binary outcome should lead to good discrimination (i.e., good separation in risk scores between individuals whowill, in fact, develop the outcome and those who will not).Consider the CRIC Study example. We fitted three logisticregression models of progressive CKD (within 2 yearsfrom baseline). The first included only age, sex, and raceas predictors. The second model also included eGFR andproteinuria. Finally, the third model also included otherestablished predictors: angiotensin–converting enzyme inhibitor/angiotensin II receptor blocker, an indicator forany history of cardiovascular disease, diabetes, educational level, systolic BP, and body mass index. In Figure1, the risk scores from each of the logistic regression models are plotted against the observed outcome. The plotsshow that, as more predictors were added to the model,the separation in risk scores between participants who didor did not experience the progressive CKD outcome increased. In model 1, for example, the distribution of therisk score was very similar for both groups. However, inmodel 3, those not experiencing progressive CKD tendedto have much lower risk scores than those who did.Sensitivity and SpecificityOn the basis of the risk score, we can classify patients ashigh or low risk by choosing some threshold, values abovewhich are considered high risk. A good prediction modeltends to classify those who will, in fact, develop the outcomeas high risk and those who will not as low risk. Thus, we candescribe the performance of a test using sensitivity, theprobability that a patient who will develop the outcome isclassified as high risk, and specificity, the probability that apatient who will not develop the outcome is classified as lowrisk (24).In the CRIC Study example, we focus on the model thatincluded all of the established predictors. To obtain
Clin J Am Soc Nephrol : ccc–ccc, , 2016Prediction Modeling in CKD, Roy et al.3Figure 1. Plot of risk score against CKD progression within 2 years in the Chronic Renal Insufficiency Cohort (CRIC) Study data. The plotsare for three different models, with increasing numbers of established predictors included from left to right. The risk score is log odds (logit) ofthe predicted probability. The outcome, progressive CKD (1 yes, 0 no), is jittered in the plots to make the points easier to see. ACE/ARB,angiotensin-converting enzyme/angiotensin II receptor blocker; BMI, body mass index; CVD, cardiovascular disease; diab., diabetes; educ.,education; SBP, systolic BP.sensitivity and specificity, we need to pick a threshold riskscore, above which patients are classified as high risk. Figure2 illustrates the idea using two risk score thresholds—a lowvalue that leads to high sensitivity (96%) but moderate specificity (50%) and a high value that leads to lower sensitivity(43%) but a high specificity (98%). Thus, from the samemodel, one could have a classification that is highly sensitive(patients who will go on to CKD progression almost alwaysscreen positive) and moderately specific (only one half ofpatients who will not go on to CKD progression will screennegative) or one that is highly specific but only moderatelysensitive.Receiver Operating Characteristic Curves and c StatisticBy changing the classification threshold, one can chooseto increase sensitivity at the cost of decreased specificity orvice versa. For a given prediction model, there is no way toincrease both simultaneously. However, both potentiallycan be increased if the prediction model itself is improved(e.g., by adding an important new variable to the model).Thus, sensitivity and specificity can be useful for comparing models. However, one model might seem better thanthe other at one classification threshold and worse than theother at a different threshold. We would like to compareprediction models in a way that is not dependent on thechoice of risk threshold.Receiver operating characteristic (ROC) curves displaysensitivity and specificity over the entire range of possibleclassification thresholds. Consider again Figure 2. By usingtwo different thresholds, we had two different pairs ofvalues of sensitivity and specificity. We could choose dozens or more additional thresholds and record equallymany pairs of sensitivity and specificity data points. Thesedata points can be used to construct ROC curves. InFigure 2. Plots of progressive CKD within 2 years by risk score from the model with all established predictors. The plot in the left panel is onthe basis of a risk score cutoff of 24, and the plot in the right panel uses a cutoff of zero. The vertical line separates (left panel) low- and (rightpanel) high-risk patients. The horizontal line separates the groups with and without progressive CKD (1 yes, 0 no). By counting the number ofsubjects in each of the quadrants, we obtain a standard 232 table. For example, using the cutoff of 24, there were 12 patients who wereclassified as low risk and ended up with CKD progression within 2 years. The sensitivity of this classification approach can be estimated bytaking the number of true positives (294) and dividing by the total number of high-risk patients (294 12 306). Thus, sensitivity is 96%. Similarcalculations can be used to find the specificity of 50%. Given the same prediction model, a different classification cutpoint could be chosen. In theplot in the right panel, in which a risk score of zero is chosen as the cutpoint, sensitivity decreases to 43%, whereas specificity increases to 98%.
4Clinical Journal of the American Society of Nephrologyparticular, ROC curves are plots of true positive rate (sensitivity) on the vertical axis against the false positive rate(12 specificity) on the horizontal axis. Theoretically, theperfect prediction model would simply be representedby a horizontal line at 100% (perfect true positive rate,regardless of threshold). A 45 line represents a predictionmodel equivalent to random guessing.One way to summarize the information in an ROC curveis with the area under the curve (AUC). This is also known asthe c statistic (25). A perfect model would have a c statisticof one, which is the upper bound of the c statistic, whereasthe random guessing model would have a c statistic of 0.5.Thus, one way to compare prediction models is with thec statistic—larger values being better. The c statistic also hasanother interpretation. Given a randomly selected caseand a randomly selected control (in the CRIC Studyexample, a CKD progressor and a nonprogressor), the probability that the risk score is higher for the case than for thecontrol is equal to the value of the c statistic (26).In Figure 3A, the ROC curve is displayed from a prediction model that includes urine NGAL as the only predictor variable. The c statistic for this model is 0.8. If ourgoal was simply to determine whether urine NGAL hasprognostic value for CKD progression, the answer wouldbe yes. If, however, we were interested in the incrementalvalue of the biomarker beyond established predictors, wewould need to take additional steps. In Figure 3B, we compare ROC curves derived from two prediction models—one including only demographics and the other includingdemographics plus urine NGAL. From Figure 3B, we cansee that the ROC curve for the model with NGAL (redcurve in Figure 3B) (AUC 0.82) dominates (is above) theone without NGAL (blue curve in Figure 3B) (AUC 0.69).The c statistic for the model with urine NGAL is larger by0.13. Thus, there seems to be incremental improvementover a model with demographic variables alone. However,the primary research question in the work by Liu et al. (2)was whether NGAL had prediction value beyond that ofestablished predictors, which include additional factorsbeyond demographics. The blue curve in Figure 3C isthe ROC curve for the model that included all of the established predictors. That model had a c statistic of 0.9—avery large value for a prediction model. When NGAL isadded to this logistic regression model, the resulting ROCcurve is the red curve in Figure 3C. These two curves arenearly indistinguishable and have the same c statistic (totwo decimal places). Therefore, on the basis of this metric,urine NGAL does not add prediction value beyond established predictors. It is worth noting that urine NGALwas a statistically significant predictor in the full model(P,0.01), which illustrates the point that statistical significance does not necessarily imply added prediction value.It is also important to consider uncertainty in theestimate of the ROC curve and c statistic. Confidencebands for the ROC curve and confidence intervals for thec statistic can be obtained from available software. Forcomparing two models, a confidence interval for the difference in c statistics could be obtained via, for example,nonparametric bootstrap resampling (27). However, thiswill generally be less powerful than the standard chi–squared test for comparing two models (28).A limitation of comparing models on the basis of the cstatistic is that it tends to be insensitive to improvements inprediction that occur when a new predictor (such as a novelbiomarker) is added to a model that already has a high cstatistic (29–31). It also should not be used without additionally assessing calibration, which we next briefly describe.CalibrationA well calibrated model is one for which predictedprobabilities closely match the observed rates of the outcomeover the range of predicted values. A poorly calibrated modelmight perform well overall on the basis of measures, like the cstatistic, but would perform poorly for some subpopulations.Calibration can be checked in a variety of ways. Astandard method is the Hosmer–Lemeshow test, whereFigure 3. Receiver operating characteristics (ROC) curves for three different prediction models. A is the ROC curve when urine neutrophilgelatinase–associated lipocalin (NGAL) is the only predictor variable included in the model. The c statistic is 0.8. B and C each include twoROC curves. In B, the blue curve (area under the curve [AUC] 0.69) is from the model that includes only demographic variables. The red curve(AUC 0.82) additionally includes urine NGAL. In C, the blue curve is for the model that includes all established predictors. The red curveincludes all established predictors plus urine NGAL. The c statistics in C are both 0.9. This plots show that urine NGAL is a relatively goodpredictor variable alone and has incremental improvement over the demographics-only model but does not help to improve prediction beyondestablished predictors.
Clin J Am Soc Nephrol : ccc–ccc, , 2016predicted and observed counts within percentiles of predicted probabilities are compared (32). In the CRIC Study example with the full model (including NGAL), the Hosmer–Lemeshow test on the basis of deciles of the predicted probabilities has a P value of 0.14. Rejection of the test (P,0.05)would suggest a poor fit (poor calibration), but that is notthe case here. Another useful method is calibration plots. Inthis method, rather than obtaining observed and expectedrates within percentiles, observed and expected rates areestimated using smoothing methods. Figure 4 displays acalibration plot for the CRIC Study example, with established predictors and urine NGAL included in the model.The plot suggests that the model is well calibrated, becausethe observed and predicted values tend to fall near the 45 line.Brier ScoreA measure that takes into account both calibration anddiscrimination is the Brier score (33,34). We can estimatethe Brier score for a model by simply taking the averagesquared difference between the actual binary outcomeand the predicted probability of that outcome for eachindividual. A low value of this metric indicates a modelthat performs well across the range of risk scores. Theperfect model would have a Brier score of zero. The difference in this score between two models can be used tocompare the models. In the CRIC Study example, the Brierscores were 0.087, 0.075, 0.057, and 0.056 for the demographics-only, demographics plus NGAL, established predictors, and established predictors plus NGAL models,respectively. Thus, there was improvement in addingNGAL to the demographics model (Brier score differenceof 0.012—a 14% improvement). There was also improvement by moving from the demographics-only model tothe established predictors model (Brier score differenceof 0.020). However, adding NGAL to the established predictors model only decreased the Brier score by 0.001 (a2% improvement). Although how big of a changeconstitutes a meaningful improvement is subjective, animprovement in Brier score of at least 10% would beFigure 4. Calibration plot for the model that includes establishedpredictors and urine neutrophil gelatinase–associated lipocalin. Thestraight line is where a perfectly calibrated model would fall. Thecurve is the estimated relationship between the predicted and observed values. The shaded region is 62 SEMs.Prediction Modeling in CKD, Roy et al.5difficult to dismiss, whereas a 2% improvement does notseem as convincing.Net Reclassification Improvement and IntegratedDiscrimination ImprovementPencina et al. (35,36) developed several new methods forassessing the incremental improvement of prediction dueto a new biomarker. These include net reclassification improvement (NRI), both categorical and category free, andintegrated discrimination improvement. These methodsare reviewed in detail in a previous Clinical Journal of theAmerican Society of Nephrology paper (37), and therefore,here we briefly illustrate the main idea of just one of themethods (categorical NRI).The categorical NRI approach assesses the change inpredictive performance that results from adding one ormore predictors to a model by comparing how the twomodels classify participants into risk categories. In thisapproach, therefore, we begin by defining risk categories aswe did when calculating specificity and sensitivity—that is,we choose cutpoints of risk for the outcome variable thatdefine categories of lower and higher risks. NRI is calculated separately for the group experiencing the outcomeevent (those with progressive CKD within 2 years in theCRIC Study example) and the group not experiencing theevent. To calculate NRI, study participants are assigned ascore of zero if they were not reclassified (i.e., if both models place the participant in the same risk category), a scoreof one if they were reclassified in the right direction, and ascore of 21 if they were reclassified in the wrong direction.An example of the right direction is a participant who experienced an event who was classified as low risk underthe old model but classified as high risk under the newmodel. Within each of the two groups, NRI is calculatedas the sum of scores across all patients in the group dividedby the total number of patients in the group. These NRIscores are bounded between 21 and one, with a score ofzero implying no difference in classification accuracy between the models, a negative score indicating worse performance by the new model, and a positive score showingimproved performance. The larger the score, the better thenew model classified participants compared with the oldmodel on the basis of this criterion.We will now consider a three–category classificationmodel, where participants were classified as low risk iftheir predicted probability was ,0.05, medium risk if itwas between 0.05 and 0.10, and high risk if it was above0.10. These cutpoints were chosen a priori on the basis ofwhat the investigators considered to be clinically meaningful differences in the event rate (2). The results for thecomparison of the demographics-only model with the demographics and urine NGAL model are given in Figure 5,left panel. The NRIs for events and nonevents were 3.6%(95% confidence interval, 23.3% to 9.2%) and 33% (95%confidence interval, 30.8% to 35.8%), respectively. Thus,there was large improvement in risk prediction for nonevents when going from the demographics-only model tothe demographics and NGAL model. Next, we comparedthe model with all established predictors with the samemodel with urine NGAL as an additional predictor. Thereclassification data are given in Figure 5, right panel.Overall, there was little reclassification for both events
6Clinical Journal of the American Society of Nephrologyand nonevents, indicating no discernible improvement inprediction when NGAL was added to the established predictors model, which is consistent with the c statistic andBrier score findings described above.The categorical NRI depends on classification cutpoints.There is a category-free version of NRI that avoids actualclassification when assessing the models. Although NRIhas practical interpretations, there is concern that it can bebiased when the null is true (when a new biomarker is notactually predictive) (38,39). In particular, for poorly fittingmodels (especially poorly calibrated models), NRI tends tobe inflated, making the new biomarker seem to add morepredictive value than it actually does. As a result, biascorrected methods have been proposed (40). In general,however, it is not recommended to quantify incrementalimprovement by NRI alone.Decision AnalysesThe methods discussed above tend to treat sensitivity andspecificity as equally important. However, in clinical practice, the relative cost of each will vary. An approach thatallows one to compare models after assigning weights tothese tradeoffs is decision analysis (41,42). That is, given therelative weight of a false positive versus a false negative, thenet benefit of one model over another can be calculated. Adecision curve can be used to allow different individualswho have different preferences to make informed decisions.Continuous or Survival OutcomesWe have focused our CRIC Study example primarilyon a binary outcome thus far (classification problems).However, most of the principles described above apply tocontinuous or survival data. Indeed, some of the samemodel assessment tools can also be applied. For example,for censored survival data, methods have been developedto estimate the c statistic (29,43–45). For continuous outcomes, plots of predicted versus observed outcome andmeasures, such as R2, can be useful. Calibration methodsfor survival outcomes have been described in detail elsewhere but are generally straightforward to implement(46).ValidationInternalA prediction model has good internal validity or reproducibility if it performs as expected on the populationfrom which it was derived. In general, we expect that theperformance of a prediction model will be overestimatedif it is assessed on the same sample from which itwas developed. That is, overfitting is a major concern. Amethod that assesses internal validation or one that avoidsoverfitting should be used. Split samples (training and testdata) can be used to avoid overestimation of performance.Alternatively, methods, such as bootstrapping and crossvalidation, can be used at the model development phase toavoid overfitting (47,48).ExternalExternal validity or transportability is the ability totranslate a model to different populations. We expect theperformance of a model to degrade when it is evaluated inFigure 5. Classification of patients in the event and nonevent groups in models with and without urine neutrophil gelatinase–associatedlipocalin (NGAL). The counts in red are from patients who were reclassified in the wrong direction. The left panel shows the reclassification thatoccurs when urine NGAL is added to a model that includes only demographics. For events, 3 8 37 48 were reclassified in the right direction,whereas 16 16 5 37 were reclassified in the wrong direction. The net reclassification improvement (NRI) for events was (48/306)2(37/306) 3.6%. The NRI for nonevents was (1153/2727)2(243/2727) 33%. Thus, there was large improvement in risk prediction for nonevents whengoing from the demographics-only model to demographics and NGAL m
focused on prediction, many new algorithms have been developed (14). For continuous outcomes, options include linear regression, generalized additive models (15), Gauss-ian process regression (16), regression trees (17), and k-nearest neighbor (18) among others. For binary out-comes, pr