Transcription
Morbidity & Mortality Chart Bookchart bookchart bookchart bookMor bidit y &chartchart booFact BookMor t a lit y:2 0Fiscal1 2 ChaYearr t Bookon2006Ca r diova s cula r,Lung, a nd BloodDis e a s e sbookchart bookchart bookNHLBI 20122011 M&M Chart Book Covers.indd 1chart bookN a t i o n a lN a t i o n a lIn s t i t u t e sH e a r t ,L u n g ,a n do fB l o o dH e a l t hIn s t i t u t e1/3/2012 9:55:41 AM
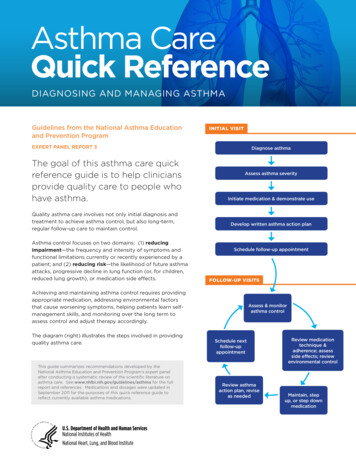
The bar graph on the front cover depictsthe four leading causes of death in 2008:HEART DISEASE, cancer, COPD ANDALLIED CONDITIONS, and STROKE.2011 M&M Chart Book Covers.indd 2Dis c r im in atio n Pro h ib ite d :Un d e r p rov is io n s o f appl ic ab l epu b l ic l aws e n ac te d byC o n g re s s s in c e 1 9 6 4 , n o p e r s o nin th e Un ite d State s s h al l ,o n th e g ro u n d s o f rac e , c o l o r,n atio n al o r ig in , h an d ic ap, o rag e , b e e xc l u d e d f ro m par tic ipatio n in , b e d e n ie d th eb e n e f its o f , o r b e s u b j e c te dto d is c r im in atio n u n d e r an ypro g ram o r ac tiv ity ( o r, o nth e b as is o f s e x , with re s pe c tto an y e d u c atio n pro g ram o rac tiv ity) re c e iv in g Fe d e ralf in an c ial as s is tan c e . In ad d itio n , Exe c u tive Ord e r 1 1 1 4 1pro h ib its d is c r im in atio n o n th eb as is o f ag e by c o n trac to r s an d s u b c o n trac to r s in th e pe r f o r m an c e o f Fe d e ral c o n trac ts ,an d Exe c u tive Ord e r 1 1 2 4 6s tate s th at n o f e d e ral l y f u n d e dc o n trac to r m ay d is c r im in ateag ain s t an y e m pl oye e o r appl ic an t f o r e m pl oym e n t b e c au s eo f rac e , c o l o r, re l ig io n , s e x , o rn atio n al o r ig in . T h e re f o re ,th e He ar t, Lu n g , an d Bl o o dIn s titu te m u s t b e o pe rate d inc o m pl ian c e with th e s e l awsan d Exe c u tive Ord e r s .1/3/2012 9:55:41 AM
ForewordThe mission of the National Heart, Lung, and BloodInstitute (NHLBI) is to provide leadership and support for research in cardiovascular, lung, and blooddiseases; sleep disorders; women’s health; and bloodresources. The ultimate goal is to improve the healthand well-being of the American people. Although program priorities are determined primarily by researchopportunities, other factors have an influence: themagnitude, distribution, and trends of cardiovascular,lung, and blood diseases in the United States, as wellas the ability to improve the Nation’s health; congressional mandates; the health needs of the Nation, as perceived by Institute staff and outside advisory groups;and recommendations from the National Heart, Lung,and Blood Advisory Council.Evaluation of the Institutes program balance andprogram impact is a continuous process that relies onassessments of morbidity and mortality in the UnitedStates from cardiovascular, lung, and blood diseases.Consideration is given to their distribution among thepopulation; to their trends over time; and to relatedstatistics on population risk factors, lifestyles, medicalcare, and economic impact.This Chart Book, like its predecessors, providesinformation on the progress being made in the fightagainst cardiovascular, lung, and blood diseases. Itserves as a resource for the Institute as it plans and prioritizes future activities.I would like to express my appreciation toDr. Michael Mussolino of the NHLBI for his timeand effort in developing the material presented in thisChart Book.Also, I would like to acknowledge Ms. Nancy Engof the NHLBI who has for many years demonstratedextraordinary dedication to ensuring the quality ofboth the Chart Book and the NHLBI Fact Book.Susan B. Shurin, M.D.Acting DirectorNational Heart, Lung, and Blood Instituteiii
ContentsList of Charts. vii.1. Introduction. 1Sources of Data. 1Quality of Data. 2ICD Revisions. 3Data Presentation. 32. Background Data. 5Cardiovascular Diseases. 5Lung Diseases. 5Blood Diseases. 5Population. 53. Cardiovascular Diseases. 19Coronary Heart Disease. 19Heart Failure. 19Cardiomyopathy. 19Atrial Fibrillation. 19Cerebrovascular Diseases (Stroke). 19Hypertensive Disease. 19Peripheral Artery Disease. 20Congenital Malformations of the Circulatory System. 204. Lung Diseases. 59Chronic Obstructive Pulmonary Disease. 59Asthma. 595. Blood Diseases. 79Appendices. 85Appendix A. International Classification of Diseases: Codes for Selected DiagnosticCategories (6th, 7th, 8th, 9th, and 10th Revisions). 87Appendix B. Estimated Comparability Ratios for Selected Causes of Death, U.S. 89Appendix C. Definition of Terms. 91Appendix D. Abbreviations. 93Appendix E. References. 95v
List of Charts2. Background Data2–1Total Population by Mean Age, Percent Age 65 and Older, Race/Ethnicity, and Sex,U.S., 2009 . 62–2Total Projected Population by Mean Age, Percent Age 65 and Older, Race/Ethnicity,and Sex, U.S., 2020 . 62–3Average Remaining Lifetime Years by Age, Race, and Sex, U.S., 2008 . 62–4Age-Adjusted Death Rates for All Causes by Race and Sex, U.S., 1950–2008 . 72–5Unadjusted Death Rates for Selected Causes, U.S., 1950–2008. 72–6Number of Days of Inpatient Hospital Care by Major Diagnosis, U.S., 1990–2009 . 8.2–7Age-Adjusted Death Rates by Major Diagnosis, U.S., 1990–2008 . 82–8Leading Causes of Death, U.S., 2008. 92–9Leading Causes of Death by Age and Rank, U.S., 2008. 92–10Leading Causes of Death, White Males, U.S., 2008. 102–11Leading Causes of Death, White Females, U.S., 2008. 102–12Leading Causes of Death, Black Males, U.S., 2008.112–13Leading Causes of Death, Black Females, U.S., 2008.112–14Leading Causes of Death, Asian Males, U.S., 2008. 122–15Leading Causes of Death, Asian Females, U.S., 2008. 122–16Leading Causes of Death, Hispanic Males, U.S., 2008. 132–17Leading Causes of Death, Hispanic Females, U.S., 2008. 132–18Leading Causes of Death, American Indian Males, U.S., 2008. 142–19Leading Causes of Death, American Indian Females, U.S., 2008. 142–20Prevalence of Leading Chronic Conditions Causing Limitation of Activity, U.S., 2010. 152–21Age-Adjusted Percent of Population Currently Smoking by Race and Sex, Ages 18and Older, U.S., 1965–2010. 152–22Age-Adjusted Percent of Population With High Serum Cholesterol by Race and Sex,Ages 20–74, U.S., 1976–1980 to 2005–2008. 162–23Age-Adjusted Percent of Population That Is Overweight by Race and Sex, Ages 20–74,U.S., 1976–1980 to 2005–2008. 162–24Economic Cost of Cardiovascular, Lung, and Blood Diseases, U.S., 2008. 172–25Direct Cost of Cardiovascular, Lung, and Blood Diseases, U.S., 2008. 173. Cardiovascular Diseases3–1Deaths From Cardiovascular Diseases, Percent by Subgroup, U.S., 2008. 213–2Deaths From Heart Disease, Percent by Subgroup, U.S., 2008. 21vii
3–3Deaths From Stroke, Percent by Subgroup, U.S., 2008. 213–4Number of Hospitalizations, Physician Office Visits, and Deaths for CardiovascularDiseases, U.S., 2008–2009. 223–5Change in Age-Adjusted Death Rates for Cardiovascular and Non-CardiovascularDiseases, U.S., 1950–2008. 233–6Age-Adjusted Death Rates and Percent Change for All Causes and CardiovascularDiseases, U.S., 1968 and 2008. 233–7Average Annual Percent Change in Age-Adjusted Death Rates for All Causes andCardiovascular Diseases, U.S., 1968–2008. 243–8Average Annual Percent Change in Age-Adjusted Death Rates for All Causes andCardiovascular Diseases by Race and Sex, U.S., 1999–2008. 243–9Deaths and Age-Adjusted Death Rates for Cardiovascular Diseases, U.S., 1979–2008. 253–10Percent of All Deaths Due to Cardiovascular Diseases by Age, U.S., 2008. 253–11Age-Adjusted Death Rates for Cardiovascular Diseases by State, U.S., 2005–2007. 263–12Percent Decline in Age-Adjusted Death Rates for Cardiovascular Diseases by State,U.S., 1996–1998 to 2005–2007. 263–13Age-Adjusted Death Rates for Heart Disease by Race/Ethnicity and Sex, U.S., 2008. 273–14Death Rates for Heart Disease in Males by Age and Race/Ethnicity, U.S., 2008. 273–15Death Rates for Heart Disease in Females by Age and Race/Ethnicity, U.S., 2008. 283–16Age-Adjusted Prevalence of Acute Myocardial Infarction by Race and Sex,Ages 25–74, U.S., 1971–1975 to 2005–2008. 283–17Prevalence of Acute Myocardial Infarction by Age and Sex, U.S., 1999–2008. 293–18Prevalence of Acute Myocardial Infarction by Age and Race, U.S., 1999–2008. 293–19Prevalence of Angina Pectoris by Age and Sex, U.S., 2001–2008. 303–20Prevalence of Angina Pectoris by Age and Race, U.S., 2001–2008. 303–21Emergency Department Visit Rates for Coronary Heart Disease by Sex, U.S.,1997–1999 to 2006–2008. 313–22Hospitalization Rates for Acute Myocardial Infarction, Ages 45–64 and 65 and Older,U.S., 1965–2009. 313–23Hospital Case-Fatality Rates for Acute Myocardial Infarction, Ages Younger Than 65and 65 and Older, U.S., 1970–2009. 323–24Age-Adjusted Death Rates for Coronary Heart Disease, Actual and Expected, U.S.,1950–2008. 323–25Age-Adjusted Death Rates for Coronary Heart Disease by Race/Ethnicity and Sex,U.S., 1999–2008. 333–26Age-Adjusted Death Rates for Coronary Heart Disease by Race and Sex, U.S.,1950–2008. 333–27Deaths and Age-Adjusted Death Rates for Coronary Heart Disease, U.S., 1980–2008. 343–28Average Annual Percent Change in Age-Adjusted Death Rates for Coronary HeartDisease by Race and Sex, U.S., 1950–2008. 34viii
3–29Average Annual Percent Change in Death Rates for Coronary Heart Disease by Age,Race, and Sex, U.S., 1999–2008. 353–30Age-Adjusted Death Rates for Coronary Heart Disease by Race/Ethnicity and Sex,U.S., 2008. 353–31Death Rates for Coronary Heart Disease in Males by Age and Race/Ethnicity,U.S., 2008. 363–32Death Rates for Coronary Heart Disease in Females by Age and Race/Ethnicity,U.S., 2008. 363–33Age-Adjusted Death Rates for Coronary Heart Disease by State, U.S., 2005–2007. 373–34Age-Adjusted Death Rates for Coronary Heart Disease by Country and Sex,Ages 35–74, 2006–2009. 373–35Change in Age-Adjusted Death Rates for Coronary Heart Disease in Males byCountry, Ages 35–74, 1999–2009. 383–36Change in Age–Adjusted Death Rates for Coronary Heart Disease in Females byCountry, Ages 35–74, 1999–2009. 383–37Age-Adjusted Prevalence of Heart Failure by Race and Sex, Ages 25–74, U.S.,1988–1994 to 2005–2008. 393–38Hospitalization Rates for Heart Failure, Ages 45–64 and 65 and Older, U.S.,1971–2009. 393–39Hospital Case-Fatality Rates for Heart Failure, Ages 45–64 and 65 and Older,U.S., 1980–2009. 403–40Age-Adjusted Death Rates for Heart Failure as the Underlying Cause by Raceand Sex, U.S., 1981–2008. 403–41Age-Adjusted Death Rates for Any Mention of Heart Failure by Race and Sex,U.S., 1981–2008. 413–42Age-Adjusted Death Rates for Heart Failure as the Underlying Cause byRace/Ethnicity and Sex, U.S., 2008. 413–43Age-Adjusted Death Rates for Any Mention of Heart Failure by Race/Ethnicityand Sex, U.S., 2008. 423–44Death Rates for Heart Failure as the Underlying Cause by Age, Race, and Sex,U.S., 2008. 423–45Death Rates for Any Mention of Heart Failure by Age, Race, and Sex, U.S., 2008. 433–46Age-Adjusted Death Rates for Cardiomyopathy by Race and Sex, U.S., 2008. 433–47Death Rates for Cardiomyopathy by Age, Race, and Sex, U.S., 2008. 443–48Hospitalizations for Atrial Fibrillation by Primary and Secondary Diagnosis,U.S., 1982–2009. 443–49Hospitalization Rates for Atrial Fibrillation by Age, U.S., 1982–2009. 453–50Age-Adjusted Prevalence of Stroke by Race and Sex, Ages 25–74, U.S.,1971–1975 to 2005–2008. 453–51Prevalence of Stroke by Age and Sex, U.S., 1999–2008. 463–52Prevalence of Stroke by Age and Race, U.S., 1999–2008. 46ix
3–53Emergency Department Visit Rates for Stroke by Age, U.S., 1997–1999to 2006–2008. 473–54Hospitalization Rates for Stroke, Ages 45–64 and 65 and Older, U.S.,1971–2009. 473–55Hospital Case-Fatality Rate for Stroke, Ages Younger Than 65 and 65and Older, U.S., 1971–2009. 483–56Age-Adjusted Death Rates for Stroke by Race and Sex, U.S., 1950–2008. 483–57Deaths and Age-Adjusted Death Rates for Stroke, U.S., 1979–2008. 493–58Age-Adjusted Death Rates for Stroke by Race/Ethnicity and Sex, U.S.,1999–2008. 493–59Average Annual Percent Change in Age-Adjusted Death Rates for Strokeby Race and Sex, U.S., 1960–2008. 503–60Age-Adjusted Death Rates for Stroke by Race/Ethnicity and Sex, U.S., 2008. 503–61Death Rates for Stroke in Males by Age and Race/Ethnicity, U.S., 2008. 513–62Death Rates for Stroke in Females by Age and Race/Ethnicity, U.S., 2008. 513–63Age-Adjusted Death Rates for Stroke by State, U.S., 2005–2007. 523–64Age-Adjusted Death Rates for Stroke by Country and Sex, Ages 35–74,2006–2009. 523–65Change in Age-Adjusted Death Rates for Stroke in Males by Country,Ages 35–74, 1999–2009. 533–66Change in Age-Adjusted Death Rates for Stroke in Females by Country,Ages 35–74, 1999–2009. 533–67Prevalence of Hypertension and Prehypertension by Age, U.S., 1999–2008. 543–68Age-Adjusted Prevalence of Hypertension by Race/Ethnicity and Sex,Ages 20–74, U.S., 1999–2008. 543–69Age-Adjusted Prevalence of Hypertension by Race/Ethnicity and Sex,Ages 20–74, U.S., 1976–1980 to 2005–2008. 553–70Hypertensive Population Aware, Treated, and Controlled, Ages 18–74,U.S., 1971–1974 to 2005–2008. 553–71Hypertensive Population Aware, Treated, and Controlled, Ages 18–74,U.S., 1976–1980 to 2005–2008. 563–72Emergency Department Visits Rate for Hypertension by Age, U.S.,1997–1999 to 2006–2008. 563–73Age-Adjusted Death Rates for Diseases of the Arteries by Race and Sex,U.S., 2008. 573–74Death Rates for Diseases of the Arteries by Age, Race, and Sex, U.S., 2008. 573–75Percent of Deaths From Congenital Malformations of the CirculatorySystem, Age Under 1, U.S., 1940–2008. 583–76Infant Mortality From Congenital Malformations of the CirculatorySystem by Race, U.S., 1970–2008. 58x
4. Lung Diseases4–1Deaths From Lung Diseases, Percent by Subgroup, U.S., 2008. 594–2Number of Hospitalizations, Physician Office Visits, and Deaths for LungDiseases, U.S., 2008–2009. 604–3Age-Adjusted Death Rates for Lung Diseases by Race and Sex, U.S., 2008. 614–4Death Rates for Lung Diseases by Age, Race, and Sex, U.S., 2008. 614–5Prevalence of Chronic Obstructive Pulmonary Disease by Age, U.S., 1997–2010. 624–6Prevalence of Chronic Obstructive Pulmonary Disease by Age, Race, and Sex,U.S., 2010. 624–7Hospitalization Rates for Chronic Obstructive Pulmonary Disease, Ages 45–64and 65 and Older, U.S., 1995–2009 . 634–8Age-Adjusted Death Rates for Chronic Obstructive Pulmonary Disease by Raceand Sex, U.S., 1960–2008. 634–9Age-Adjusted Death Rates for Chronic Obstructive Pulmonary Disease byRace/Ethnicity and Sex, U.S., 1999–2008. 644–10Death Rates for Chronic Obstructive Pulmonary Disease in White Males by Age,U.S., 1960–2008. 644–11Death Rates for Chronic Obstructive Pulmonary Disease in Black Males by Age,U.S., 1960–2008. 654–12Death Rates for Chronic Obstructive Pulmonary Disease in White Females by Age,U.S., 1960–2008. 654–13Death Rates for Chronic Obstructive Pulmonary Disease in Black Females by Age,U.S., 1960–2008. 664–14Age-Adjusted Death Rates for Chronic Obstructive Pulmonary Disease by State,U.S., 2005–2007. 664–15Age-Adjusted Death Rates for Chronic Obstructive Pulmonary Disease by Countryand Sex, Ages 35–74, 2006–2009. 674–16Age-Adjusted Death Rates for Chronic Obstructive Pulmonary Disease byRace/Ethnicity and Sex, U.S., 2008.
iii The mission of the National Heart, Lung, and Blood Institute (NHLBI) is to provide leadership and sup-port for research in cardiovascular, lung, and blood