Transcription
A Game-Theoretical Approach for Designing Market TradingStrategiesGarrison W. Greenwood and Richard TymerskiAbstract— Investors are always looking for good stock markettrading strategies to maximize their profit. Under the technicalschool of thought trading rules are developed by studyinghistorical market data to find trends that investors can exploit.These market trends tend to appear when certain features(narrow range, DOJI, etc.) appear in the historical data.Unfortunately, these features often appear only in partial form,which makes trend analysis challenging.In the paper we co-evolve fuzzy trading rules from markettrend features. We show how fuzzy membership functionsnaturally handle partial form features in historical data. The coevolutionary process is formulated as a zero-sum, competitivegame to match how trading strategies are evaluated by brokerage firms. Our experimental results indicate the co-evolutionaryprocess creates trading rule-bases that produce positive returnswhen evaluated using actual stock market data.I. I NTRODUCTIONThe recent emergence of online trading has made thestock market accessible to small investors. Brokerage firmswork on behalf of investors to purchase quantities of asingle stock. (Investors pay a small fee for every transaction.)Some discount brokerage firms provide little or no investmentadvice, which means it is up to the small investor to comeup with their own investment strategies. Other brokeragefirms do advise investors when to buy or sell stock, butthe underlying strategy is proprietary and for that reason isnot disclosed to outsiders. Strategies are continually refinedbecause markets can be volatile and good strategies that produce high returns tend to attract more investment dollars—and higher commissions for the brokers!There are two schools of thought on developing investmentstrategies. In the fundamental approach decisions aboutbuying, selling or holding a company’s stock arise from acareful analysis of the the company’s books. On the otherhand, in the technical approach studying a company’s pasttrading activity can help predict future stock prices. In thispaper we focus on the technical approach.For decades people have proposed various technical trading rules but the majority of this literature has found that, forthe most part, the investment rules just don’t work. Indeed,one researcher [1] even went so far as to dismiss technicalinvestment rule methods entirely! But the advent of morepowerful and inexpensive computers has promoted new andpowerful data mining methods that can search high frequencymarket data for trading activity patterns. The reported demiseof the technical school of thought was clearly premature.G. Greenwood and R. Tymerski are both with the Electrical & ComputerEngineering Department at Portland State University, Portland, OR 97207–0751 USA (email: 8/ 25.00 2008 IEEEComputational intelligence (CI) offers a variety of usefultechniques for constructing trading rules via technical approaches. For example, Allen and Karjalainen [2] createdtrading rules using genetic programming. The goal was todevelop a function that returns either a ’buy’ or ’sell’ signal.(Decisions to ’hold’ a stock were not implemented.) Thedifference between an excess return1 and a simple buy-andhold strategy2 over a finite training period measures thefitness of a rule. The authors claim their evolved rules hadreduced trading volatility, but their rules do not lead to higherabsolute returns than a buy-and-hold strategy. Not to bedeterred, the authors claim some investors may still find theirrule-base worthwhile.Potvin et. al [3] also tried genetic programming to evolveinvestment rules. Their method was computationally expensive and tended to converge prematurely (no reportedimprovements after 50 generations). They too showed poorerperformance than a buy-and-hold approach, especially in arising market. The authors claim their trading rules were“generally beneficial”, but only when the market is stableor falling.Dourra and Siy [4] used fuzzy logic to create a tradingstrategy. The system inputs were momentum indicators, suchas the rate of change of stock prices over a defined period.Gaussian membership functions and a fuzzy rule-base, handcrafted from expert’s knowledge completed the system. AMamdani fuzzy implication method output a single valuebetween 0 (strong sell) and 100 (strong buy). Their fuzzysystem was evaluated on 3 years of stock prices fromseveral different companies. The investment returns, basedon buy or sell recommendations from the fuzzy system,were exceptionally high—some yielding over 250% returns!However, those returns should come as no real surprise sincethe membership functions were deterministically adjusted tofit the training data. Consequently, the membership functionsused for the Intel Corporation stock were different fromthose used for the General Motors stock. Moreover, the ruleantecedents were very sophisticated—some involved bothconjunctions and disjunctions of fuzzy variables—but theauthors did not say how those rules were derived.Lam [5] also constructed a fuzzy trading rule-base, butthe rule-base was evolved with a genetic algorithm thatselected a subset of rules from a set of 36 pre-defined fuzzy1 A risk-free return is the return of an asset, such as T-bills, with norisk whatsoever. An excess return is the return received over and above arisk-free return.2 In this strategy the investor buys a stock and then holds it for a longtime period, hoping to outlast any market fluctuations.316
rules. The antecedent of each rule was a conjunction ofseveral moving average trends such as daily moving average,weighted moving average and exponential moving average.Other fuzzy rules had antecedents with momentum termssuch as relative strength index, rate-of-change and fast andslow stochastic. The output (consequent) of each rule wasa buy, sell or hold order using the Sugeno method of fuzzyinference. The system outperformed a buy-and-hold strategy,but it is not clear how the system is trained. The author claimsthe system was trained for m days and then applied to tradefor n more days before re-training(?) It was never stated howthe fitness for the m training days relates to the fitness for then trading days. The paper is useful only from the standpointit shows the potential of evolving fuzzy trading rule-bases.In this paper we describe some preliminary work using acoevolutionary algorithm to evolve a family of fuzzy tradingrule-bases, each of which serves as a unique trading strategy.Researchers in the past have evolved just a single population of strategies. What differentiates our work from allprevious evolved rule-base work is we coevolve independentpopulations of strategies under a game-theoretical environment. This approach seems quite natural because of theclose relationship between competitive coevolution and gametheory. Indeed, evolutionary game theory can help explain theunderlying dynamics of coevolutionary algorithms [6]. Froma practical standpoint coevolution makes perfect sense sinceit closely matches how investment firms develop their owninternal strategies. This aspect is discussed further in the nextsection. Experimental results are included to demonstrate ourproposed method.II. W HY U SE G AME T HEORY TO D EVELOP T RADINGS TRATEGIES ?Investment counselors, working for brokerage firms, develop trading strategies for stock market investments. Goodtrading strategies attract more investor dollars while poorstrategies discourage further investments. Each firm internally develops not just one, but a set of investment strategiesto deal with market volatility. For example, the firm will needone strategy to deal with investments in a bull market, wherestock prices generally rise, and another strategy for bearmarkets, where stock prices generally fall. Investment counselors adapt their individual trading strategies based on howwell those strategies perform. The collective strategies fromall of the investment counselors comprises the investmentservices a brokerage firm offers to a potential investor. Thisprocess can be envisioned as an evolving set of strategieswhere fitness is measured by the returns derived by usingthe strategy to make investment decisions.But how does a brokerage firm know if an evolved set ofstrategies is any good? That question illustrates the problemwith evolving a single population of trading rules. Intuitivelystrategies that provide the greatest returns are the mostappealing and would be assigned high fitness. But definingfitness proportional to returns is overly simplistic and mayeven give a false picture of how good a strategy actually is.An example will help illustrate the problem.Suppose two brokerage firms independently evolve a setof investment strategies. Assume the best performing strategyfrom the first brokerage firm consistently yields a 4% returnover a 90-day trading period. If fitness is proportional toreturns, then this strategy, by definition, has the highestfitness. But does a 4% return really qualify as high fitness?The only way to know for certain is to compare that 4%return against what the other brokerage firm can offer. If thebest strategy from the second firm only has a 1.5% return,then 4% is pretty good and should signify high fitness. On theother hand if the second firm can offer a 7% return strategy,then a 4% return does not qualify as high fitness.It is important to differentiate between the relative fitnessand the true fitness of an investment strategy. Relative fitnesscompares returns from strategies within a single brokeragefirm whereas true fitness contrasts returns from strategiesbetween independent firms. Investors compare the returnsachieved by various brokerage firms before deciding where toinvest their money. Hence, true fitness measures the ability toattract investor dollars. Survival, therefore, should depend ontrue fitness rather than relative fitness. The point here is thereis no way to say whether or not a given return constituteshigh fitness unless it is compared against the returns fromcompeting brokerage firms. Consequently, strategies shouldarise from competitive coevolution [7].Stock market investment is naturally expressed as a game.The players are brokerage firms, which independently develop investment strategies. Strategies compete against eachother in the marketplace and receive payoffs in the formof greater or fewer investor dollars depending on how wellthey perform. (Poor strategies lose investments as investorsswitch to better performing strategies.) Hence, stock marketinvestment is essentially a zero-sum game with the strategiesformed through competitive coevolution.NOTE: In some games players make decisionsbased on historical data, which is common knowledge. One of the best examples is the widelystudied minority game [8]. The stock market gameformulated here belongs to this same family ofgames.III. P ROBLEM F ORMULATIONThe objective is to design a strategy for trading shares of asingle stock. Stock price data, recorded over a large numberof consecutive trading days, is available to help develop thestrategy. The strategies are based on finding conditions inmarket historical data that predicts subsequent up-trend days3Appropriate investments (or positions) are taken only on theopen of a predicted trend day and are exited at its close.Four data items were recorded each day: the open shareprice (O), the high (H) and low (L) for the day and the3 In this work we did not attempt to find down-trend days, which wouldrequire a different set of strategies.2008 IEEE Symposium on Computational Intelligence and Games (CIG'08)317
closing share price (C). Two types of trading days are ofinterest:O[ 1] H[0] δ. In both cases 0 δ 10 is userselectable.Definition: (up-trend day)IV. F UZZY S YSTEM D ESIGNO L 0.1(H L)C H 0.2(H L)(1)Definition: (down-trend day)O H 0.1(H L)C L 0.2(H L)(2)Qualitatively, this simply means for an up day the openingprice is close to the day’s low and the closing price is close tothe day’s high. Similarly, for a down-trend day the openingis at or near the high and the close is near or at the low forthe day. An interesting property of trend days—which keeninvestors can exploit—is the high-low differential tends tobe relatively large.Studies have identified several trading data features thatoften proceed up or down-trend days. These features, described below, are defined in terms of O, C, H and L. Todayis indexed with i 0 and previous days are indexed i 1, 2,and so on. O( 1) denotes the next trading day opening price. NRkWith H[i] and L[i] denoting the high and low for thei-th day, the range is defined as R[i] H[i] L[i].NRk exists if today’s range is less than the ranges forthe previous k 1 days. That is,R[0] min(R[1], . . . , R[k 1])(3)NRk days represent volatility contraction, which oftentimes leads to volatility expansion in the form of widerange days. The greater the number of narrow rangedays, the greater the counter reaction in wide rangingdays. DOJIDOJI indicates that the open and close for the tradingday are within some small percentage (x) of each other.A DOJI means the market reflects temporary priceindecision and often signals a major reversal in themarket. DOJI is a predicate function—i.e., it returns 1(TRUE) or 0 (FALSE). It is defined asDOJI (x) 10 O C x · (H L)otherwise(4)Hook dayA hook day occurs when the price opens outside theprevious day’s range and then proceeds to reverse direction, generally indicating a reaction to temporarilyoverbought or oversold market conditions.There are two versions of a hook day. For the up hookday O[ 1] L[0] δ and for the down hook day318Given stock market historical data, it is always possibleto (deterministically) analyze it and mark where any of thefeatures described in the previous section are present. But amore subtle and challenging problem must be dealt with. Therule-base contains a set of fuzzy rules that predict whetherthe next trading day is likely to be a trend day. Investmentdecisions—i.e., whether to buy, sell or hold—are made basedon these predictions. Fuzzy rules are used because crisp rulesare too restrictive. An example will help fix ideas.The crisp rule “if NR7 then . . .” is true if and only ifthe range during the current day R[0] is less than the rangeduring any of the previous six days R[1], R[2] . . . R[6]. Therule won’t be true if even one of the previous ranges is lessthan R[0]. But suppose the inequality is satisfied for say fiveout of the six days, which makes the antecedent almost true?As another example, Nison [9] asked“How do you decide whether a near-DOJI day(that is, where the open and close are very close,but not exact) should be considered a DOJI? Thisis subjective and there are no rigid rules. . .”Fuzzy reasoning can effectively deal with such uncertainties. Crisp rules, which must give either a ’yes’ or a ’no’answer, cannot handle these situations but fuzzy rules canbecause they can also provide fuzzy answers somewhere inbetween a ’yes’ or ’no’.In our approach stock market data is analyzed to determinehow closely it matches the formal definitions of the featuresdescribed in the previous section. Membership functionsreturn a value between 0 and 1 indicating to what degreefeatures are present. The resultant fuzzy variables are thencollected into fuzzy if-then rules, which constitutes the trading rulebase. The outputs of active rules—i.e., rules whoseantecedent are satisfied—are combined into a fuzzy outputvariable. This variable is defuzzified to produce a crisp valueon the unit interval, which the desirability of buying stockon the next trading day.A. Membership FunctionsFuzzification is the process that maps days (D) ontothe unit interval via a membership function µ(D). Moreprecisely, D represents the number of previous days thata particular feature is satisfied. For instance, for the NR7feature D {0, 1, . . . , 6}. Then µ(0) 0 means the NR7definition was not satisfied during any of the six previousdays, µ(6) 1 means the definition was satisfied duringall six previous days (i.e., NR7 is definitely present) and0 µ(D) 1 means NR7 was satisfied for some D 6days. Trapezoidal membership functions are most appropriatefor the most of the features (see Figure 1). NRk2008 IEEE Symposium on Computational Intelligence and Games (CIG'08)
For this feature the equation is slightly different for eachvalue of k. Let µk (x) denote the membership functionfor NRk. Thenµk (x) 0c (x υmin ) 1x υminυmin x υmaxx υmax(5)with parameter values as shown in Table I.k467c1/21/31/3υmin234υmax467TABLE IPARAMETER VALUES FOR NARROW RANGE FEATURESFig. 2.In the above equation x D η where D k isthe number of days where (3) holds and, with R̃ max1 j k R[j],DOJI membership function with ρ 0.1.where x L[0] δ O[ 1] for an up hook day andx O[ 1] δ H[0] for a down hook day.R̃ R[0]R̃Notice that η increases the membership value forsmaller previous day ranges.η Fig. 3.Fig. 1. Membership functions for the features.B. The Fuzzy Rule-BaseDOJIFor this feature the membership function equation is 1 x/ρ 0 x ρµ(x) (6)0otherwisewhere typically ρ [0.05, 0.30). x represents thepercent difference between O and C and ρ representsthe threshold percentage. Hook DayThe formula for this membership function is 02(x 0.5)µ(x) 1x 211 2 x 0x 0Hook day membership function(7)Unfortunately, just detecting the presence or absence ofa single feature is not a very good trend day predictor. Theproblem is to find combinations of features that make a goodtrend day predictor4 .If there are N total features, then there are N total rulesin the rule-base5 . Consider the ruleif x is NR4 then output is up-trend dayThe semantics of this rule is as follows. The term “xis NR4” means ranges for the current and the previousthree days are computed. x represents how many of thosedays meet the NR4 definition. This crisp data value is theargument for the NR4 membership functions which returns4 Certain real parameter values must also be chosen. For example, thepercentage threshold input value is needed for the DOJI feature.5 There would be 2N total rules if both up-trend and down-trend days arepredicted.2008 IEEE Symposium on Computational Intelligence and Games (CIG'08)319
a number between 0 and 1 to give the degree of membershipfor NR4. The output value is the degree of membership foran up-trend day.A singleton fuzzifier is used for the inputs. The set ofpossible outputs isΛ 0.250.50.751.0These output values represent the likelihood an investorwould buy stock because a given fuzzy rule had fired.The fuzzy rule-base is encoded as a matrix M with onecolumn for every λi Λ and one row for every fuzzyrule [10]. Each rule is of the form “if x is feature then yis an up-trend day”. In this work we investigated 5 featuresso M has 5 rows corresponding to, from top to bottom, thefeatures NR4, NR6, NR7, DOJI, and Up Hook Day (withδ 0.5). There are four columns, one for each value in Λ.A typical matrix might look like 0 0.60.50 0 0.33 0.33 0.33 1.00.9 M 0 0.1 0 0.44 0.50.1 0 0.10.20.7where each mij M is a weight. The first row in the abovematrix is thus interpreted as the investor saying If the currentday is the feature NR4, then I think the likelihood of an uptrend day tomorrow is 0.5 or 0.75 (out of 1) with strengths0.6 and 0.5, respectively. Notice the strengths do not haveto sum to 1.0.Rule processing is straightforward. Given the rule-basematrix M , the vector of fuzzy numbersA (µNR4 , µNR6 , µNR7 , µDOJI , µhook )is created by running the training data through the individualmembership functions. A new A vector is created for eachtrading day. For example, on the 50th training day theranges R(47), R(48) and R(49) are computed and µ4 (x) iscomputed using (5). Similarly the other membership functionvalues are determined using (6) and (7). Then A M Bwherebj max min {ai , mij }1 i 5The fuzzy output vector B is then defuzzified to get a crispoutput value indicating the desirability of buying shares ofstock. A center of average defuzzification was used. That is,PNi 1 bi · λi(8)U PNi 1 λiwhere λi is the i-th singleton from Λ and N is the numberof active rules.The crisp output U [0, 1] indicates the likelihood of anup-trend day or, equivalently, the desirability of purchasingmore stock shares. However, stock is only purchased if thedesirability exceeds a user-selected threshold. We chose 0.8320for this threshold. If the output value is greater than 0.8,then a ‘buy’ signal is generated and how high above 0.8determines the number of shares to buy. Specifically, theamount of stock purchased increased linearly the higher theoutput was above 0.8, subject to sufficient funds in the bankaccount, up to a maximum of 20 shares. Stock was bought atthe opening price and sold at the closing price. All proceedswere deposited into the bank account at the end of eachtrading day.C. The Coevolutionary AlgorithmThe fuzzy rule-base was evolved using a (40 40)evolution strategy. Both recombination and mutation areused as variation operators. Each offspring are created byrandomly choosing two parents. After appending together thecolumns of the M matrix in each parent to form a real vector,standard 1-point crossover, followed by mutation, createsthe offspring. Mutation added a gaussian distributed randomvariable with zero mean and standard deviation σ 0.2 toeach term in the M matrix. The mutation was redone if thecomponent value was less than 0.1 or more than 1.0. For thedefuzzified output any value below 0.5 was automatically setto 0 because a desirability of buying stock with a value thatlow makes no sense. The evolutionary algorithm was run for750 generations.Both the α and the ω rule-bases—corresponding to the αand the ω brokerage firms—evolve independently. Fitness ofa rule-base is determined by tournaments with the competitorrule-bases. Specifically, each individual in the α populationwas provided with 400 and then used its rule-base as aninvestment strategy over 150 consecutive trading days witha start date chosen randomly from the first 850 tradingdays in the training market database. The ω population didthe same over the same 150 trading days. Afterwards eachindividual in both populations has an ending bank accountbalance after selling all shares purchased during the tradingperiod. The bank account balance of each individual in theα (ω) population was compared against 10 randomly chosenindividuals from the ω (α) population. The individual withthe largest bank account records a win.Winning in this game has a positive payoff while losinghas a negative payoff. Every time an individual wins againstan individual in its tournament set, the winner gets 2% ofthe loser’s bank account balance. Conversely, if the individualloses against a member of its tournament set, he has to pay2% of his bank account balance to winner. Hence, individualsget paid or have to pay every time they participate in atournament. (Accounts were not actually credited or debiteduntil after all tournaments were finished.)This payoff approach to conducting tournaments emulatesreal-world trading. Brokerage firms compete for investordollars. The bank account associated with each individualcan be thought of as money given to a brokerage firm byinvestors. Each firm starts out with the same amount andtrades according to the strategy defined by its fuzzy rulebase. Firms with lower bank accounts at the end of thetrading period have poorer strategies and poor strategies2008 IEEE Symposium on Computational Intelligence and Games (CIG'08)
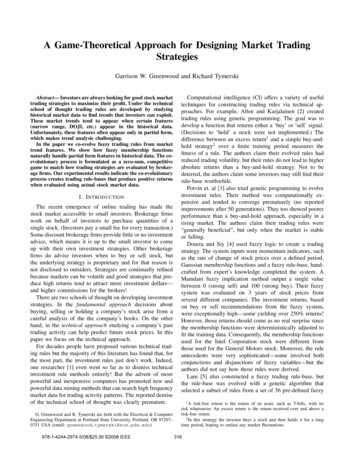
cause investors to move their money elsewhere—i.e., tobetter performing firms.V. E XPERIMENTAL R ESULTSA database of 1600 trading days were available for trainingand testing. The first 1000 days are reserved for trainingwhereas the 600 remaining days are used for validationtesting. Each training epoch consists of 150 consecutivetrading days, with a random starting date and partitioned intothree overlapping 90 day segments. The second segment usedthe last 60 days from the first segment plus 30 new days; thethird segment used the last 30 days of the first segment plus60 new days. The overlaps help mitigate market volatility.Each training epoch started with a 400 bank account.The bank balance at the end of the first 90 day trainingsegment was the beginning bank balance of the second 90day segment. Similarly the third segment beginning balancewas the same as the second segment ending balance. (Bankaccount balances are adjusted as explained in the previoussection.) Testing was conducted in the same way, except the150-day window was chosen from the latter 600 days in thedatabase.Figure 4 shows the results from a typical run on a 90day trading session from the testing portion of the database.Notice the desirability exceeded the 0.8 threshold on only afew days.Fig. 4. Typical trading behavior for the best fuzzy trading rule sets over a90 trading period. Shares were bought whenever the desirability exceeded0.8.Table II shows the bank account balances for the top fiveand bottom five trading strategies after completing the 150days of trading using the training database. Notice for bothfirms the top five strategies had positive returns whereasthe bottom five strategies had negative returns. The positivereturns are considerably higher than the starting balanceof 400. Remember the ending bank account balances arenot due solely to buying stock at a reasonable price. Goodperforming strategies have a higher payoff by taking moneyout of the bank accounts of poorer performing strategies.This zero-sum game format matches how investors in thereal world choose brokerage firms: firms with good strategies attract more investor’s dollars while firms with poorerstrategies drive away investor’s dollars.α Firmω FirmAccount Balances fromTop 5 Strategies ( )548.4, 498.2, 489.6,487.8, 479.6548.9, 548.7, 548.3,547.6, 547.0Account Balances fromBottom 5 Strategies ( )336.1, 335.4, 332.2,331.1, 326.2322.2, 321.2, 319.0,304.5, 300.1TABLE IIBANK ACCOUNT BALANCES FROM TOP AND BOTTOM TRADINGSTRATEGIES FROM TWO BROKERAGE FIRMS . R ESULTS ARE OBTAINEDOVER A 150 TRADING PERIOD WITH AN INITIAL 400 BANK BALANCE .The best α firm fuzzy rule-base strategy was then compared against a simple investment strategy over 90-daytrading periods using the test market data—i.e., the last600 days in the market database, which were not used fortraining. In the simple investment strategy fifty shares ofstock are purchased at the beginning of the trading day andthen sold at the closing price at the end of the trading day.Two trading periods were chosen. The first trading periodbegins on day 1200 while the second trading period beginson day 1400. Figures 5 and 6 compares the simple and fuzzytrading strategies for the first and second trading periods,respectively.Fig. 5. Bank account balances for the top α firm strategy and the simpleinvestment strategy over a 90 day period of test market data starting at the1200th trading day. Both accounts started with a 400 balance.Some interesting observations emerge from a close examination of Figures 5 and 6. The returns from buying andselling stock every day indicates how the market is doing.The market data shows high volatility. Notice the market isgenerally up for several weeks after the 1200th trading daybut reverses dramatically after the 1400th trading day. Moreto the point, the simple investment strategy had a 15.7%return in the first trading period but a -8.2% return during thesecond trading period. Clearly buying stock every day is nota good investment strategy. Conversely, the fuzzy rule-base2008 IEEE Symposium on Computational Intelligence and Games (CIG'08)321
Fig. 6. Bank account balances for the top α firm strategy and the simpleinvestment strategy over a 90 day period of test market data starting at the1400th trading day. Both accounts started with a 400 balance.had a modest 2.5% return during the first trading periodbut no loss during the second trading period. Although thereturns were not as great when the market was up, it didprotect capital when the market was down.VI. F UTURE W ORKIf the two brokerage firms only used their best tradingstrategy, in principle one firm could do some reverse engineering and ultimately deduce the other firms trading strategy(i.e., the fuzzy rules). Notice in Table II that the returnsbetween any of the top two strategies are not significantlydifferent. Hence, a mixed strategy will provide securitywithout sacrificing much of the return.Both brokerage firms used the same membership functions. In practice each brokerage firm would use its owninternally developed membership functions. In this work themembership functions were fixed but in our future experiments we will evolve the membership functions as well.Our evolved trading rule-base only bought stock when themarket data suggested a pending up-trend day. We need toalso evolve a set of down-trend day trading rules. The uptrend day rules would indicate buying opportunities whilethe down-trend days would indicate selling short to helpminimize losses.Finally, our trading strategy relies only on opening andclosing stock prices. Day traders make multiple tradesthroughout the day to maximize returns. Figure 7 shows theprice variation during a 6-hour trading period.322Fig. 7.Stock prices over a single trading day period.Notice that buying the stock at the beginning of the tradingsession and selling the stock after 4 hours would produce ahigher profit than selling or holding based on the openingand closing prices alone, which is what our fuzzy rule baseddecisions on. This suggests fuzzy rules for intra-day tradingwould produce even higher profits. We will investigate thisissue as well.R EFERENCES[1] E. Fama. Efficient ca
open of a predicted trend day and are exited at its close. Four data items were recorded each day: the open share price (O), the high (H) and low (L) for the day and the 3In this work we did not attempt to nd down-trend days, which ould require a different set of strategies. 2008 IEEE Symposium on Computational Intelligence and Games (CIG'08) 317