Transcription
Shadow Flicker Impact Analysis for theNorth Bend Wind ProjectHyde and Hughes Counties, South DakotaJune 2021PRESENTED TOPRESENTED BYNorth Bend Wind Project, LLCTetra Tech, Inc.
North Bend Wind ProjectShadow Flicker Impact AnalysisTABLE OF CONTENTS1.0 OVERVIEW .12.0 PROJECT COMPONENTS .13.0 SHADOW FLICKER BACKGROUND .14.0 WINDPRO SHADOW FLICKER ANALYSIS .25.0 SHADOW FLICKER ANALYSIS RESULTS .36.0 CONCLUSION.47.0 REFERENCES .5LIST OF TABLESTable 1. Historical Sunshine Availability .2Table 2. WindPro Top 10 Expected Shadow Flicker Impacts .3Table 3. Statistical Summary of WindPro Expected Shadow Flicker Impacts – Number of Modeled Receptors.4ATTACHMENTSATTACHMENT A. FIGURESATTACHMENT B. DETAILED SUMMARY OF WINDPRO SHADOW FLICKER ANALYSIS RESULTSiiiJune 2021
North Bend Wind ProjectShadow Flicker Impact nsDefinitionGEGeneral ElectricHzHertzProject areathe encompassing 46,931-acre area where the Project is locatedNorth Bend WindNorth Bend Wind Project, LLCTetra TechTetra Tech, Inc.the Projectthe North Bend Wind ProjectUTMUniversal Transverse MercatorivJune 2021
North Bend Wind ProjectShadow Flicker Impact Analysis1.0 OVERVIEWNorth Bend Wind Project, LLC (North Bend Wind) is proposing to construct and operate the North Bend WindProject (the Project) located in Hyde and Hughes counties, South Dakota. The Project will be located on privatelyheld land within an area that encompasses approximately 46,931 acres (Project area). The Project is expected tohave an up to nominal 200 megawatt (MW) power output capacity after constructing up to 71 wind turbines. NorthBend Wind has contracted Tetra Tech, Inc. (Tetra Tech) to conduct a shadow flicker impact assessment to evaluatethe expected shadow flicker impacts resulting from the Project wind turbines.2.0 PROJECT COMPONENTSThe Project is considering a layout consisting of 78 potential turbine locations to construct a total 71 General Electric(GE) wind turbines. The turbine model being considered for the Project has the following specifications: GE 2.82-127 wind turbines: Three-blade 127-meter rotor diameter, with a hub height of 89 meters andgenerating capacity of 2.82 MW. The GE 2.82-127 has a normal high rotor speed of 15.7 rotations perminute, which translates to a blade pass frequency of 0.79 hertz (Hz; 0.79 alternations per second). Whileonly 71 GE wind turbines would be constructed, 78 potential wind turbine locations were evaluated.3.0 SHADOW FLICKER BACKGROUNDA wind turbine’s moving blades can cast a moving shadow on locations within a certain distance of a turbine. Thesemoving shadows are called shadow flicker and can be a temporary phenomenon experienced at nearby residencesor public gathering places. The impact area depends on the time of year and day (which determine the sun’s azimuthand altitude angles) and the wind turbine’s physical characteristics (height, rotor diameter, blade width, andorientation of the rotor blades). Shadow flicker impact to surrounding properties generally occurs during low anglesunlight conditions, typically during sunrise and sunset. However, when the sun angle is very low (less than threedegrees), sunlight passes through more atmosphere and becomes too diffused to form a coherent shadow. Shadowflicker does not occur when the sun is obscured by clouds or fog, at night, or when the source turbine(s) are notoperating. In addition, shadow flicker occurs only when at least 20 percent of the sun’s disc is covered by the turbineblades.Shadow flicker intensity is defined as the difference in brightness at a given location in the presence and absenceof a shadow. Shadow flicker intensity diminishes with greater receptor-to-turbine separation distance. In general,increasing proximity to turbines may make shadow flicker more noticeable, with the largest number of shadow flickerhours, along with greatest shadow flicker intensity, occurring nearest the wind turbines.Shadow flicker frequency is related to the wind turbine’s rotor blade speed and the number of blades on the rotor.From a health perspective, the low flicker frequencies associated with wind turbines are harmless, and publicconcerns that flickering light from wind turbines can have negative health effects, such as triggering seizures inpeople with epilepsy, are unfounded. Epilepsy Action (the working name for the British Epilepsy Foundation) statesthat there is no evidence that wind turbines can cause seizures (Epilepsy Action 2018). However, they recommendthat wind turbine flicker frequency be limited to 3 Hz. For comparison, strobe lights used in discos have frequenciesthat range from about 3 Hz to 10 Hz (1 Hz one flash per second). Since the proposed Project’s wind turbine bladepass frequency is approximately 0.79 Hz (less than one alternation per second), no negative health effects toindividuals with photosensitive epilepsy are anticipated.Shadow flicker impacts are not regulated in applicable state or federal law. However, the Hyde County ZoningOrdinance Section 9-104-A-20 establishes the following requirements:1June 2021
North Bend Wind ProjectShadow Flicker Impact AnalysisSECTION 9-104 -A-20. Flicker Analysis A Flicker Analysis shall include the duration and location of flickerpotential for all receptors and road ways within a one (1) mile radius of each turbine within a project. Theapplicant shall provide a site map identifying the locations of shadow flicker that may be caused by theproject and the expected durations of the flicker at these locations from sun-rise to sun-set over the courseof a year. The analysis shall account for topography but not for obstacles such as accessory structures andtrees. Flicker at any receptor shall not exceed thirty (30) hours per year within an established dwelling andforty (40) hours per year from any occupied structure.4.0 WINDPRO SHADOW FLICKER ANALYSISAn analysis of potential shadow flicker impacts from the Project was conducted using the WindPro softwarepackage. As described above, 78 wind turbine locations were evaluated though the Project would only install up to71 wind turbines.The WindPro analysis was conducted to determine shadow flicker impacts under realistic impact conditions (actualexpected shadow). This analysis calculated the total amount of time (hours and minutes per year) that shadowflicker could occur at receptors surrounding the Project wind turbines. The realistic impact condition scenario isbased on the following: The elevation and position geometries of the wind turbines and surrounding receptors (potentially occupiedresidences). Elevations were determined using U.S. Geological Survey digital elevation model data.Positions geometries were determined using geographic information system and referenced to UniversalTransverse Mercator (UTM) Zone 14 (NAD83). The position of the sun and the incident sunlight relative to the wind turbine and receptors on a minute-byminute basis over the course of a year. Historical sunshine availability (percent of total hours available). Historical sunshine rates for the area (assummarized by the National Climatic Data Center [NOAA 2019] for nearby Huron, South Dakota) used inthis analysis are provided in Table 1. Estimated wind turbine operations and orientation based on wind data (wind speed and direction) measuredat meteorological towers located on the Project area. Receptor viewpoints (i.e., house windows) were assumed to be directly facing the turbine-to-sun line ofsight (“greenhouse mode”).Table 1. Historical Sunshine %62%62%59%66%69%76%74%69%59%51%51%WindPro incorporates terrain elevation contour information and the analysis accounts for terrain elevationdifferences. The sun’s path, with respect to each turbine location, is calculated by the software to determine thecast shadow paths every minute over a full year. Sun angles less than 3 degrees above the horizon were excludedfor the reasons identified earlier in Section 3. Since shadow flicker is only an issue when at least 20 percent of thesun’s disc is covered by the blades, WindPro uses blade dimension data to calculate the maximum distance fromthe turbine where shadow flicker must be calculated. Beyond this distance, the turbine would not contribute to theshadow flicker impact. It should be noted however, that WindPro provides a conservative estimate of shadow flickersince obstacles such as trees, haze, and visual obstructions (window facing, coverings) are not accounted fordespite the likelihood of their reducing or eliminating shadow flicker impacts to receptors.A total of 51 residential structures were identified within and near the Project area as occupied or potentiallyoccupied residences. These residences are considered potential shadow-flicker receptors for the purpose of this2June 2021
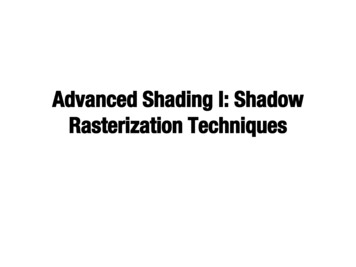
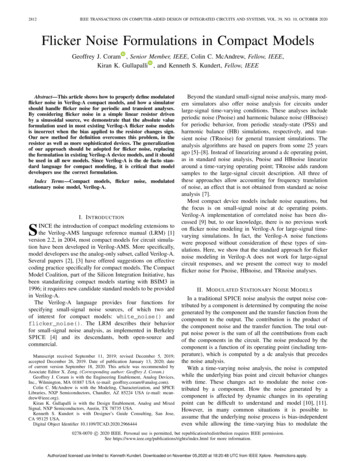
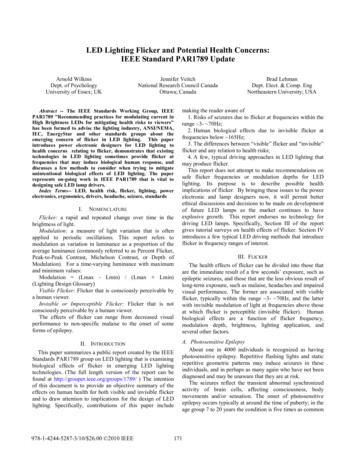
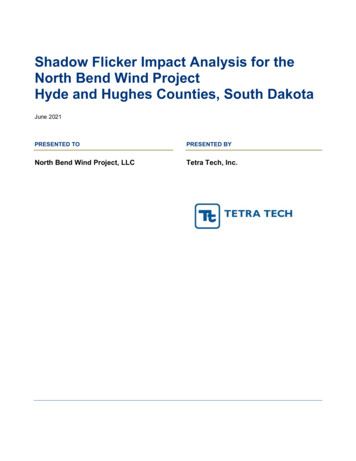
North Bend Wind ProjectShadow Flicker Impact Analysisanalysis and are shown on Figure 1 and Figures 1A-1H (Attachment A). A receptor in the model is defined as a 1meter-squared area (approximate size of a typical window), 1 meter (3.28 feet) above ground level. Approximateeye level is set at 1.5 meters (4.94 feet). In addition to the identified residential structures, Figures 1A-1H show thepotential turbine locations considered.5.0 SHADOW FLICKER ANALYSIS RESULTSAs expected, WindPro predicts that shadow flicker impacts would be greatest at locations closer to the windturbines. Attachment A illustrates the WindPro-predicted shadow flicker impact areas.Table 2 presents the WindPro-predicted shadow flicker impacts for the top 10 worst-case impact receptors.Table 3 summarizes the shadow flicker impact prediction statistics. The predicted shadow flicker impact for all 51receptors is presented in Attachment B. The maximum predicted shadow flicker impact at any occupied residencereceptor is 79 hours and 44 minutes per year (Receptor 26). This is approximately 1.8 percent of the potentialavailable daylight hours. However, this receptor is participating in the Project. All non-participating receptorlocations had modeled shadow flicker impacts below the ordinance threshold of 30 hours per year.Table 2. WindPro Top 10 Expected Shadow Flicker ImpactsReceptor IDReceptor TypeReceptor ProjectParticipation StatusExpected Shadow FlickerHours per Year 6:253June 2021
North Bend Wind ProjectShadow Flicker Impact AnalysisTable 3. Statistical Summary of WindPro Expected Shadow Flicker Impacts – Number of Modeled ReceptorsCumulative Shadow Flicker Time (Expected)Number of Modeled ReceptorsTotal51 0 Hours38 0 Hours 10 Hours8 10 Hours 20 Hours1 20 Hours 30 Hours3 30 Hours16.0 CONCLUSIONThe analysis of potential shadow flicker impacts from the Project on nearby receptors shows that shadow flickerimpacts within the area of study are expected to be minor and well within acceptable ranges for avoiding nuisanceand/or health hazards. All of the non-participating receptor locations had modeled shadow flicker impacts belowthe ordinance threshold of 30 hours per year. The analysis assumes that the receptors all have a direct in-lineview of the incoming shadow flicker sunlight and does not account for trees or other obstructions that may blocksunlight. In reality, the windows of many houses will not face the sun directly for the key shadow flicker impacttimes. For these reasons, shadow flicker impacts are expected to be less than estimated in this conservativeanalysis, and shadow flicker is not expected to be a significant environmental impact. Note that the only receptor(#26) that has expected shadow flicker greater than 30 hours per year is a participating residence that issurrounded by several trees and hedges that are likely to mitigate shadow flicker impact.4June 2021
North Bend Wind ProjectShadow Flicker Impact Analysis7.0 REFERENCESEpilepsy Action. 2018. Information Web Page on Photosensitive Epilepsy. British Epilepsy Association.http://www.epilepsy.org.uk/info/photo other.html. Accessed July 2018.NOAA (National Oceanic and Atmospheric Administration). 2019. Comparative Climatic Data for the UnitedStates Through 2018.5June 2021
North Bend Wind ProjectShadow Flicker Impact AnalysisATTACHMENT A. FIGURESJune 2021
330th AveNorth Bend Wind Project43 3845201st St2040Figure 1Expected Shadow FlickerImpact Area335th Ave200th St331st Ave319th Ave318th Ave201 St44199th St334th Ave200 St18325th Ave323rd Ave19327th Ave41199 StHughes and Hyde Counties, SD0102Project Area2146040323202nd St0506071012203 St 1108151420261924Local Road29Shadow Flicker (Hours per Year)27205th St50424749314th Ave 100 - 2003748650511213209th St210 St58575654687374Rd75212th St7615MN7WY37778SD213th StNE17169342MT721213 St1ND69211 St710.5Miles70676665630116160329th Ave313th Ave535259556443474649624241 2005326th Ave34 3340394544eellapChR:\PROJECTS\NORTH BEND 1066-0011\SHADOW FLICKER\MAPS\NorthBend Figure 1 Shadow Flicker.mxd3836 50 - 100207th St3735 30 - 503635208th St 15 - 303433320 - 15323039Highway/Major Road28206 St208 StCounty BoundaryHolabird Grade3017Hyde County31Non-Participating182328324th Ave25205 St2722322nd Ave26321st Ave316th Ave315th Ave2421Participating5116Hughes County25204th St203rd St13Sensitive Receptor336th Ave09Proposed Turbine333rd Ave202 St214th StIA
North Bend Wind Project316th AveFigure 1AExpected Shadow FlickerImpact Area199th St19323rd Ave322nd AveHughes and Hyde Counties, SDProject AreaProposed TurbineSensitive ReceptorParticipatingNon-Participating200 St18County Boundary44Highway/Major Road318th AveLocal RoadShadow Flicker (Hours per Year)0 - 15319th Ave43R:\PROJECTS\NORTH BEND 1066-0011\SHADOW FLICKER\MAPS\NorthBend Figure 1 Shadow Flicker mapbook.mxd201 St38321st Ave 15 - 30 30 - 50201st St 50 - 10045 100 - 20020 2004021202 St222300.250.51Miles06ABCD09EFGH081514
198th StNorth Bend Wind ProjectFigure 1BExpected Shadow FlickerImpact Area41199th StProject Area323rd Ave322nd Ave327th AveHughes and Hyde Counties, SDProposed Turbine325th AveSensitive ReceptorParticipatingNon-Participating200th St200 StCounty Boundary44Highway/Major RoadLocal RoadShadow Flicker (Hours per Year)Hughes CountyHyde County20 15 - 30 30 - 50201st St 50 - 100 100 - 200 2000102202 St CD203rd St203 St326th AveR:\PROJECTS\NORTH BEND 1066-0011\SHADOW FLICKER\MAPS\NorthBend Figure 1 Shadow Flicker mapbook.mxd0 - 15161817EFGH
21202 St22North Bend Wind Project2306Figure 1CExpected Shadow FlickerImpact AreaHughes and Hyde Counties, SD09Project AreaProposed Turbine08Sensitive Receptor15Participating14Non-ParticipatingCounty Boundary2519319th Ave316th Ave252621Local Road22Shadow Flicker (Hours per Year)0 - 1527 30 - 50 50 - 100 100 - 200205 St 200318th AveR:\PROJECTS\NORTH BEND 1066-0011\SHADOW FLICKER\MAPS\NorthBend Figure 1 Shadow Flicker mapbook.mxd20 15 - 3026321st Ave24Highway/Major Road322nd Ave204th St3130206 St00.250.51Miles3031207th St32ABCDEFGH
022146220504North Bend Wind Project03Figure 1DExpected Shadow FlickerImpact Area0609Hughes and Hyde Counties, SD203 St325th Ave323rd Ave0710203rd StProject Area121113Proposed Turbine08Sensitive unty Boundary17Highway/Major Road202621222327 15 - 30 30 - 50 50 - 10029 100 - 200 200205th StChap ell32324th Avee Lake Rd4200.250.51Miles50473031CDEFGH207th St3635B34327th Ave33A49326th AveR:\PROJECTS\NORTH BEND 1066-0011\SHADOW FLICKER\MAPS\NorthBend Figure 1 Shadow Flicker mapbook.mxdShadow Flicker (Hours per Year)0 - 152828205 StLocal Road24Hughes CountyHyde County322nd Ave204th St
32322nd Ave42North Bend Wind ProjectFigure 1EExpected Shadow FlickerImpact Area50Hughes and Hyde Counties, SD324th Ave474934333031Project AreaProposed Turbine207th StSensitive Receptor32327th Ave3635ParticipatingNon-ParticipatingCounty Boundary44Shadow Flicker (Hours per Year)545330 - 15 15 - 30 30 - 5046 50 - 100 100 - 2004837 200326th Ave34Local Road39325th Ave321st AveR:\PROJECTS\NORTH BEND 1066-0011\SHADOW FLICKER\MAPS\NorthBend Figure 1 Shadow Flicker mapbook.mxd36Highway/Major Road37Hyde County208th St35Hughes County38209th 67656668EFGH69
Chap elle Lake RdNorth Bend Wind ProjectHolabird Grade42Figure 1FExpected Shadow FlickerImpact AreaHughes and Hyde Counties, SD49Project Area34Proposed Turbine207th StSensitive Receptor36327th AveParticipating4243330th Ave38335th AveNon-ParticipatingCounty BoundaryHighway/Major RoadLocal Road4140395Shadow Flicker (Hours per Year)0 - 15208th St 15 - 30 30 - 5047 50 - 10046 20048650141213209th St5351334th 29th AveR:\PROJECTS\NORTH BEND 1066-0011\SHADOW FLICKER\MAPS\NorthBend Figure 1 Shadow Flicker mapbook.mxd 100 - 200EFGH
59North Bend Wind Project5557565458Figure 1GExpected Shadow FlickerImpact Area61Hughes and Hyde Counties, SD321st Ave60646270676563Project AreaProposed Turbine666869Sensitive ReceptorParticipating326th AveNon-Participating73County Boundary71Highway/Major Road72Local Road74Shadow Flicker (Hours per Year)322nd AveR:\PROJECTS\NORTH BEND 1066-0011\SHADOW FLICKER\MAPS\NorthBend Figure 1 Shadow Flicker mapbook.mxd15Hyde County212th StHughes County750 - 153 15 - 30 30 - 5076 50 - 10077 100 - 200 20017800.25160.51Miles34ABCD214th StEFGH
5052334th Ave330th Ave51Figure 1HExpected Shadow FlickerImpact Area1161333rd5857North Bend Wind ProjectAveHolabird Grade59Hughes and Hyde Counties, SD70Project AreaProposed Turbine68Sensitive Receptor69ParticipatingNon-ParticipatingCounty BoundaryHighway/Major Road72Local Road7Shadow Flicker (Hours per Year)0 - 153 15 - 30 30 - 50 50 - 100 100 - 200335th Ave329th Ave1213th 200St00.250.51Miles934ABCD214th St331st AveR:\PROJECTS\NORTH BEND 1066-0011\SHADOW FLICKER\MAPS\NorthBend Figure 1 Shadow Flicker mapbook.mxd212th StSD Highway34215th StEFGH
North Bend Wind ProjectShadow Flicker Impact AnalysisATTACHMENT B. DETAILED SUMMARY OF WINDPRO SHADOW FLICKERANALYSIS RESULTSJune 2021
North Bend Wind ProjectShadow Flicker Impact AnalysisTable A-1. Detailed Summary of WindPro Shadow Flicker Analysis ResultsReceptorIDUTM-E (m)UTM-N (m)WindPro Predicted ExpectedShadow Flicker (Hours per Year)Participation ntB-1June 2021
North Bend Wind ProjectShadow Flicker Impact cipantB-2June 2021
Shadow flicker intensity is defined as the difference in brightness at a given location in the presence and absence of a shadow. Shadow flicker intensity diminishes with greater receptor-to-turbine separation distance. In general, increasing proximity to turbines may make shadow flicker more noticeable, w