Transcription
CENTER FOR HEALTH INFORMATION AND ANALYSISPERFORMANCE OF THEMASSACHUSETTSHEALTH CARE SYSTEMANNUAL REPORTS E P T EM B E R 2016
Contents2EXECUTIVE SUMMARY8TOTAL HEALTH CARE EXPENDITURES18QUALITY OF CARE IN THE COMMONWEALTH24TOTAL MEDICAL EXPENSES & PAYMENT METHODOLOGIES33PRIVATE COMMERCIAL CONTRACT ENROLLMENT38PRIVATE COMMERCIAL COVERAGE COSTS42PRIVATE COMMERCIAL CONTRACT MEMBER COST-SHARING45PRIVATE COMMERCIAL PAYER USE OF FUNDS48GLOSSARY OF TERMS52INDEX OF ACRONYMS
Executive SummaryEach year, the Center for Health Information and Analysis (CHIA) reports on theperformance of the Massachusetts health care system in order to monitor cost and qualitytrends over time and to inform policymaking. This report is the fourth annual look at thesetrends since the passage of the Commonwealth’s 2012 cost containment legislation,Chapter 224.Initial 2015 THCEIn 2015, Total Health Care Expenditures (THCE) in Massachusetts grew 3.9% from theprior year to 8,424 per resident ( 57 billion statewide). This growth rate exceeded thetarget benchmark set by the Health Policy Commission (3.6%) and inflation (0.6%). It was,however, slower growth than projected for per capita national health care expenditures(4.6%) and in line with the per capita growth of the Massachusetts economy (3.9%). Thesefigures reflect CHIA’s initial assessment of 2014-2015 growth, and will be finalized nextyear (see 2013-2014 Final THCE Analysis, page 12, and Understanding the Differences:Comparing Initial and Final 2014 THCE, page 13, for updated 2013-2014 statistics).Overall spending grew across the major categories of THCE including public coverage,commercial coverage, and the net cost of private health insurance.Growth in spending among public payers was 3.8%, moderating from 6.8% in 2014. Mostnotably, MassHealth spending, which had previously risen by approximately 18% duringthe implementation of the Affordable Care Act (ACA) in 2014, grew by 4.6%. Becauseenrollment grew by a greater amount than overall spending, per member per month(PMPM) spending for members for whom MassHealth was the primary payer declined by3.1%, excluding temporary coverage.2center for health information and analysisAnnual Report on the Performance of the Massachusetts Health Care System: September 2016
3.9%2015 initial THCE wasPMPM spending for commercial 57.2 billion, or 8,424full-claim members grew 1.7%.per capita, representing aMassHealth Direct PMPM3.9% increase from 2014declined 3.1%, as enrollmentand exceeding the healthoutpaced medical spending.care cost growth benchmarkTraditional Medicare spendingby 0.3 percentage points.rose 2.0% PBPY.2014KEY FINDINGS10.1%2015After several years ofPharmacy spendingThe quality of Massachusettsincreases, the proportion ofcontinues to grow at aproviders was generally at orcommercial members whosesubstantial rate (10.1% inabove national benchmarks,care was paid for using2015, following 13.5% inbut there was performancealternative payment methods2014). This spending growthvariation across providers.declined by 1.9 percentageaccounts for one-third of thepoints in 2015 to 35.1%.overall growth in THCE. 90K4.4%Individual enrollment moreOne in five MassachusettsCost-sharing amongthan doubled to 170,000commercial membersprivate commercialenrollees as subsidized(21%) were enrolled in amembers continued toand unsubsidized coveragehigh deductible health plan.increase faster inflation andbecame available through theMembership increased bywage growth. Members14% to nearly one millioncontinue to bear a greatermembers.share of health care costs.Health Connector.www.chiamass.gov/2016annualreportcenter for health information and analysis3
Health care spending by commercial payers in 2015 rose by 4.7%, higher than theprevious year’s trend (2.6%). During this time, commercial enrollment increased by 1.7%to 4.5 million members. For commercial members with a comprehensive set of benefitsfrom one payer, spending increased 4.8% and membership grew 3.0%—a 1.7% PMPMincrease. An influx of new individual purchasers entered the private market as severalpublic programs closed and expanded forms of coverage became available for purchasethrough the Massachusetts Health Connector, more than doubling the size of this marketsegment. Reflecting this trend, the net cost of private health insurance (NCPHI), theadministrative costs of commercial health insurance plans, grew by 12.6% in 2015,largely driven by the Merged and Medicaid Managed Care Organization markets.Pharmacy SpendingPharmacy spending continued to play a significant role in the growth of THCE. Payersreported that prescription drug spending increased by 10.1% to 8.1 billion. While thisgrowth rate is lower than the year before (13.5%), it represents continued substantialgrowth and is responsible for one-third of the overall growth in THCE.Member Cost-SharingCost-sharing among private commercial members rose by 4.4%, faster than inflation,wage growth, and overall cost of insurance coverage, while average benefit levelsdecreased slightly. Average premiums in the fully-insured market increased by 1.6% whileself-insured cost-of-claims (excluding administrative service fees) rose by 2.1%.HDHP EnrollmentTo mitigate premium increases, Massachusetts employers and members continue toadopt high deductible health plans, which by design, may subject consumers to higherout-of-pocket costs. Enrollment increased in high deductible health plans (now 21% of the4center for health information and analysisAnnual Report on the Performance of the Massachusetts Health Care System: September 2016
commercial market) and held steady in tiered network plans (16%). Limited Network planenrollment increased by 8%, but remains small at 3% of the commercial market. Theseenrollment increases indicate continued interest by employers in alternative plan designsthat provide stronger incentives for cost containment.Alternative Payment MethodsThe adoption of alternative payment methods (APMs) in payer-provider contracts fell1.9 percentage points in the commercial market. Nearly all commercial and MassHealthMCO APM contracts continue to reflect a global payment approach, where the member’sprimary care physician group has incentives (including upside and downside risk) tocontrol the total cost of care by all providers while maintaining or improving quality. Payersin Massachusetts use these kinds of contracts much more regularly than other states andthe statewide adoption rate is driven by Massachusetts-based carriers.Overall APM adoption for MassHealth MCOs was approximately 32% in 2015, up onepercentage point from the previous year. The adoption of APMs for the MassHealth PrimaryCare Clinician Plan also increased one percentage point to 23% in 2015.Quality of Massachusetts ProvidersThe quality of Massachusetts providers tends to be at or above national averages.However, there remain opportunities to improve service quality and patient outcomes, andthere is variation in performance across providers, across types of measures, and acrosspatient r for health information and analysis5
Next StepsThe findings of this report will help inform the Health Policy Commission’s (HPC) 2016Health Care Cost Trends Hearing, scheduled for October 17 and 18.The annual hearing is a public examination into the drivers of health care costs whichengages experts and witnesses to identify particular challenges and opportunities withinthe Commonwealth’s health care system.Under Chapter 224, CHIA is required to complete and submit its annual report on theMassachusetts health care system 30 days in advance of the HPC’s hearing.Later this fall, CHIA will explore many of these topics in greater depth in the Performanceof the Massachusetts Health Care System Series. Subjects will include provider quality,changes in enrollment by product type, APMs, and provider price variation.6center for health information and analysisAnnual Report on the Performance of the Massachusetts Health Care System: September 2016
center for health information and analysis7
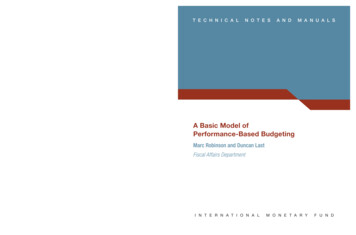
TOTALHEALTH CAREEXPENDITURESKEY FINDINGSBased on the initialassessment, THCE inMassachusetts rose by 2.5billion to 57 billion in 2015.This translates to 8,424per capita, an increase of3.9% from 2014, exceedingthe health care cost growthbenchmark of 3.6%.BACKGROUNDA key provision of the Massachusetts health care costcontainment law, Chapter 224 of the Acts of 2012,established a benchmark against which the annual changein health care spending growth is evaluated. The Centerfor Health Information and Analyis (CHIA) is charged withcalculating Total Health Care Expenditures (THCE) andcomparing its per capita growth with the health care costgrowth benchmark, as determined by the Health PolicyCommission. For 2015, this benchmark was set to 3.6%.1per capita rose 3.9% from 8,109 in 2014 to 8,424 in2015 (Figure 1 and Figure 2). This increase exceeded thestate’s 2015 growth benchmark of 3.6%. THCE per capitagrowth fell below the projected national per capita growthin health care expenditures (4.6%),5 was in line with theper capita growth of the Massachusetts economy (3.9%),6and exceeded regional inflation (0.6%) in 2015.7COMPONENTS OF THCE: PUBLIC COVERAGEMassHealthMassHealth is the Commonwealth’s public healthGrowth in overall spendingamong public payers was3.8% in 2015, moderatingfrom 6.8% in 2014.Overall commercialspending increased 4.7%,and the net cost of privatehealth insurance increased12.6% in 2015.THCE encompasses health care expenditures forMassachusetts residents from public and privatesources, including (i) all categories of medical expensesand all non-claims related payments to providers; (ii)all patient cost-sharing amounts, such as deductiblesand co-payments; and (iii) the costs of administeringprivate health insurance (called the net cost of privatehealth insurance or NCPHI).2 It does not include out-ofpocket payments for goods and services not covered byinsurance, such as over-the-counter medicines, and italso excludes other categories of expenditures such asvision and dental care.3Each year, CHIA publishes an initial assessment of THCEbased on data with at least 60 days of claims run-outfor the previous calendar year, which includes payers’estimates for claims completion and provider quality andperformance settlements. Final THCE is published thefollowing year, based on data submitted 17 months afterthe end of the performance year. This report providesfinal results for the 2014 performance period and initialresults for 2015.4 THCE for 2015 will be updated withfinal data in September 2017.2015 INITIAL ANALYSISBased on the initial assessment of 2015 THCE, health careexpenditures in Massachusetts totaled 57 billion. THCE8center for health information and analysisinsurance program for eligible low income residents ofMassachusetts, combining Massachusetts’s Medicaidprogram and the Children’s Health Insurance Program(CHIP). In 2015, MassHealth expenditures represented28.2% of THCE.Spending for MassHealth members rose 4.6% from 15.4 billion in 2014 to 16.1 billion in 2015. Thisrepresents a notable deceleration since 2014; that year,MassHealth spending grew by 17.9%, largely becauseof increased enrollment as the Affordable Care Act (ACA)was implemented in the Commonwealth.8In 2015, MassHealth was the primary payer for 70.4%of its membership,9 accounting for 54.0% of totalMassHealth spending.10 MassHealth also providescoverage—and, in some cases, premium assistance—to eligible residents with other primary insurancecoverage.11 These members represented 28.3% of totalMassHealth membership, and 39.4% of total paymentsin 2015. One percent of MassHealth members wereenrolled in temporary coverage through February 2015,before transitioning to other forms of health insurance(including commercial qualified health plans [QHPs], orMassHealth programs). Spending for temporary coveragein 2015 accounted for 0.3% of total MassHealthAnnual Report on the Performance of the Massachusetts Health Care System: September 2016
1Total Health Care Expenditures Growthin Context, 2013-20155%4.2%Per capita THCE growth exceeded theTHCE per Capita 8,109 in 2014state growth benchmark, was in line with4%the growth of the Massachusetts economy,per CapitaGross State Productand exceeded regional inflation (ConsumerTOTAL HEALTH CARE EXPENDITURESPER CAPITA GREW BY 3.9%,EXCEEDING THE HEALTH CARE COSTGROWTH BENCHMARK FOR 2015.3.9%3.6%Cost Growth BenchmarkAnnual IncreasePrice Index) in 2015.3.9%THCE per Capita 8,424 in 20153%2%Consume rPriceIndex(Inflation)1%0.6%Source: Payer-reported data to CHIA and other public sources.Inflation data from Bureau of Labor Statistics: ConsumerPrice Index 12-Month Percent Change. Gross State Productdata from U.S. Bureau of Economic Analysis: GDP by State inCurrent Dollars.spending. In addition to the areas mentioned above,6.3% of total MassHealth spending consisted of nonclaims based payments to providers.In 2015, spending for members for whom MassHealth wasthe primary payer (excluding temporary coverage) grew by9.4%, accompanied by a 12.9% increase in membership.MassHealth per member per month (PMPM) spending forthese members declined by 3.1% from 2014 to 2015.Spending for members for whom MassHealth wasnot the sole payer also grew by 9.4% in 2015, whilemember months increased 12.2%.12MassHealth MCOs and PCC PlanIn 2015, approximately 44.1% of MassHealth membersreceived health coverage through a MassHealth ManagedCare Organization (MCO), a private health plan thatmanages the care of its members and contracts directlywith network providers.13 Alternatively, members may electto participate in MassHealth’s Primary Care Clinician (PCC)Plan, a managed-care plan that is administered directly byMassHealth. About 19.9% of MassHealth members werecovered by the PCC Plan in 2015.0%2013-20142014-2015or 6.1%, to 4.1 billion in 2015. This growth rate wassignificantly reduced from the growth rate of 46.0% in2014.14 MassHealth also made payments directly toproviders on behalf of MCO members for services thatwere not included in the capitation rates paid to theMassHealth MCOs, totaling an additional 460 millionin 2015. MCO membership grew 8.5% from 9.2 millionmember months to 9.9 million member months during2015, down from 46.3% growth during 2014. On aPMPM basis, spending by MassHealth MCOs declined2.2%, to 414 in 2015.15MassHealth PCC Plan spending rose by 13.5% to 2.9billion in 2015.16 PCC membership grew by 673,000member months (17.6%) to 4.5 million during thistime period. This resulted in a 3.5% decline in PMPMspending, to 646 in 2015.MassHealth Fee-For-ServiceSome MassHealth members receive services on a feefor-service (FFS) basis. In 2015, 80.0% of individualsreceiving MassHealth FFS had other primary insurance,including Medicare.17 Overall, members receivingservices through FFS comprised 31.4% of the totalMassHealth membership in 2015.Spending by MassHealth MCOs rose by 235 million,www.chiamass.gov/2016annualreportcenter for health information and analysis9
HEALTH CARE EXPENDITURESPER MASSACHUSETTS RESIDENTWERE 8,424 IN 2015—AN ANNUALINCREASE OF 3.9%.2Components of Total Health Care Expenditures, 2014-2015THCE represents the total amount paid by or on behalf of Massachusetts residents forinsured health care services. It includes the NCPHI (non-medical spending by commercialhealth plans), and medical spending for commercially and publicly-insured Massachusettsresidents.Annual Change inTotal Spending 2.1BPercent Change percapita from 2014-2015Net Cost of PrivateHealth Insurance 8,424THCE per capita4.7%Commercial 15.4B4.6%MassHealthMedicare5.3%Medicare 1.9B-14.5% 1.6B 15.7BNotes: Percent changes are calculated based on non-roundedexpenditure amounts. Please see databook for detailedinformation. 20.6BCommercialMassHealthSource: Payer-reported data to CHIA and other public sources.See technical appendix.Net Cost of PrivateHealth Insurance12.6% 19.7B3.9% 2.4BOther PublicTotal Overall Spending2014 54.8BTotal spending for the MassHealth FFS population grew 435 million from 5.8 billion in 2014 to 6.2 billionin 2015.18 Among FFS members for whom MassHealthwas their primary payer (about 20.0% of FFS members),PMPM spending fell by 18.6%, from 1,066 in 2014to 867 in 2015, accompanied by a 34.3% growth inmembership. 16.1B 16.5BOther Public 57.2BTotal Overall Spending2015From 2014 to 2015, SCO spending increased by 12.2%to 993 million, while membership increased by 15.0%to 464,088 member months. PMPM spending declined2.4% to 2,139 in 2015. Spending for the PACEprogram rose 9.8% to 146 million in 2015; enrollmentgrew 9.1% to 42,466 member months during this timeperiod. On a PMPM basis, PACE spending was relativelystable, increasing by 0.7% to 3,439 in 2015.Other MassHealth ProgramsWhile the majority of MassHealth members are enrolledin FFS, an MCO, or the PCC plan, MassHealth alsooperates a number of smaller programs designedprimarily for populations that are dually eligible forMedicare and Medicaid. These include Senior CareOptions (SCO), for members ages 65 and older; theProgram of All-inclusive Care for the Elderly (PACE),for members ages 55 and older; and One Care, formembers ages 21 to 64.19, 20One Care spending rose 66.2% to 230 million in 2015,accompanied by an increase in enrollment of 10.8% to195,791 member months. This substantial spendinggrowth reflects rate adjustments made by MassHealth andthe Centers for Medicare & Medicaid Services (CMS) toaccount for higher-than-anticipated expenses for this highneed population.21 On a PMPM basis, One Care spendingincreased 50.0%, to 1,174 in 2015.In addition to program payments for members’ health10center for health information and analysisAnnual Report on the Performance of the Massachusetts Health Care System: September 2016
care services, MassHealth made supplementalpayments to health care providers such as hospitals andnursing facilities. Overall expenditures for this categoryremained stable between 2014 and 2015, increasingapproximately 0.1% to approximately 1 billion.MassHealth Temporary CoverageIn 2014, MassHealth offered temporary coveragefor individuals awaiting eligibility determination forsubsidized coverage through the Massachusetts HealthConnector website. Spending for this program fellfrom 635 million in 2014 to 51 million in 2015, asmembers transitioned to other forms of coverage.MedicareOverall, spending for Massachusetts residents coveredby Medicare programs, including Medicare Parts A, B,C, and D, grew by 835 million (or 5.3%), from 15.7billion to 16.5 billion in 2015. Total expenditures forMedicare programs accounted for 28.8% of THCEin 2015, representing nearly half of public programexpenditures included in THCE.Total spending for Parts A and B (inpatient andoutpatient medical care) increased 418 million (3.8%)to 11.5 billion in 2015. After a slight decline theprevious year (-0.4%), the number of beneficiaries grewby 1.7% to 958,000 in 2015. On a per-beneficiarybasis, spending rose 2.0% to 12,000 in 2015.The Medicare Advantage plan (Part C) is a type of Medicaremanaged care plan offered by commercial payers undercontracts with Medicare to provide beneficiaries with allPart A and Part B benefits, sometimes accompanied byprescription drug benefits (Part D). Overall expenditures forMassachusetts residents covered by Medicare Advantageplans rose 3.6%, from 2.7 billion in 2014 to 2.8 billionin 2015. Membership increased by 3.1% to 2.4 millionmember months in 2015. As a result, spending PMPMgrew slightly (0.5%) from 1,168 to 1,173 during thistime period.Spending for Medicare Part D prescription drug plansincreased 319 million (17.2%) to 2.2 billion in 2015.The number of Part D beneficiaries increased by 5.7%www.chiamass.gov/2016annualreportto 570,000 during this period. On a per-beneficiarybasis, spending grew 10.9% to 3,817 in 2015.Other Public ProgramsDepartment of Veterans AffairsThe Department of Veterans Affairs, through its VeteransHealth Administration division, provides health care forcertain eligible U.S. military veterans. Medical spendingfor Massachusetts veterans increased 10.6% to 1.3billion in 2015.22Health Safety NetThe Health Safety Net pays acute care hospitals andcommunity health centers for medically necessaryhealth care services provided to eligible low-incomeuninsured and underinsured Massachusetts residents upto a predetermined amount of available funding. HealthSafety Net provider payments were stable at 350million in both 2014 and 2015.Discontinued Public ProgramsTHCE includes data for two discontinued publicprograms that were active through January 2015.Commonwealth Care was a state insurance program,administered by the Health Connector, which providedcoverage to residents with incomes up to 300% ofthe federal poverty level (FPL), who were not eligiblefor MassHealth coverage. This program was to beeliminated in anticipation of ACA implementation but—because of the initial limited functionality of the stateinsurance exchange—Commonwealth Care was phasedout gradually, and ultimately ended in January 2015.23Accordingly, overall expenditures for CommonwealthCare decreased by 95.0% to 20 million in 2015, andtotal membership declined by 95.0% from 1.1 millionmember months to 57,000 member months.24The Medical Security Program provided health insurancecoverage to certain Massachusetts residents receivingunemployment insurance benefits. This program waseliminated in 2014, though legacy enrollees remainedcovered by Tufts Health Public Plans through January2015. Tufts Health Public Plans reported that thesemembers were subsequently moved into QHPs.25 As aresult, spending fell from 23 million in 2014 to 1.2center for health information and analysis11
million in 2015 (-94.9%). Membership also declined bynearly 95.0%, from 113,000 to fewer than 6,500.26COMPONENTS OF THCE: PRIVATECOMMERCIAL INSURANCEIn 2015, spending for the commercially insuredpopulation rose 927 million to 20.6 billion, anincrease of 4.7%, which was 1.6 percentage pointshigher than the 2014 growth rate of 2.6%.27Between 2014 and 2015, total expenditures increasedby 4.8% for members covered by a comprehensive set ofbenefits by a single payer (“full-claim” members) to 14.7billion, while membership increased by 3.0%. On a PMPMbasis, spending grew 1.7% to 437 in 2015.28 For “partialclaim” members (for whom reporting payers are unableto collect and report spending information on carved-outservices such as behavioral health and prescription drugs),total expenditures increased by an estimated 4.5%, andmembership remained stable (0.0%).29COMPONENTS OF THCE: NET COST OFPRIVATE HEALTH INSURANCENCPHI captures the administrative costs of healthinsurance plans.30 NCPHI grew by 267 million to 2.4billion in 2015 (12.6%). This was driven by the mergedmarket, Medicaid MCO, and Administrative ServicesOnly categories, which grew by 41.2%, 76.8%, and7.0%, respectively.31 Together, these areas accounted forslightly more than half of total NCPHI. NCPHI growth inthese markets may have been influenced by increasesin enrollment.32 In contrast, NCPHI was stable withinthe large group market, and fell 9.4% among MedicareAdvantage plans. See A Closer Look at the end of thischapter for more information about how pharmaceuticalrebates are considered in NCPHI.12center for health information and analysis2013-2014 FINAL THCE ANALYSISThe initial assessment of 2013-2014 THCE per capitagrowth, reported in September 2015, indicated anincrease of 4.8%. Updated with final data reported bypayers, THCE per capita growth in 2014 was revised toan increase of 4.2%.SUMMARYThe initial assessment of 2015 THCE was 8,424per capita, an increase of 3.9% from 2014, slightlyexceeding the health care cost growth benchmark.Overall spending increased across all categories ofTHCE in 2015. Commercial health care spending grewby 4.7%, Public Coverage rose by 3.8%, and NCPHIgrew by 12.6%.To better understand these trends, CHIA will continueto report on provider price variation, health insuranceenrollment, the adoption of alternative payment methods(APMs) and other indicators of the performance of theMassachusetts health care system.Annual Report on the Performance of the Massachusetts Health Care System: September 2016
Understanding the Differences: Comparing Initial and Final 2014 THCEIn order to meet statutory deadlines, data used to calculate initial THCE is reported to CHIA with only60-90 days of claims run-out after the close of the calendar year. As such, the initial assessment ofTHCE includes payer estimates for claims expenses that have been incurred but not reported, as wellas projections of quality and financial performance settlements for providers. Generally, differencesbetween preliminary and final submissions are attributable to variation in the degree of accuracy withwhich payers predicted finalized member eligibility, claims payments, performance-based settlements,and members’ health status. These estimates are often based on historical or market trends, whichmay or may not accurately reflect a Massachusetts market that is evolving under ACA implementationand as payers introduce new payment arrangements. Final data, which allows for a fifteen month claimsrun-out period, updates the initial estimates with the actual claims and non-claims experience for theperformance period. This section outlines differences between the initial and final THCE calculations forthe 2013-2014 performance period.Public CoverageInitial THCE calculations showed a 7.1% increase in total spending for public coverage in 2014, whichwas revised downward to 6.7% based on the final analysis. MassHealth spending growth was initiallyreported as 18.5% overall, but final data indicated a trend of 17.9%. This difference was attributablemainly to lower spending reported for finalized non-claims based payments and lower spendingreported by MassHealth MCOs. The initial Medicare spending trend (2.1%) was revised to 1.8% withfinal data. This resulted from lower spending reported by Medicare Advantage (Part C) plans. Reportedspending levels for Medicare Parts A, B, and D were nearly unchanged across initial and final analyses.Private Commercial InsuranceThe initial total commercial spending estimate for 2014 was 18.9 billion, compared with a finalamount of 19.4 billion. An initial trend of 2.9% growth was revised slightly downward to 2.8%. Thedifference is almost entirely attributable to a change in reporting by United Healthcare. In final reporting,United Healthcare updated 2013 and 2014 spending to correctly include spending for Massachusettsmembers covered by policies that were issued (or sitused) out of state. The increase in UnitedHealthcare spending accounted for 84.0% of the overall increase in spending between the initial andfinal commercial spending.Net Cost of Private Health InsuranceThe initial 2014 NCPHI trend of 1.7% spending growth was revised with final data to a decline of 1.4%.This variation is largely attributable to the availability of more comprehensive data at the time final resultsare calculated.**C HIA’s standard approach is to update the NCPHI data sources for final THCE analysis to reflect more comprehensiveinformation that is used as the basis for actual rebates to consumers, the Massachusetts Medical Loss Ratio reports (MMLR).Because MMLR data is not available when initial NCPHI calculations are made, the Supplemental Health Care Exhibit (SHCE)from the National Association of Insurance Commissioners is used for the merged, large group fully-insured and self-insuredmarkets. Final NCPHI is updated using the MMLR data, which may differ slightly from SHCE data.www.chiamass.gov/2016annualreportcenter for health information and analysis13
A CLOSER LOOKPAYMENTS TO PHARMACIES FOR PRESCRIPTION DRUGSAND PAYER REBATES IN THCEPharmacy SpendingPharmacy spending growth between 2014and 2015 accounted for approximately onethird of the overall growth in THCE per capita.In 2015, payers reported prescription drugspending for Massachusetts residents thatincreased by 10.1% to 8.1 billion, followinga 13.5% increase in 2014.33In 2015, pharmacy spending for the privatecommercially insured grew by 11.0%.Medicare had the highest pharmacy spendinggrowth between 2014 and 2015 at 14.0%,while MassHealth pharmacy spending grew by9.1%. On a PMPM basis, pharmacy spendingincreased 8.5% among commercial plans andMedicare. In contrast, pharmacy spendingPMPM for MassHealth FFS, MCO, and PCCplan members declined by 3.2%.Prescription Drug RebatesUnderstanding pharmacy expenditures iscomplicated by prescription drug rebatesthat are paid by manufacturers to pharmacybenefit managers (PBMs), who may sharesome portion of rebates with insurers, selffunded employers, and public insuranceprograms. PBMs typically negotiate withmanufacturers for rebates on a drug-by-drugbasis, and rebates vary considerably by payerand drug.34 Ultimately, rebates are paid tothe PBM after a pharmacy has been paid forthe drug, and are not included in the recordof payment at the point-of-sale.35 BecauseTHCE reflects payments made by payers andpatients to providers for health care services,prescription drug rebates transmitted outside14center for health information and analysisof the payer-provider relationship are notcaptured in the reported prescription drugspending identified in THCE.Prescription drug rebates are reflected inthe calculation of the NCPHI component ofTHCE. Specifically, prescription drug rebatesreceived by health insurers are deducted fromincurred claim expenses when calculatingNCPHI. Broadly, the total NCPHI amount isintended to measure the difference betweenpayer revenues and net incurred claimsexpenses. By accounting for rebates receivedby private health insurers, NCPHI moreaccurately reflects the difference betweenpayer revenues and net incurred claims.36However, it is
MassHealth spending grew by 17.9%, largely because of increased enrollment as the Affordable Care Act (ACA) was implemented in the Commonwealth.8 In 2015, MassHealth was the primary payer for 70.4% of its membership, 9 accounting for 54.0% of total MassHealth spending. 10 MassHealth also